More Related Content
Similar to 2010 February Delaware County MSI And Avg Dom
Similar to 2010 February Delaware County MSI And Avg Dom (18)
More from Prudential Fox & Roach, Realtors
More from Prudential Fox & Roach, Realtors (20)
2010 February Delaware County MSI And Avg Dom
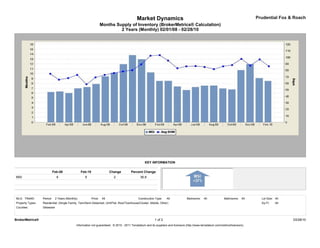
- 1. Market Dynamics Prudential Fox & Roach
Months Supply of Inventory (BrokerMetrics® Calculation)
2 Years (Monthly) 02/01/08 - 02/28/10
KEY INFORMATION
Feb-08 Feb-10 Change Percent Change
MSI 6 9 2 36.8
MLS: TReND Period: 2 Years (Monthly) Price: All Construction Type: All Bedrooms: All Bathrooms: All Lot Size: All
Property Types: Residential: (Single Family, Twin/Semi-Detached, Unit/Flat, Row/Townhouse/Cluster, Mobile, Other) Sq Ft: All
Counties: Delaware
BrokerMetrics® 1 of 2 03/28/10
Information not guaranteed. © 2010 - 2011 Terradatum and its suppliers and licensors (http://www.terradatum.com/metrics/licensors).
- 2. Market Dynamics Prudential Fox & Roach
Months Supply of Inventory (BrokerMetrics® Calculation)
2 Years (Monthly) 02/01/08 - 02/28/10
Time # For Sale Last # Under
Period MSI NAR MSI Day of Month Contract # Sold
Feb-10 8.5 13.9 3,180 374 229
Jan-10 9.1 12.9 3,163 348 245
Dec-09 12.0 9.2 3,048 255 332
Nov-09 10.7 5.8 3,347 312 579
Oct-09 6.8 6.6 3,424 507 515
Sep-09 6.9 8.2 3,535 509 431
Aug-09 7.5 6.9 3,508 465 512
Jul-09 7.5 6.3 3,565 474 568
Jun-09 7.2 6.3 3,576 494 569
May-09 6.6 9.1 3,659 552 403
Apr-09 7.4 10.2 3,685 500 360
Mar-09 8.5 10.4 3,517 413 337
Feb-09 8.5 14.3 3,341 393 233
Jan-09 10.2 13.7 3,238 316 236
Dec-08 13.0 9.4 3,280 253 350
Nov-08 13.8 12.4 3,533 256 286
Oct-08 11.9 9.4 3,668 307 392
Sep-08 10.2 8.8 3,687 362 421
Aug-08 9.4 7.1 3,617 383 513
Jul-08 7.9 7.2 3,641 462 503
Jun-08 7.2 6.1 3,605 498 594
May-08 7.0 6.9 3,551 509 517
Apr-08 6.0 7.3 3,453 574 470
Mar-08 6.3 7.3 3,242 512 443
Feb-08 6.2 8.5 3,133 504 369
BrokerMetrics® 2 of 2 03/28/10
Information not guaranteed. © 2010 - 2011 Terradatum and its suppliers and licensors (http://www.terradatum.com/metrics/licensors).