More Related Content
Similar to Delaware county msi and avg dom (17)
More from Prudential Fox & Roach, Realtors (20)
Delaware county msi and avg dom
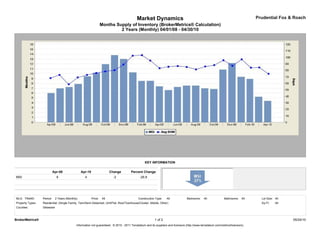
- 1. Market Dynamics Prudential Fox & Roach
Months Supply of Inventory (BrokerMetrics® Calculation)
2 Years (Monthly) 04/01/08 - 04/30/10
KEY INFORMATION
Apr-08 Apr-10 Change Percent Change
MSI 6 4 -2 -26.8
MLS: TReND Period: 2 Years (Monthly) Price: All Construction Type: All Bedrooms: All Bathrooms: All Lot Size: All
Property Types: Residential: (Single Family, Twin/Semi-Detached, Unit/Flat, Row/Townhouse/Cluster, Mobile, Other) Sq Ft: All
Counties: Delaware
BrokerMetrics® 1 of 2 05/24/10
Information not guaranteed. © 2010 - 2011 Terradatum and its suppliers and licensors (http://www.terradatum.com/metrics/licensors).
- 2. Market Dynamics Prudential Fox & Roach
Months Supply of Inventory (BrokerMetrics® Calculation)
2 Years (Monthly) 04/01/08 - 04/30/10
Time # For Sale Last # Under
Period MSI NAR MSI Day of Month Contract # Sold
Apr-10 4.4 7.5 3,494 793 463
Mar-10 5.2 9.2 3,444 656 373
Feb-10 8.9 13.9 3,272 367 236
Jan-10 9.3 13.0 3,231 346 248
Dec-09 12.2 9.3 3,104 255 334
Nov-09 10.8 5.9 3,391 313 577
Oct-09 6.8 6.7 3,459 506 515
Sep-09 7.0 8.3 3,563 510 431
Aug-09 7.5 6.9 3,528 468 514
Jul-09 7.5 6.3 3,576 474 569
Jun-09 7.3 6.3 3,585 494 569
May-09 6.6 9.1 3,665 553 403
Apr-09 7.4 10.2 3,689 499 360
Mar-09 8.5 10.4 3,519 413 337
Feb-09 8.5 14.3 3,343 393 233
Jan-09 10.2 13.7 3,239 316 236
Dec-08 13.0 9.4 3,281 252 350
Nov-08 13.8 12.4 3,533 256 286
Oct-08 11.9 9.4 3,668 307 392
Sep-08 10.2 8.8 3,687 362 421
Aug-08 9.4 7.0 3,617 383 514
Jul-08 7.9 7.2 3,641 462 503
Jun-08 7.2 6.1 3,605 498 594
May-08 7.0 6.9 3,551 509 517
Apr-08 6.0 7.3 3,453 574 470
BrokerMetrics® 2 of 2 05/24/10
Information not guaranteed. © 2010 - 2011 Terradatum and its suppliers and licensors (http://www.terradatum.com/metrics/licensors).