2010 March Bucks County MSI and Avg Days on Market Analysis
•
0 likes•105 views

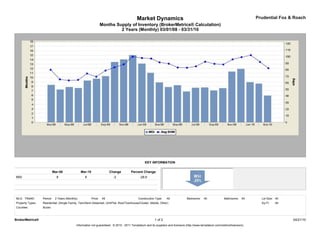
The document analyzes housing market dynamics in Bucks County, PA from March 2008 to March 2010. It shows that the months supply of housing inventory decreased from 8 months in March 2008 to 6 months in March 2010, a 28.6% drop. The months supply of inventory (MSI) measures the number of months it would take to sell all listed homes at the current sales rate. A lower MSI indicates a stronger seller's market with less inventory and shorter times on market.

Recommended
Recommended
More Related Content
What's hot
What's hot (12)
Viewers also liked
Viewers also liked (19)
Similar to 2010 March Bucks County MSI and Avg Days on Market Analysis
Similar to 2010 March Bucks County MSI and Avg Days on Market Analysis (18)
More from Prudential Fox & Roach, Realtors
More from Prudential Fox & Roach, Realtors (20)
Recently uploaded
Recently uploaded (20)
2010 March Bucks County MSI and Avg Days on Market Analysis
- 1. Market Dynamics Prudential Fox & Roach Months Supply of Inventory (BrokerMetrics® Calculation) 2 Years (Monthly) 03/01/08 - 03/31/10 KEY INFORMATION Mar-08 Mar-10 Change Percent Change MSI 8 6 -2 -28.6 MLS: TReND Period: 2 Years (Monthly) Price: All Construction Type: All Bedrooms: All Bathrooms: All Lot Size: All Property Types: Residential: (Single Family, Twin/Semi-Detached, Unit/Flat, Row/Townhouse/Cluster, Mobile, Other) Sq Ft: All Counties: Bucks BrokerMetrics® 1 of 2 04/21/10 Information not guaranteed. © 2010 - 2011 Terradatum and its suppliers and licensors (http://www.terradatum.com/metrics/licensors).
- 2. Market Dynamics Prudential Fox & Roach Months Supply of Inventory (BrokerMetrics® Calculation) 2 Years (Monthly) 03/01/08 - 03/31/10 Time # For Sale Last # Under Period MSI NAR MSI Day of Month Contract # Sold Mar-10 6.0 9.0 3,771 632 419 Feb-10 8.6 13.4 3,607 417 270 Jan-10 9.0 13.2 3,504 391 266 Dec-09 11.9 9.0 3,332 279 370 Nov-09 11.3 6.4 3,708 327 580 Oct-09 7.6 7.1 3,923 514 552 Sep-09 7.1 8.0 4,057 570 509 Aug-09 7.8 6.8 4,140 532 607 Jul-09 7.7 6.9 4,280 555 623 Jun-09 6.9 7.2 4,358 634 603 May-09 8.3 10.4 4,433 535 425 Apr-09 7.9 11.1 4,337 551 391 Mar-09 8.9 11.6 4,196 471 363 Feb-09 11.1 17.3 3,983 360 230 Jan-09 13.1 16.9 3,843 293 228 Dec-08 15.0 10.3 3,735 249 362 Nov-08 14.1 12.8 4,048 288 316 Oct-08 13.5 9.8 4,269 317 435 Sep-08 10.3 9.2 4,323 419 470 Aug-08 9.7 7.7 4,439 456 573 Jul-08 9.3 7.4 4,455 478 600 Jun-08 7.7 7.3 4,508 589 621 May-08 7.9 9.0 4,529 575 506 Apr-08 7.3 9.0 4,325 591 480 Mar-08 8.4 9.6 4,063 486 424 BrokerMetrics® 2 of 2 04/21/10 Information not guaranteed. © 2010 - 2011 Terradatum and its suppliers and licensors (http://www.terradatum.com/metrics/licensors).