More Related Content
Similar to Montgomery County MSI and Avg DOM
Similar to Montgomery County MSI and Avg DOM (16)
More from Prudential Fox & Roach, Realtors
More from Prudential Fox & Roach, Realtors (20)
Montgomery County MSI and Avg DOM
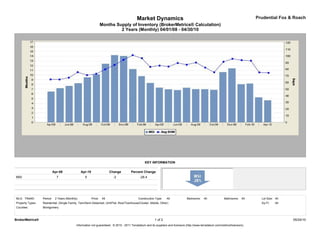
- 1. Market Dynamics Prudential Fox & Roach
Months Supply of Inventory (BrokerMetrics® Calculation)
2 Years (Monthly) 04/01/08 - 04/30/10
KEY INFORMATION
Apr-08 Apr-10 Change Percent Change
MSI 7 5 -2 -28.4
MLS: TReND Period: 2 Years (Monthly) Price: All Construction Type: All Bedrooms: All Bathrooms: All Lot Size: All
Property Types: Residential: (Single Family, Twin/Semi-Detached, Unit/Flat, Row/Townhouse/Cluster, Mobile, Other) Sq Ft: All
Counties: Montgomery
BrokerMetrics® 1 of 2 05/24/10
Information not guaranteed. © 2010 - 2011 Terradatum and its suppliers and licensors (http://www.terradatum.com/metrics/licensors).
- 2. Market Dynamics Prudential Fox & Roach
Months Supply of Inventory (BrokerMetrics® Calculation)
2 Years (Monthly) 04/01/08 - 04/30/10
Time # For Sale Last # Under
Period MSI NAR MSI Day of Month Contract # Sold
Apr-10 4.7 7.0 5,244 1,126 745
Mar-10 5.3 8.7 5,038 952 580
Feb-10 8.2 13.2 4,714 574 356
Jan-10 8.1 12.9 4,626 573 358
Dec-09 11.4 8.4 4,489 393 534
Nov-09 10.6 5.7 4,976 468 873
Oct-09 6.9 6.5 5,123 745 785
Sep-09 7.0 7.2 5,327 760 735
Aug-09 7.0 6.6 5,357 763 817
Jul-09 7.3 6.5 5,531 756 852
Jun-09 6.8 6.4 5,579 817 873
May-09 7.0 8.7 5,658 810 647
Apr-09 7.3 11.0 5,644 769 512
Mar-09 8.3 11.8 5,467 656 463
Feb-09 9.8 14.2 5,190 531 366
Jan-09 11.3 16.1 5,009 444 311
Dec-08 14.1 10.1 5,046 359 498
Nov-08 14.2 11.3 5,462 384 484
Oct-08 12.4 9.5 5,705 460 602
Sep-08 10.2 8.8 5,816 573 661
Aug-08 9.5 7.3 5,755 604 793
Jul-08 8.3 7.0 5,897 713 837
Jun-08 7.7 6.4 5,919 768 928
May-08 7.2 7.3 5,897 816 805
Apr-08 6.5 8.3 5,700 876 687
BrokerMetrics® 2 of 2 05/24/10
Information not guaranteed. © 2010 - 2011 Terradatum and its suppliers and licensors (http://www.terradatum.com/metrics/licensors).