More Related Content
Similar to Chester county msi and avg dom
Similar to Chester county msi and avg dom (15)
More from Prudential Fox & Roach, Realtors
More from Prudential Fox & Roach, Realtors (20)
Chester county msi and avg dom
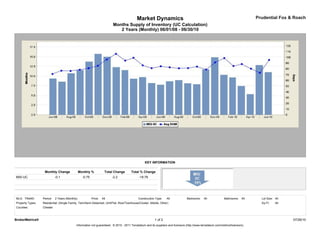
- 1. Market Dynamics Prudential Fox & Roach
Months Supply of Inventory (UC Calculation)
2 Years (Monthly) 06/01/08 - 06/30/10
KEY INFORMATION
Monthly Change Monthly % Total Change Total % Change
MSI-UC -0.1 -0.75 -2.2 -18.78
MLS: TReND Period: 2 Years (Monthly) Price: All Construction Type: All Bedrooms: All Bathrooms: All Lot Size: All
Property Types: Residential: (Single Family, Twin/Semi-Detached, Unit/Flat, Row/Townhouse/Cluster, Mobile, Other) Sq Ft: All
Counties: Chester
BrokerMetrics® 1 of 2 07/26/10
Information not guaranteed. © 2010 - 2011 Terradatum and its suppliers and licensors (http://www.terradatum.com/metrics/licensors).
- 2. Market Dynamics Prudential Fox & Roach
Months Supply of Inventory (UC Calculation)
2 Years (Monthly) 06/01/08 - 06/30/10
Time # For Sale Last # Under
Period MSI NAR MSI Day of Month Contract # Sold
Jun-10 11.0 5.9 4,078 371 695
May-10 12.8 8.4 4,044 315 479
Apr-10 5.3 9.3 3,881 729 417
Mar-10 7.4 10.3 3,754 505 365
Feb-10 9.7 17.9 3,523 365 197
Jan-10 10.3 13.9 3,450 335 248
Dec-09 14.8 9.8 3,326 224 341
Nov-09 11.7 6.5 3,635 310 555
Oct-09 7.9 7.9 3,753 476 478
Sep-09 8.1 9.1 3,895 479 430
Aug-09 8.9 7.9 4,012 449 508
Jul-09 8.6 8.0 4,070 471 511
Jun-09 7.8 7.7 4,105 529 530
May-09 8.2 11.4 4,167 509 366
Apr-09 9.7 12.9 4,079 420 317
Mar-09 9.3 13.0 3,848 413 297
Feb-09 11.5 15.4 3,666 318 238
Jan-09 12.3 15.8 3,564 290 225
Dec-08 15.0 12.7 3,582 239 282
Nov-08 15.7 12.7 3,869 246 305
Oct-08 13.7 11.7 4,022 293 343
Sep-08 11.5 9.8 4,027 349 411
Aug-08 10.7 7.6 3,971 371 521
Jul-08 8.5 7.4 4,096 480 550
Jun-08 9.4 7.3 4,204 449 579
BrokerMetrics® 2 of 2 07/26/10
Information not guaranteed. © 2010 - 2011 Terradatum and its suppliers and licensors (http://www.terradatum.com/metrics/licensors).