Chad perfil estadístico Mortalidad
•
0 likes•306 views

Chad perfil estadístico Mortalidad ONU

Recommended
Recommended
More Related Content
Similar to Chad perfil estadístico Mortalidad
Similar to Chad perfil estadístico Mortalidad (20)
More from Pablo Ruiz
More from Pablo Ruiz (20)
Recently uploaded
Recently uploaded (20)
Chad perfil estadístico Mortalidad
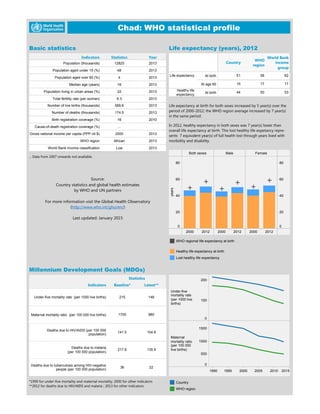
- 1. Indicators Statistics Baseline* Latest** Under-fivemortalityrate(per1000livebirths) Maternalmortalityratio(per100000livebirths) DeathsduetoHIV/AIDS(per100000 population) Deathsduetomalaria (per100000population) DeathsduetotuberculosisamongHIV-negative people(per100000population) 1700 980 217.8 215 148 141.5 135.9 104.8 36 22 Millennium DevelopmentGoals(MDGs) *1990forunder-fivemortalityandmaternalmortality;2000forotherindicators **2012fordeathsduetoHIV/AIDSandmalaria;2013forotherindicators Indicators Statistics Year Population(thousands) 12825 2013 Populationagedunder15(%) 48 2013 Populationagedover60(%) 4 2013 Medianage(years) 16 2013 Populationlivinginurbanareas(%) 22 2013 Totalfertilityrate(perwoman) 6.3 2013 Numberoflivebirths(thousands) 589.8 2013 Numberofdeaths(thousands) 174.5 2013 Birthregistrationcoverage(%) 16 2010 Cause-of-deathregistrationcoverage(%) … Grossnationalincomepercapita(PPPint$) 2000 2013 WHOregion African 2013 WorldBankincomeclassification Low 2013 Basicstatistics ...Datafrom2007onwardsnotavailable. Source: Countrystatisticsandglobalhealthestimates byWHOandUNpartners FormoreinformationvisittheGlobalHealthObservatory (http://www.who.int/gho/en/) Lastupdated:January2015 Chad:WHO statisticalprofile 1990 1995 2000 2005 2010 2015 Under-five mortalityrate (per1000live births) Maternal mortalityratio (per100000 livebirths) 0 100 200 0 500 1000 1500 Country WHOregion In2012,healthyexpectancyinbothsexeswas7year(s)lowerthan overalllifeexpectancyatbirth.Thislosthealthylifeexpetancyrepre- sents7equivalentyear(s)offullhealthlostthroughyearslivedwith morbidityanddisability. Country WHO region WorldBank income group Lifeexpectancy Atbirth Atage60 Healthylife expectancy Atbirth 17 62 17 58 15 51 535044 Lifeexpectancy(years),2012 Lifeexpectancyatbirthforbothsexesincreasedby5year(s)overthe periodof2000-2012;theWHOregionaverageincreasedby7year(s) inthesameperiod. Bothsexes Male Female 2000 2012 2000 2012 2000 2012 0 20 40 60 80 years 0 20 40 60 80 WHOregionallifeexpectancyatbirth Healthylifeexpectancyatbirth Losthealthylifeexpectancy
- 2. 1990 1995 2000 2005 2010 2015 0 20 40 60 80 100 Percentage DTP3immunizationamong 1-year-olds Chad:WHO statisticalprofile 1995 2000 2005 2010 2015 0 50 100 US$(ataverageexchangerate) Percapitatotalexpenditure onhealth 1990 1995 2000 2005 2010 2015 0 20 40 60 80 Percentage Childrenagedunder-5 stunted Contraceptive prevalence Antenatalcare (4+visits) Birthsattendedby skilledhealth personnel Measles immunization (1-yr-olds) Smear-positiveTB treatment-success Country WHOregion Country WHOregion Country WHOregion Country WHOregion Country WHOregion 0 50 100 Percentage 27 5 23 47 48 17 59 74 69 81 Utilisationofhealthservices* *Datarefertothelatestyearavailablefrom2007. ...Datanotavailableorapplicable. Country WHOregion Raisedbloodglucose (aged25+),2008 Male Female Raisedbloodpressure (aged25+),2008 Male Female Obesity(aged20+), 2008 Male Female Tobaccouse(aged15+), 2011 Male Female Country WHOregion Country WHOregion Country WHOregion Country WHOregion Country WHOregion Country WHOregion Country WHOregion Country WHOregion 0 20 40 60 80 Percentage 8.8 8.3 8.7 9.2 35.5 38.1 35.5 31.3 5.3 2.4 11.1 3.8 20 22 7 4 Adultriskfactors Source:CountrystatisticsandglobalhealthestimatesbyWHOandUNpartners FormoreinformationvisittheGlobalHealthObservatory(http://www.who.int/gho/en//) Lastupdated:January2015 1990 1995 2000 2005 2010 2015 0 20 40 60 80 100 Percentage Populationusingimproved waterandsanitation Improveddrinking-watersources Improvedsanitationfacilities 0 10 20 Percentageoftotal Othercauses Malaria Acuterespiratoryinfections Diarrhoea Prematurity Birthasphyxia Injuries Neonatalsepsis Congenitalanomalies HIV/AIDS Measles 19 19 17 12 11 5 8 3 0 4 2 Distributionofcausesofdeaths inchildrenunder-5,2013
- 3. Abc Top10causesofdeath Lowerrespiratoryinfectionswastheleadingcauseofdeath,killing24.7 thousandpeoplein2012 Burdenofdisease,2012 Disability-adjustedlifeyears(DALYs)arethesumofyears oflifelostduetoprematuremortality(YLL)andyearsof healthylifelostduetodisability(YLD). 0K 1K 2K 3K Maternal,neonatal,nutritional Otherinfectiousdiseases** HIV,TB,malaria Acuterespiratoryinfections OtherNCDs* Unintentionalinjuries Cardiovasculardiseasesanddiabetes Neuro-psychiatricconditions Chronicrespiratorydiseases Cancers Musculoskeletaldiseases Suicide,homicideandconflict DALYs,YLLandYLD(thousands)bybroadcausegroup *Othernoncommunicablediseases(NCDs)includingnon-malignant neoplasms;endocrine,bloodandimmunedisorders;senseorgan,di- gestive,genitourinary,andskindiseases;oralconditions;andcongen- italanomalies. **Infectiousdiseasesotherthanacuterespiratorydiseases,HIV,TB andmalaria. YLL YLD Male Females 2000 2012 2000 2012 0 20 40 60 80 deaths(thousands) Deathsbybroadcausegroup Beforeage15,allcauses Male Female Beforeage70,allcauses Male Female Betweenages15and49, frommaternalcauses Female Betweenages30and70,from4major noncommunicablediseases(NCDs)~ Both sexes 39% 44% 80% 85% 81% 23% Probabilityofdying,2012 Probabilityofdyingbetweenrelevantexactages,foraperson experiencingthe2012age-specificmortalityrisksthroughout theirlife. ~Cancers,cardiovasculardiseases,chronicrespiratorydiseasesand diabetes Rank decreased increased nochange Causes HIV,TB,malaria Acuterespiratoryinfections Otherinfectiousdiseases Maternal,neonatal,nutritional Cardiovasculardiseasesanddiabetes Cancers Chronicrespiratorydiseases OtherNCDs Suicide,homicideandconflict Unintentionalinjuries Source:Countrystatisticsandglobalhealthestimates byWHOandUNpartners FormoreinformationvisittheGlobalHealthObservatory (http://who.int/gho/mortality_burden_disease/en/) Lastupdated:January2015 Chad:WHO statisticalprofile Lowerrespiratoryinfections (14.2%) Diarrhoealdiseases(9.8%) Malaria(9.7%) HIV/AIDS(7.5%) Pretermbirthcomplications (5.3%) Meningitis(3.8%) Birthasphyxiaandbirth trauma(3.8%) Protein-energymalnutrition (3.7%) Maternalconditions(3.4%) Stroke(3.2%) 24.7 17.2 16.9 13.0 9.3 6.7 6.5 6.5 5.9 5.6 Noofdeaths(000s) 2012 Crudedeathrate 2000-2012 Changeinrank 2000-2012