
Recommended
More Related Content
What's hot
What's hot (19)
Similar to Calc pao.meza
Similar to Calc pao.meza (20)
More from Nancy Meza
Recently uploaded
Recently uploaded (20)
Calc pao.meza
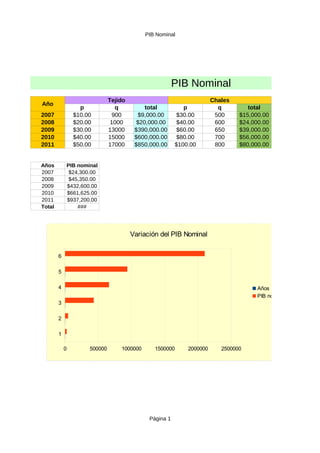
- 1. PIB Nominal Variación del PIB Nominal Página 1 PIB Nominal Año Tejido Chales p q total p q total 2007 $10.00 900 $9,000.00 $30.00 500 $15,000.00 2008 $20.00 1000 $20,000.00 $40.00 600 $24,000.00 2009 $30.00 13000 $390,000.00 $60.00 650 $39,000.00 2010 $40.00 15000 $600,000.00 $80.00 700 $56,000.00 2011 $50.00 17000 $850,000.00 $100.00 800 $80,000.00 Años PIB nominal 2007 $24,300.00 2008 $45,350.00 2009 $432,600.00 2010 $661,625.00 2011 $937,200.00 Total ### 6 5 4 3 2 1 0 500000 1000000 1500000 2000000 2500000 Años PIB nominal
- 2. PIB Nominal Página 2 Ponchos p q total $15.00 20 $300.00 $30.00 45 $1,350.00 $60.00 60 $3,600.00 $75.00 75 $5,625.00 $90.00 80 $7,200.00 2500000 Años PIB nominal
- 3. PIB Real Variación del PIB Real Página 3 PIB Real Año Tejido Chales p q total p q total 2007 $10.00 900 $9,000.00 $30.00 500 $15,000.00 2008 $10.00 1000 $10,000.00 $30.00 600 $18,000.00 2009 $10.00 13000 $130,000.00 $30.00 650 $19,500.00 2010 $10.00 15000 $150,000.00 $30.00 700 $21,000.00 2011 $10.00 17000 $170,000.00 $30.00 800 $24,000.00 Años PIB Real 2007 $24,300.00 2008 $28,675.00 2009 $150,400.00 2010 $172,125.00 2011 $195,200.00 Total $570,700.00 6 5 4 3 2 1 0 100000 200000 300000 400000 500000 600000 Años PIB Real