SlideShare a Scribd company logo
1 of 37
Download to read offline
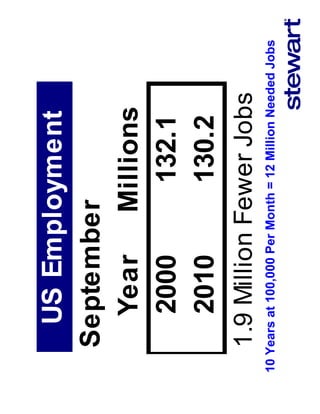
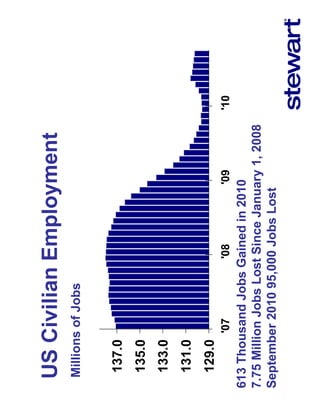
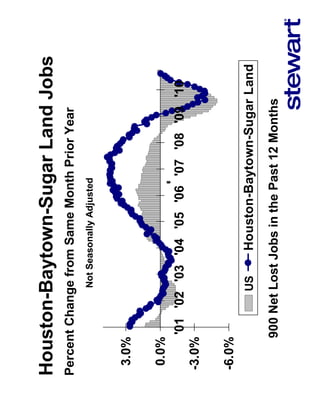
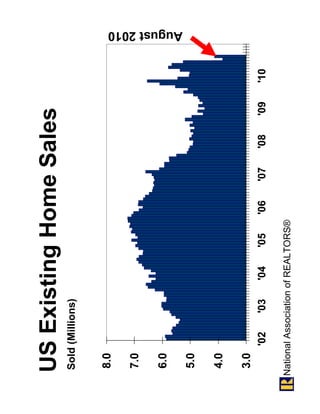
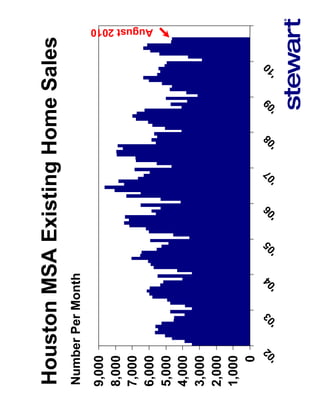
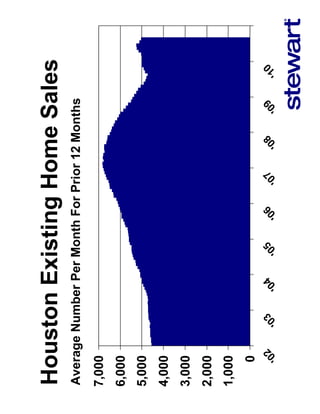
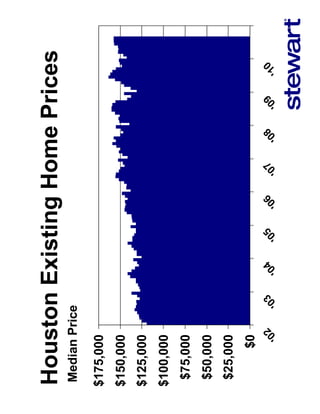
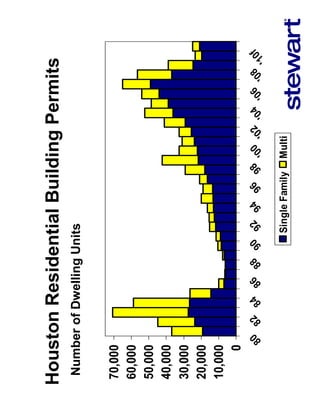
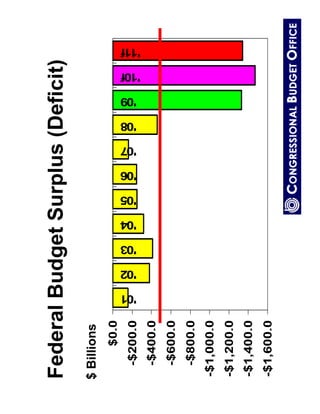
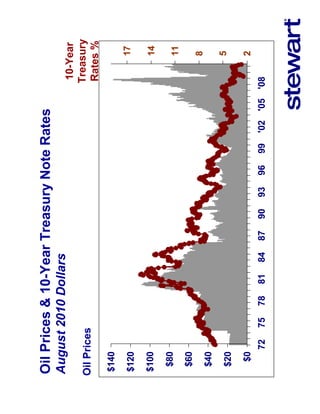
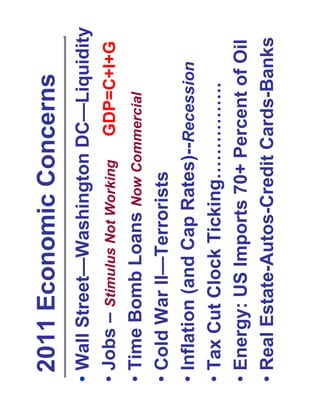
New Business Model For the 2011 Economy
      Adapt, Mutate, Migrate or Die
       An Economic and Real Estate Forecast
Ted C. Jones, PhD Chief Economist Stewart Title Guaranty Co.
The New Business Model


 i.e. Things are different today…..
The New Business Model

1. Cost Control is
   Essential

2. Consumers Have
   Changed Expectations

3. Less is More
US Employment
    September
      Year  Millions
      2000    132.1
      2010    130.2
    1.9 Million Fewer Jobs
10 Years at 100,000 Per Month = 12 Million Needed Jobs
US Civilian Employment
 Millions of Jobs


  137.0
  135.0
  133.0
  131.0
  129.0
          '07        '08         '09           '10
613 Thousand Jobs Gained in 2010
7.75 Million Jobs Lost Since January 1, 2008
September 2010 95,000 Jobs Lost
Houston-Baytown-Sugar Land Jobs
Percent Change from Same Month Prior Year
               Not Seasonally Adjusted


 3.0%

 0.0%                               7
                                    6

        '01 '02 '03 '04 '05 '06 '07 '08 '09 '10
-3.0%

-6.0%
              US      Houston-Baytown-Sugar Land
     900 Net Lost Jobs in the Past 12 Months
Recession Recovery

 The recovery in every
  recession since 1949
    has been led by a
     recovery in the
     housing market
Axiom #1
        There is No Such
       Thing as a National
       Real Estate Market
          or Economy
Nor is there even a generalized Orlando Market
US Existing Home Sales
 Sold (Millions)


 8.0

 7.0

 6.0
                                                                  August 2010


 5.0

 4.0

 3.0
       '02   '03    '04    '05      '06   '07   '08   '09   '10

National Association of REALTORS®
Houston MSA Existing Home Sales
Number Per Month
9,000
8,000
7,000
                                                          August 2010


6,000
5,000
4,000
3,000
2,000
1,000
    0
      2     3     4     5     6     7     8     9     0
    '0    '0    '0    '0    '0    '0    '0    '0    '1
Houston Existing Home Sales
Average Number Per Month For Prior 12 Months
7,000
6,000
5,000
4,000
3,000
2,000
1,000
   0
      2     3     4     5     6     7     8     9     0
    '0    '0    '0    '0    '0    '0    '0    '0    '1
Houston Existing Home Prices
Median Price

$175,000
$150,000
$125,000
$100,000
 $75,000
 $50,000
 $25,000
     $0
         2       3     4     5     6     7     8     9     0
       '0      '0    '0    '0    '0    '0    '0    '0    '1
Houston Residential Building Permits
 Number of Dwelling Units


70,000
60,000
50,000
40,000
30,000
20,000
10,000
     0
         80   82   84   86   88   90    92   94   96   98 ' 00 ' 0 2 ' 04 ' 0 6 ' 08 ' 1 0f

                                       Single Family      Multi
Federal Budget Surplus (Deficit)
$ Billions
     $0.0


             '01
                   '02
                         '03
                               '04
                                     '05
                                           '06
                                                 '07
                                                       '08
                                                             '09


  -$200.0
                                                                   '10f
                                                                          '11f


  -$400.0
  -$600.0
  -$800.0
-$1,000.0
-$1,200.0
-$1,400.0
-$1,600.0
Interest Expense on Debt Outstanding
$ Billions                                                                 2009
                                                                        $383 Billion
$500

$400

$300

$200

$100

  $0
       88 89 90 91 92 93 94 95 96 97 98 99 '00 '01 '02 '03 '04 '05 '06 '07 '08 09p
                                                                              '
2010 Budget
Department                        $ Billions
Agriculture                              25.7
Education                                46.7
Energy                                   26.4
Homeland Security                        42.7
Housing and Urban Development            43.7
Interior                                 12.0
NASA                                     18.7
Labor                                    13.3
State                                    53.9
Transportation                           73.3
Treasury                                 13.4
Environmental Protection Agency          10.5
Total                                   380.2
$533 Billion Spent   Remove Temporary
                        Census Jobs
723,000 Jobs YTD
                     -33,000 = $772,500
$737,200 Per Job           Per Job
Oil Prices & 10-Year Treasury Note Rates
August 2010 Dollars
                                                                  10-Year
Oil Prices                                                        Treasury
                                                                  Rates %
$140

$120                                                                   17

$100                                                                   14
 $80
                                                                       11
 $60
                                                                       8
 $40
                                                                       5
 $20

  $0                                                                   2
       72   75   78   81   84   87   90   93   96   99   '02 '05 '08
Oil Prices & Exchange Rates $US Per Euro
Oil in August 2010 Dollars                                    Dollars
                                                                Per
Oil Prices
Oil Price                                                      Euro

 $140
                                                               $1.65
 $120
 $100                                                          $1.45

  $80                                                          $1.25
  $60
                                                               $1.05
  $40
  $20                                                          $0.85
        '02   '03   '04   '05   '06   '07   '08   '09   '10
Why Interest Rates Are Going To Increase

Japanese Buyer of 2-Year Treasury Note in September 2008

                                             Dollar-Yen
                                             Exchange
Date     Event                  U.S. Dollars    Rate            Yen
9-2008   Purchase the Bond $ (100,000.00)         106.6   $   (10,660,000)
3-2009   Interest Payment       $     480.00       97.9   $        46,992
9-2009   Interest Payment       $     480.00       91.3   $        43,824
3-2010   Interest Payment       $     480.00       90.7   $        43,536
9-2010   Interest Payment       $     480.00       83.3   $        39,984
9-2010   Bond Redempetion $ 100,000.00             83.3   $     8,330,000
                   Total (With No Time Value of Money)    $    (2,155,664)
                      Return (No Time Value of Money)               -20.2%
Rates
                       Up 100
                       Basis
                       Points


   Ted’s Forecast
                        ‘10
                              Big 2011


9-1-2010 to 12-31-10
                               Upside…
Commercial Sales
                      Percent
         $ Billion    Change
 2007 $ 557.8
 2008 $ 181.6          -67.4%
 2009 $ 54.4           -70.0%
  $58 Billion Q1+Q2+Q3 2010
Forecast 2010 = $77.3 2010 +42%
Mortgage Bankers Association
Office Building
Washington, DC


 Purchased 2007       $79.0 Million
 Sold Feb 2010        $41.3 Million

 Loss             $37.7 Million
                   47.7 Percent
MIT Real Estate Group

 NCREIF
Estimated Current Property Value Compared to Q2 2010
                                       Property Type
  Acquisiton Date   Apartments    Industrial      Office       Retail
2000           Q1         41.3%        16.9%          26.7%        40.2%
               Q2         35.8%        13.9%          23.5%        43.6%
               Q3         30.5%        10.5%          20.7%        43.9%
               Q4         29.3%        10.9%          20.1%        50.2%
2001           Q1         30.8%          6.9%         21.1%        53.4%
               Q2         21.5%          4.1%         24.0%        46.1%
               Q3         22.2%          5.3%         28.7%        43.1%
               Q4         22.4%          7.7%         32.6%        44.4%
2002           Q1         21.3%        13.1%          26.8%        40.7%
               Q2         25.0%        10.6%          31.3%        37.5%
               Q3         24.5%          9.1%         22.9%        32.0%
               Q4         20.5%          4.3%         25.1%        24.2%
2003           Q1         21.6%          8.2%         23.7%        25.4%
               Q2         22.3%          3.8%         25.5%        17.7%
               Q3         18.7%         -2.0%         21.7%        28.5%
               Q4         18.0%         -2.9%         21.3%        20.2%
2004           Q1         19.3%         -4.2%         21.1%        15.5%
               Q2         14.7%       -10.0%          16.5%        10.0%
               Q3          8.5%         -9.3%         15.4%         3.8%
               Q4          6.2%         -9.7%         11.1%        -0.3%
2005           Q1         -2.2%         -6.7%           8.0%        1.2%
               Q2         -2.4%       -25.1%           -1.4%      -17.8%
               Q3        -17.1%       -26.0%           -7.7%      -20.6%
               Q4        -20.9%       -25.7%         -15.9%       -20.6%
Estimated Current Property Value Compared to Q2 2010
                     Estimated Percent Change in Value Since Acquisition
                                       Property Type
  Acquisiton Date   Apartments    Industrial      Office        Retail
2006           Q1        -23.8%        -32.8%        -19.4%        -21.8%
               Q2        -21.8%        -34.1%        -19.5%        -24.0%
               Q3        -21.1%        -32.6%        -24.5%        -25.6%
               Q4        -21.4%        -38.3%        -28.6%        -27.3%
2007           Q1        -19.6%        -39.6%        -30.9%        -28.3%
               Q2        -24.0%        -43.6%        -35.2%        -28.1%
               Q3        -27.7%        -41.8%        -35.7%        -27.1%
               Q4        -27.2%        -37.8%        -35.3%        -25.8%
2008           Q1        -26.8%        -38.0%        -33.7%        -21.9%
               Q2        -25.5%        -33.1%        -28.0%        -21.0%
               Q3        -24.5%        -31.7%        -26.6%        -21.3%
               Q4        -13.0%        -24.9%        -20.8%        -18.3%
2009           Q1         -8.3%         -5.4%        -17.3%        -14.8%
               Q2         -1.4%         -5.4%          -6.2%         -5.6%
               Q3         -1.1%         -4.1%          -0.6%         -1.2%
               Q4          8.0%         -2.1%           9.2%          4.3%
2010           Q1          5.4%          5.5%           5.0%          5.2%
               Q2          0.0%          0.0%           0.0%          0.0%
Commercial Lending
Four Quarter Moving Average Q1 2001 = 100
350

300

250

200

150

100

50

 0
        3     4     5     6     7     8     9     0
      '0    '0    '0    '0    '0    '0    '0    '1
Apartment
 Price Index
100.00%


90.00%


80.00%


70.00%


60.00%


50.00%
          '00   '01   '02   '03   '04   '05   '06   '07   '08   '09   '10
Texas Multifamily
Prices Down 10 to 15 Percent
      Since 2007 Peak

   Texas Industrial
Cap Rates Up 100 Basis Points
      From 6.5 Percent
  Value Down 13+ Percent
Multifamily Assessed
         Value
                            2007
             Percent        Texas
Years        Change       Apartment
2007-2008         -1.4%    Resales
2007-2008        22.6%
2007-2008        59.4%
2007-2009         -3.2%
2007-2009          8.7%
2007-2009        20.6%
2011 Economic Concerns
• Wall Street—Washington DC—Liquidity
• Jobs – Stimulus Not Working GDP=C+I+G
• Time Bomb Loans Now Commercial
• Cold War II—Terrorists
• Inflation (and Cap Rates)--Recession
• Tax Cut Clock Ticking…………….
• Energy: US Imports 70+ Percent of Oil
• Real Estate-Autos-Credit Cards-Banks
Ted’s Blog
http://blog.stewart.com/
Ted C. Jones, PhD Chief Economist
Stewart Title Guaranty Co.
http://blog.stewart.com/

More Related Content

What's hot

Analysis Coversheet Final
Analysis Coversheet FinalAnalysis Coversheet Final
Analysis Coversheet FinalJohn_Nuckel1
 
freddie mac Dividend Summary
freddie mac Dividend Summary freddie mac Dividend Summary
freddie mac Dividend Summary finance6
 
Area 4 hyde park, shoal creek, rosedale
Area 4   hyde park, shoal creek, rosedaleArea 4   hyde park, shoal creek, rosedale
Area 4 hyde park, shoal creek, rosedaleTaylor Real Estate
 
Risk Management Association\'s CRE Panel
Risk Management Association\'s CRE PanelRisk Management Association\'s CRE Panel
Risk Management Association\'s CRE Panelcesimpsoniii
 
Lesson 8 excel and survey’s
Lesson 8 excel and survey’sLesson 8 excel and survey’s
Lesson 8 excel and survey’sRamon Sahagun
 
Lesson 8 excel and survey’s rsj
Lesson 8 excel and survey’s rsjLesson 8 excel and survey’s rsj
Lesson 8 excel and survey’s rsjRamon Sahagun
 
Lesson 8 excel and survey’s rsj p.2
Lesson 8 excel and survey’s rsj p.2Lesson 8 excel and survey’s rsj p.2
Lesson 8 excel and survey’s rsj p.2Ramon Sahagun
 
Bd rev 102911
Bd rev 102911Bd rev 102911
Bd rev 102911kostyavs
 
Understanding Health Care
Understanding Health CareUnderstanding Health Care
Understanding Health CareSummit Health
 
39348363 google-earnings-slides-q3-2010
39348363 google-earnings-slides-q3-201039348363 google-earnings-slides-q3-2010
39348363 google-earnings-slides-q3-2010Pranav Bhatnagar
 
Areas 6, 7 78704 - Bouldin Creek, Barton Hills, Travis Heights
Areas 6, 7  78704 - Bouldin Creek, Barton Hills, Travis HeightsAreas 6, 7  78704 - Bouldin Creek, Barton Hills, Travis Heights
Areas 6, 7 78704 - Bouldin Creek, Barton Hills, Travis HeightsTaylor Real Estate
 

What's hot (19)

Analysis Coversheet Final
Analysis Coversheet FinalAnalysis Coversheet Final
Analysis Coversheet Final
 
freddie mac Dividend Summary
freddie mac Dividend Summary freddie mac Dividend Summary
freddie mac Dividend Summary
 
Area 4 hyde park, shoal creek, rosedale
Area 4   hyde park, shoal creek, rosedaleArea 4   hyde park, shoal creek, rosedale
Area 4 hyde park, shoal creek, rosedale
 
Risk Management Association\'s CRE Panel
Risk Management Association\'s CRE PanelRisk Management Association\'s CRE Panel
Risk Management Association\'s CRE Panel
 
$40 K Casita
$40 K Casita$40 K Casita
$40 K Casita
 
Growth Comes Knocking...
Growth Comes Knocking...Growth Comes Knocking...
Growth Comes Knocking...
 
The Woodlands Texas Real Estate Market
The Woodlands Texas Real Estate MarketThe Woodlands Texas Real Estate Market
The Woodlands Texas Real Estate Market
 
Dalkeith
DalkeithDalkeith
Dalkeith
 
DT Downtown
DT   DowntownDT   Downtown
DT Downtown
 
Project 2
Project 2Project 2
Project 2
 
A08 walk rock
A08 walk rockA08 walk rock
A08 walk rock
 
Lesson 8 excel and survey’s
Lesson 8 excel and survey’sLesson 8 excel and survey’s
Lesson 8 excel and survey’s
 
Lesson 8 excel and survey’s rsj
Lesson 8 excel and survey’s rsjLesson 8 excel and survey’s rsj
Lesson 8 excel and survey’s rsj
 
Lesson 8 excel and survey’s rsj p.2
Lesson 8 excel and survey’s rsj p.2Lesson 8 excel and survey’s rsj p.2
Lesson 8 excel and survey’s rsj p.2
 
Bd rev 102911
Bd rev 102911Bd rev 102911
Bd rev 102911
 
Understanding Health Care
Understanding Health CareUnderstanding Health Care
Understanding Health Care
 
39348363 google-earnings-slides-q3-2010
39348363 google-earnings-slides-q3-201039348363 google-earnings-slides-q3-2010
39348363 google-earnings-slides-q3-2010
 
Areas 6, 7 78704 - Bouldin Creek, Barton Hills, Travis Heights
Areas 6, 7  78704 - Bouldin Creek, Barton Hills, Travis HeightsAreas 6, 7  78704 - Bouldin Creek, Barton Hills, Travis Heights
Areas 6, 7 78704 - Bouldin Creek, Barton Hills, Travis Heights
 
July2010 stats
July2010 statsJuly2010 stats
July2010 stats
 

Viewers also liked (12)

HAR's The Edge 092710
HAR's The Edge 092710HAR's The Edge 092710
HAR's The Edge 092710
 
Edge043012
Edge043012Edge043012
Edge043012
 
Bob Harvey from the GHP on the Economics of Houston
Bob Harvey from the GHP on the Economics of HoustonBob Harvey from the GHP on the Economics of Houston
Bob Harvey from the GHP on the Economics of Houston
 
Edge041612
Edge041612Edge041612
Edge041612
 
HAR Market Study Report
HAR Market Study ReportHAR Market Study Report
HAR Market Study Report
 
Edge012312
Edge012312Edge012312
Edge012312
 
The EDGE: Week of September 19, 2011
The EDGE: Week of September 19, 2011The EDGE: Week of September 19, 2011
The EDGE: Week of September 19, 2011
 
The Edge: April 04, 2011
The Edge: April 04, 2011The Edge: April 04, 2011
The Edge: April 04, 2011
 
The BIG e 2011 - Ken Brand "Less Blah Blah - More Ah Ha"
The BIG e 2011 - Ken Brand "Less Blah Blah - More Ah Ha"The BIG e 2011 - Ken Brand "Less Blah Blah - More Ah Ha"
The BIG e 2011 - Ken Brand "Less Blah Blah - More Ah Ha"
 
Edge082211
Edge082211Edge082211
Edge082211
 
The Edge: Week of July 25, 2011
The Edge: Week of July 25, 2011The Edge: Week of July 25, 2011
The Edge: Week of July 25, 2011
 
Houston Association of REALTORS New Member Orientation
Houston Association of REALTORS New Member OrientationHouston Association of REALTORS New Member Orientation
Houston Association of REALTORS New Member Orientation
 

Similar to 2010 HAR REALTOR® Expo- Ted Jones, PhD

Ok Budget Outlook Nov09
Ok Budget Outlook Nov09Ok Budget Outlook Nov09
Ok Budget Outlook Nov09Jack Bewley
 
Borrw Deck
Borrw DeckBorrw Deck
Borrw Deckborrw
 
Nevada Association For Court Career Advancement Presentation Final
Nevada Association For Court Career Advancement Presentation FinalNevada Association For Court Career Advancement Presentation Final
Nevada Association For Court Career Advancement Presentation Finalintegreat
 
Realogics Urbnlivn Presentation
Realogics Urbnlivn PresentationRealogics Urbnlivn Presentation
Realogics Urbnlivn Presentationurbnlivn
 
2010 q3 google_earnings_slides
2010 q3 google_earnings_slides2010 q3 google_earnings_slides
2010 q3 google_earnings_slidesrabier
 
C6 further refine_alts_council_4-18_rev1
C6 further refine_alts_council_4-18_rev1C6 further refine_alts_council_4-18_rev1
C6 further refine_alts_council_4-18_rev1publicinvolvement
 
Mafia Wars Expense Guide
Mafia Wars Expense GuideMafia Wars Expense Guide
Mafia Wars Expense Guideguest26cede
 
Irs Audit Activity Am Best Conference 3 23 11 Forray
Irs Audit Activity Am Best Conference 3 23 11 ForrayIrs Audit Activity Am Best Conference 3 23 11 Forray
Irs Audit Activity Am Best Conference 3 23 11 ForraySusanJF
 
Portfolio Recover Assoc (PRAA) Pitch (Oct 2011)
Portfolio Recover Assoc (PRAA) Pitch (Oct 2011)Portfolio Recover Assoc (PRAA) Pitch (Oct 2011)
Portfolio Recover Assoc (PRAA) Pitch (Oct 2011)Chris Hemmelgarn
 
Q3 2012 Conference Call and Webcast Presentation
Q3  2012 Conference Call and Webcast PresentationQ3  2012 Conference Call and Webcast Presentation
Q3 2012 Conference Call and Webcast PresentationClaude Resources Inc.
 
Regional demographic charts for fbidc website 2012
Regional demographic charts for fbidc website 2012Regional demographic charts for fbidc website 2012
Regional demographic charts for fbidc website 2012jfreeman809
 
2012 Investment Review (Us)
2012 Investment Review (Us)2012 Investment Review (Us)
2012 Investment Review (Us)andrewyoungkofc
 

Similar to 2010 HAR REALTOR® Expo- Ted Jones, PhD (20)

Ok Budget Outlook Nov09
Ok Budget Outlook Nov09Ok Budget Outlook Nov09
Ok Budget Outlook Nov09
 
Borrw Deck
Borrw DeckBorrw Deck
Borrw Deck
 
Nevada Association For Court Career Advancement Presentation Final
Nevada Association For Court Career Advancement Presentation FinalNevada Association For Court Career Advancement Presentation Final
Nevada Association For Court Career Advancement Presentation Final
 
Realogics Urbnlivn Presentation
Realogics Urbnlivn PresentationRealogics Urbnlivn Presentation
Realogics Urbnlivn Presentation
 
2010 q3 google_earnings_slides
2010 q3 google_earnings_slides2010 q3 google_earnings_slides
2010 q3 google_earnings_slides
 
C6 further refine_alts_council_4-18_rev1
C6 further refine_alts_council_4-18_rev1C6 further refine_alts_council_4-18_rev1
C6 further refine_alts_council_4-18_rev1
 
Samp2
Samp2 Samp2
Samp2
 
Calc pao.meza
Calc pao.mezaCalc pao.meza
Calc pao.meza
 
Calc pao.meza
Calc pao.mezaCalc pao.meza
Calc pao.meza
 
Mafia Wars Expense Guide
Mafia Wars Expense GuideMafia Wars Expense Guide
Mafia Wars Expense Guide
 
Irs Audit Activity Am Best Conference 3 23 11 Forray
Irs Audit Activity Am Best Conference 3 23 11 ForrayIrs Audit Activity Am Best Conference 3 23 11 Forray
Irs Audit Activity Am Best Conference 3 23 11 Forray
 
Houston Market Report March 2010
Houston Market Report March 2010Houston Market Report March 2010
Houston Market Report March 2010
 
Houston Market Report June 2010
Houston Market Report June 2010Houston Market Report June 2010
Houston Market Report June 2010
 
Portfolio Recover Assoc (PRAA) Pitch (Oct 2011)
Portfolio Recover Assoc (PRAA) Pitch (Oct 2011)Portfolio Recover Assoc (PRAA) Pitch (Oct 2011)
Portfolio Recover Assoc (PRAA) Pitch (Oct 2011)
 
Q3 2012 Conference Call and Webcast Presentation
Q3  2012 Conference Call and Webcast PresentationQ3  2012 Conference Call and Webcast Presentation
Q3 2012 Conference Call and Webcast Presentation
 
Regional demographic charts for fbidc website 2012
Regional demographic charts for fbidc website 2012Regional demographic charts for fbidc website 2012
Regional demographic charts for fbidc website 2012
 
Feb 2013 market seminar
Feb 2013 market seminarFeb 2013 market seminar
Feb 2013 market seminar
 
Bond Valuation
Bond ValuationBond Valuation
Bond Valuation
 
2012 Investment Review (Us)
2012 Investment Review (Us)2012 Investment Review (Us)
2012 Investment Review (Us)
 
Houston Market Report August 2010
Houston Market Report August 2010Houston Market Report August 2010
Houston Market Report August 2010
 

More from Houston Association of REALTORS®

International 101 - Next Steps in the Process (Allan Tiller)
International 101 - Next Steps in the Process (Allan Tiller)International 101 - Next Steps in the Process (Allan Tiller)
International 101 - Next Steps in the Process (Allan Tiller)Houston Association of REALTORS®
 
International 101 - The Global Economic Landscape (Dr. Ted C. Jones)
International 101 - The Global Economic Landscape (Dr. Ted C. Jones)International 101 - The Global Economic Landscape (Dr. Ted C. Jones)
International 101 - The Global Economic Landscape (Dr. Ted C. Jones)Houston Association of REALTORS®
 
International 101 - Texas Today and Tomorrow (Richard Miranda)
International 101 - Texas Today and Tomorrow (Richard Miranda)International 101 - Texas Today and Tomorrow (Richard Miranda)
International 101 - Texas Today and Tomorrow (Richard Miranda)Houston Association of REALTORS®
 
International 101 - How to Attract Foreign Clients & Meet Your Objectives (Pe...
International 101 - How to Attract Foreign Clients & Meet Your Objectives (Pe...International 101 - How to Attract Foreign Clients & Meet Your Objectives (Pe...
International 101 - How to Attract Foreign Clients & Meet Your Objectives (Pe...Houston Association of REALTORS®
 
International 101 - International Buyer Profile (Dr. Oscar Gonzales)
International 101 - International Buyer Profile (Dr. Oscar Gonzales)International 101 - International Buyer Profile (Dr. Oscar Gonzales)
International 101 - International Buyer Profile (Dr. Oscar Gonzales)Houston Association of REALTORS®
 
Kirk Coburn & Surge on Energy & Technology Growth in Houston
Kirk Coburn & Surge on Energy & Technology Growth in HoustonKirk Coburn & Surge on Energy & Technology Growth in Houston
Kirk Coburn & Surge on Energy & Technology Growth in HoustonHouston Association of REALTORS®
 

More from Houston Association of REALTORS® (20)

A Look Inside HAR
A Look Inside HARA Look Inside HAR
A Look Inside HAR
 
Disruptive Forces Impacting the Real Estate Industry
Disruptive Forces Impacting the Real Estate IndustryDisruptive Forces Impacting the Real Estate Industry
Disruptive Forces Impacting the Real Estate Industry
 
International 101 - Next Steps in the Process (Allan Tiller)
International 101 - Next Steps in the Process (Allan Tiller)International 101 - Next Steps in the Process (Allan Tiller)
International 101 - Next Steps in the Process (Allan Tiller)
 
International 101 - Spotlight on Asia (Susan Annoura)
International 101 - Spotlight on Asia (Susan Annoura)International 101 - Spotlight on Asia (Susan Annoura)
International 101 - Spotlight on Asia (Susan Annoura)
 
International 101 - The Global Economic Landscape (Dr. Ted C. Jones)
International 101 - The Global Economic Landscape (Dr. Ted C. Jones)International 101 - The Global Economic Landscape (Dr. Ted C. Jones)
International 101 - The Global Economic Landscape (Dr. Ted C. Jones)
 
International 101 - Texas Today and Tomorrow (Richard Miranda)
International 101 - Texas Today and Tomorrow (Richard Miranda)International 101 - Texas Today and Tomorrow (Richard Miranda)
International 101 - Texas Today and Tomorrow (Richard Miranda)
 
International 101 - How to Attract Foreign Clients & Meet Your Objectives (Pe...
International 101 - How to Attract Foreign Clients & Meet Your Objectives (Pe...International 101 - How to Attract Foreign Clients & Meet Your Objectives (Pe...
International 101 - How to Attract Foreign Clients & Meet Your Objectives (Pe...
 
International 101 - International Buyer Profile (Dr. Oscar Gonzales)
International 101 - International Buyer Profile (Dr. Oscar Gonzales)International 101 - International Buyer Profile (Dr. Oscar Gonzales)
International 101 - International Buyer Profile (Dr. Oscar Gonzales)
 
2013 H-Town Day: Catherine Mosbacher
2013 H-Town Day: Catherine Mosbacher2013 H-Town Day: Catherine Mosbacher
2013 H-Town Day: Catherine Mosbacher
 
2013 H-town Day: Trudi Smith
2013 H-town Day: Trudi Smith2013 H-town Day: Trudi Smith
2013 H-town Day: Trudi Smith
 
2013 H-Town Day: Kirk Coburn
2013 H-Town Day: Kirk Coburn2013 H-Town Day: Kirk Coburn
2013 H-Town Day: Kirk Coburn
 
2013 H-Town Day: Dr. Stephen Klineberg
2013 H-Town Day: Dr. Stephen Klineberg2013 H-Town Day: Dr. Stephen Klineberg
2013 H-Town Day: Dr. Stephen Klineberg
 
2013 H-Town Day: Bob Harvey
2013 H-Town Day: Bob Harvey2013 H-Town Day: Bob Harvey
2013 H-Town Day: Bob Harvey
 
2013 H-Town Day: Bob Hale
2013 H-Town Day: Bob Hale2013 H-Town Day: Bob Hale
2013 H-Town Day: Bob Hale
 
2013 H-Town Day: John L. Nau, III
2013 H-Town Day: John L. Nau, III2013 H-Town Day: John L. Nau, III
2013 H-Town Day: John L. Nau, III
 
Catherine Mosbacher with the Center for Houston's Future
Catherine Mosbacher with the Center for Houston's FutureCatherine Mosbacher with the Center for Houston's Future
Catherine Mosbacher with the Center for Houston's Future
 
Trudi Smith and the Buffalo Bayou Partnership
Trudi Smith and the Buffalo Bayou PartnershipTrudi Smith and the Buffalo Bayou Partnership
Trudi Smith and the Buffalo Bayou Partnership
 
Kirk Coburn & Surge on Energy & Technology Growth in Houston
Kirk Coburn & Surge on Energy & Technology Growth in HoustonKirk Coburn & Surge on Energy & Technology Growth in Houston
Kirk Coburn & Surge on Energy & Technology Growth in Houston
 
John Nau and the new Center for Texas Cultural Heritage
John Nau and the new Center for Texas Cultural Heritage John Nau and the new Center for Texas Cultural Heritage
John Nau and the new Center for Texas Cultural Heritage
 
Bob Hale from HAR on the Ever-Evolving Real Estate Industry
Bob Hale from HAR on the Ever-Evolving Real Estate IndustryBob Hale from HAR on the Ever-Evolving Real Estate Industry
Bob Hale from HAR on the Ever-Evolving Real Estate Industry
 

2010 HAR REALTOR® Expo- Ted Jones, PhD

  • 1. New Business Model For the 2011 Economy Adapt, Mutate, Migrate or Die An Economic and Real Estate Forecast Ted C. Jones, PhD Chief Economist Stewart Title Guaranty Co.
  • 2. The New Business Model i.e. Things are different today…..
  • 3. The New Business Model 1. Cost Control is Essential 2. Consumers Have Changed Expectations 3. Less is More
  • 4. US Employment September Year Millions 2000 132.1 2010 130.2 1.9 Million Fewer Jobs 10 Years at 100,000 Per Month = 12 Million Needed Jobs
  • 5. US Civilian Employment Millions of Jobs 137.0 135.0 133.0 131.0 129.0 '07 '08 '09 '10 613 Thousand Jobs Gained in 2010 7.75 Million Jobs Lost Since January 1, 2008 September 2010 95,000 Jobs Lost
  • 6. Houston-Baytown-Sugar Land Jobs Percent Change from Same Month Prior Year Not Seasonally Adjusted 3.0% 0.0% 7 6 '01 '02 '03 '04 '05 '06 '07 '08 '09 '10 -3.0% -6.0% US Houston-Baytown-Sugar Land 900 Net Lost Jobs in the Past 12 Months
  • 7. Recession Recovery The recovery in every recession since 1949 has been led by a recovery in the housing market
  • 8. Axiom #1 There is No Such Thing as a National Real Estate Market or Economy Nor is there even a generalized Orlando Market
  • 9. US Existing Home Sales Sold (Millions) 8.0 7.0 6.0 August 2010 5.0 4.0 3.0 '02 '03 '04 '05 '06 '07 '08 '09 '10 National Association of REALTORS®
  • 10. Houston MSA Existing Home Sales Number Per Month 9,000 8,000 7,000 August 2010 6,000 5,000 4,000 3,000 2,000 1,000 0 2 3 4 5 6 7 8 9 0 '0 '0 '0 '0 '0 '0 '0 '0 '1
  • 11. Houston Existing Home Sales Average Number Per Month For Prior 12 Months 7,000 6,000 5,000 4,000 3,000 2,000 1,000 0 2 3 4 5 6 7 8 9 0 '0 '0 '0 '0 '0 '0 '0 '0 '1
  • 12. Houston Existing Home Prices Median Price $175,000 $150,000 $125,000 $100,000 $75,000 $50,000 $25,000 $0 2 3 4 5 6 7 8 9 0 '0 '0 '0 '0 '0 '0 '0 '0 '1
  • 13. Houston Residential Building Permits Number of Dwelling Units 70,000 60,000 50,000 40,000 30,000 20,000 10,000 0 80 82 84 86 88 90 92 94 96 98 ' 00 ' 0 2 ' 04 ' 0 6 ' 08 ' 1 0f Single Family Multi
  • 14. Federal Budget Surplus (Deficit) $ Billions $0.0 '01 '02 '03 '04 '05 '06 '07 '08 '09 -$200.0 '10f '11f -$400.0 -$600.0 -$800.0 -$1,000.0 -$1,200.0 -$1,400.0 -$1,600.0
  • 15. Interest Expense on Debt Outstanding $ Billions 2009 $383 Billion $500 $400 $300 $200 $100 $0 88 89 90 91 92 93 94 95 96 97 98 99 '00 '01 '02 '03 '04 '05 '06 '07 '08 09p '
  • 16. 2010 Budget Department $ Billions Agriculture 25.7 Education 46.7 Energy 26.4 Homeland Security 42.7 Housing and Urban Development 43.7 Interior 12.0 NASA 18.7 Labor 13.3 State 53.9 Transportation 73.3 Treasury 13.4 Environmental Protection Agency 10.5 Total 380.2
  • 17. $533 Billion Spent Remove Temporary Census Jobs 723,000 Jobs YTD -33,000 = $772,500 $737,200 Per Job Per Job
  • 18. Oil Prices & 10-Year Treasury Note Rates August 2010 Dollars 10-Year Oil Prices Treasury Rates % $140 $120 17 $100 14 $80 11 $60 8 $40 5 $20 $0 2 72 75 78 81 84 87 90 93 96 99 '02 '05 '08
  • 19. Oil Prices & Exchange Rates $US Per Euro Oil in August 2010 Dollars Dollars Per Oil Prices Oil Price Euro $140 $1.65 $120 $100 $1.45 $80 $1.25 $60 $1.05 $40 $20 $0.85 '02 '03 '04 '05 '06 '07 '08 '09 '10
  • 20. Why Interest Rates Are Going To Increase Japanese Buyer of 2-Year Treasury Note in September 2008 Dollar-Yen Exchange Date Event U.S. Dollars Rate Yen 9-2008 Purchase the Bond $ (100,000.00) 106.6 $ (10,660,000) 3-2009 Interest Payment $ 480.00 97.9 $ 46,992 9-2009 Interest Payment $ 480.00 91.3 $ 43,824 3-2010 Interest Payment $ 480.00 90.7 $ 43,536 9-2010 Interest Payment $ 480.00 83.3 $ 39,984 9-2010 Bond Redempetion $ 100,000.00 83.3 $ 8,330,000 Total (With No Time Value of Money) $ (2,155,664) Return (No Time Value of Money) -20.2%
  • 21. Rates Up 100 Basis Points Ted’s Forecast ‘10 Big 2011 9-1-2010 to 12-31-10 Upside…
  • 22. Commercial Sales Percent $ Billion Change 2007 $ 557.8 2008 $ 181.6 -67.4% 2009 $ 54.4 -70.0% $58 Billion Q1+Q2+Q3 2010 Forecast 2010 = $77.3 2010 +42%
  • 23.
  • 24. Mortgage Bankers Association Office Building Washington, DC Purchased 2007 $79.0 Million Sold Feb 2010 $41.3 Million Loss $37.7 Million 47.7 Percent
  • 25. MIT Real Estate Group NCREIF
  • 26. Estimated Current Property Value Compared to Q2 2010 Property Type Acquisiton Date Apartments Industrial Office Retail 2000 Q1 41.3% 16.9% 26.7% 40.2% Q2 35.8% 13.9% 23.5% 43.6% Q3 30.5% 10.5% 20.7% 43.9% Q4 29.3% 10.9% 20.1% 50.2% 2001 Q1 30.8% 6.9% 21.1% 53.4% Q2 21.5% 4.1% 24.0% 46.1% Q3 22.2% 5.3% 28.7% 43.1% Q4 22.4% 7.7% 32.6% 44.4% 2002 Q1 21.3% 13.1% 26.8% 40.7% Q2 25.0% 10.6% 31.3% 37.5% Q3 24.5% 9.1% 22.9% 32.0% Q4 20.5% 4.3% 25.1% 24.2% 2003 Q1 21.6% 8.2% 23.7% 25.4% Q2 22.3% 3.8% 25.5% 17.7% Q3 18.7% -2.0% 21.7% 28.5% Q4 18.0% -2.9% 21.3% 20.2% 2004 Q1 19.3% -4.2% 21.1% 15.5% Q2 14.7% -10.0% 16.5% 10.0% Q3 8.5% -9.3% 15.4% 3.8% Q4 6.2% -9.7% 11.1% -0.3% 2005 Q1 -2.2% -6.7% 8.0% 1.2% Q2 -2.4% -25.1% -1.4% -17.8% Q3 -17.1% -26.0% -7.7% -20.6% Q4 -20.9% -25.7% -15.9% -20.6%
  • 27. Estimated Current Property Value Compared to Q2 2010 Estimated Percent Change in Value Since Acquisition Property Type Acquisiton Date Apartments Industrial Office Retail 2006 Q1 -23.8% -32.8% -19.4% -21.8% Q2 -21.8% -34.1% -19.5% -24.0% Q3 -21.1% -32.6% -24.5% -25.6% Q4 -21.4% -38.3% -28.6% -27.3% 2007 Q1 -19.6% -39.6% -30.9% -28.3% Q2 -24.0% -43.6% -35.2% -28.1% Q3 -27.7% -41.8% -35.7% -27.1% Q4 -27.2% -37.8% -35.3% -25.8% 2008 Q1 -26.8% -38.0% -33.7% -21.9% Q2 -25.5% -33.1% -28.0% -21.0% Q3 -24.5% -31.7% -26.6% -21.3% Q4 -13.0% -24.9% -20.8% -18.3% 2009 Q1 -8.3% -5.4% -17.3% -14.8% Q2 -1.4% -5.4% -6.2% -5.6% Q3 -1.1% -4.1% -0.6% -1.2% Q4 8.0% -2.1% 9.2% 4.3% 2010 Q1 5.4% 5.5% 5.0% 5.2% Q2 0.0% 0.0% 0.0% 0.0%
  • 28.
  • 29. Commercial Lending Four Quarter Moving Average Q1 2001 = 100 350 300 250 200 150 100 50 0 3 4 5 6 7 8 9 0 '0 '0 '0 '0 '0 '0 '0 '1
  • 30. Apartment Price Index 100.00% 90.00% 80.00% 70.00% 60.00% 50.00% '00 '01 '02 '03 '04 '05 '06 '07 '08 '09 '10
  • 31. Texas Multifamily Prices Down 10 to 15 Percent Since 2007 Peak Texas Industrial Cap Rates Up 100 Basis Points From 6.5 Percent Value Down 13+ Percent
  • 32.
  • 33.
  • 34. Multifamily Assessed Value 2007 Percent Texas Years Change Apartment 2007-2008 -1.4% Resales 2007-2008 22.6% 2007-2008 59.4% 2007-2009 -3.2% 2007-2009 8.7% 2007-2009 20.6%
  • 35. 2011 Economic Concerns • Wall Street—Washington DC—Liquidity • Jobs – Stimulus Not Working GDP=C+I+G • Time Bomb Loans Now Commercial • Cold War II—Terrorists • Inflation (and Cap Rates)--Recession • Tax Cut Clock Ticking……………. • Energy: US Imports 70+ Percent of Oil • Real Estate-Autos-Credit Cards-Banks
  • 37. Ted C. Jones, PhD Chief Economist Stewart Title Guaranty Co. http://blog.stewart.com/