Sources of Technical Inefficiency of Smallholder Farmers in Sorghum Production in Konso District, Southern Ethiopia

This study aims to estimate the technical efficiency and identify sources of technical inefficiency in sorghum production by smallholder farmers in Konso district, southern Ethiopia using data collected from a sample of 124 households. Individual levels of technical efficiency scores were estimated using the Cobb-Douglas functional form, which was specified to estimate the stochastic production frontier. The estimated stochastic production frontier model indicated that input variables such as land, Urea, DAP, labour, oxen and chemicals found to be important factors in increasing the level of sorghum output in the study area. The mean technical efficiency of the sample households was about 69%, which shows existence of a possibility to increase the level of sorghum output by about 31% by efficient use of the existing resources. The estimated stochastic production frontier model together with the inefficiency parameters showed that, age, education, family size, off-farm occupation, extension service, livestock holding, plots distance and soil fertility were found to be significant in determining the level of technical inefficiency of sorghum production in the study area. Negative coefficients of education, family size, off-farm occupation, extension service and soil fertility indicates that improvement in these factors results in a significant decrease in the level of technical inefficiency. Akin, positive coefficients of age, livestock holding and plots distance were found to increase households’ technical inefficiency. Hence, emphasis should be given to improve the efficiency level of those less efficient households by adopting the practices of relatively efficient households in the study area. Beside this, policies and strategies of the government should be directed towards the above mentioned determinants.

Recommended
Recommended
More Related Content
What's hot
What's hot (20)
Similar to Sources of Technical Inefficiency of Smallholder Farmers in Sorghum Production in Konso District, Southern Ethiopia
Similar to Sources of Technical Inefficiency of Smallholder Farmers in Sorghum Production in Konso District, Southern Ethiopia (20)
More from Premier Publishers
More from Premier Publishers (20)
Recently uploaded
Recently uploaded (20)
Sources of Technical Inefficiency of Smallholder Farmers in Sorghum Production in Konso District, Southern Ethiopia
- 1. Sources of Technical Inefficiency of Smallholder Farmers in Sorghum Production in Konso District, Southern Ethiopia Sources of Technical Inefficiency of Smallholder Farmers in Sorghum Production in Konso District, Southern Ethiopia 1Kusse Haile Gemeyida*, 2Jema Haji, 3Bosena Tegegne 1 Lecturer, Department of Agricultural Economics, Mizan-Tepi University, P.O. Box 260, Mizan Aman, Ethiopia 2 Professor, School of Agricultural Economics and Agribusiness, Haramaya University, P.O. Box 138 Dredawa, Ethiopia 3 Assistant Professor, School of Agricultural Economics and Agribusiness, Haramaya University, P.O. box 138 Dredawa, Ethiopia This study aims to estimate the technical efficiency and identify sources of technical inefficiency in sorghum production by smallholder farmers in Konso district, southern Ethiopia using data collected from a sample of 124 households. Individual levels of technical efficiency scores were estimated using the Cobb-Douglas functional form, which was specified to estimate the stochastic production frontier. The estimated stochastic production frontier model indicated that input variables such as land, Urea, DAP, labour, oxen and chemicals found to be important factors in increasing the level of sorghum output in the study area. The mean technical efficiency of the sample households was about 69%, which shows existence of a possibility to increase the level of sorghum output by about 31% by efficient use of the existing resources. The estimated stochastic production frontier model together with the inefficiency parameters showed that, age, education, family size, off-farm occupation, extension service, livestock holding, plots distance and soil fertility were found to be significant in determining the level of technical inefficiency of sorghum production in the study area. Negative coefficients of education, family size, off-farm occupation, extension service and soil fertility indicates that improvement in these factors results in a significant decrease in the level of technical inefficiency. Akin, positive coefficients of age, livestock holding and plots distance were found to increase households’ technical inefficiency. Hence, emphasis should be given to improve the efficiency level of those less efficient households by adopting the practices of relatively efficient households in the study area. Beside this, policies and strategies of the government should be directed towards the above mentioned determinants. Keywords: Technical efficiency, Stochastic frontier production, Smallholders, Konso, Sorghum Production. INTRODUCTION Background of the Study Ethiopia, the country with an area of about 1,120,000 square kilometres, is one of the most populous countries in Africa with the population of 84.32 million in 2012 with annual growth rate of 2.6% (CSA, 2013). In 2015 this population size has reached 90.08 million as projected by the Central Statistical Agency (CSA, 2015) based on the 2013 Inter-Censal Population Survey (ICPS). This growing population requires better economic performance than ever before at least to ensure food security. However, the agricultural sector in the country is largely small-scale, subsistence oriented and heavily dependent on rainfall, which is highly variable spatially and temporally. It is a dominant sector in Ethiopia and is accounting for about 45% of GDP and 80% for export commodity. About 85% of Ethiopians livelihood depends on agriculture (MoFEC, 2012). *Corresponding Author: Kusse Haile Gemeyida, Lecturer, Department of Agricultural Economics, Mizan- Tepi University, P.O. Box 260, Mizan Aman, Ethiopia. Email: kussehaile@mtu.edu.et, TEL: +251916698097 Research Article Vol. 5(1), pp. 180-196, January, 2019. © www.premierpublishers.org. ISSN: 2167-0432 International Journal of Agricultural Education and Extension
- 2. Sources of Technical Inefficiency of Smallholder Farmers in Sorghum Production in Konso District, Southern Ethiopia Gemeyida et al. 181 According to WFP (2010), Ethiopia agriculture is explained by low productivity, caused by a combination of agro climatic, demographic, economic and institutional constraints and shocks. The same report indicate that, about 5.23 million people in need of relief food assistance and the national relief pipeline has a shortfall of 290,000 tonnes of food grain. By any measure, Ethiopia’s achievements over the past decade have been impressive: average annual economic growth rates of over 10% over the past decade. Also, improvements in reduction in the poverty headcount from 38.7 to 26% between 2004/05 and 2012/13. Despite these positive outcomes, Ethiopia still faces many daunting human development issues. About 25 million Ethiopians remain in poverty, and these and many Ethiopians just above the poverty line are vulnerable to shocks and food insecurity. This is because of high population growth, the absolute number of the poor has remained largely unchanged over the past fifteen years (UNDP, 2015). Currently, the Ethiopian government has designed a second five years (2015/16-2019/20) growth and transformation plan (GTP II) which aims at boosting the national Gross Domestic Product (GDP). Based on the achievements and lessons drawn from implementations of Agricultural Development Led Industrialization (ADLI) strategy, building on Plan for Accelerated and Sustainable Development to End Poverty (PASDEP) achievements and the country’s five-year (2010-2015) first Growth Transformation Plan (GTP I), smallholder agricultural will continue to be the basis for agriculture sector development. Also, increasing agricultural production and productivity focusing on smallholder agriculture, is continued to be a priority during the Second Growth and Transformation Plan (GTP II) as source of growth and poverty reduction through ensuring household and national food security (MoFEC, 2015). The overall performance of Ethiopia’s economy is highly influenced by the performance of the agricultural sector which itself is subjected to vagaries of weather and related natural and man-made factors. Rising population pressure coupled with declining land holding sizes and natural resource degradations were leading to low level of production to meet the consumption requirement of the households in rain dependent agricultural subsystem. In Ethiopia, cereals are the major food crops both in terms of area coverage and volume of production. According to CSA (2014/15) report, of the total area and production under crops, cereals accounted for about 80.78% and about 87.31% of the total production in quintals, respectively. The same source also indicated that, there was an increase in total food grain production from 251,536,62.39 metric tons in 2013/14 to 270,396.04.80 metric ton in 2014/2015. However, this increment in output could not be attributed to improvement in productivity alone as there was simultaneous increase in the size of cultivated land from 12,407,473.46 hectares to 12,558,444.55 hectares in the same period. Smallholders account for 96% of the total area cultivated and generate the key share of total production for the main crops. Cereals are predominantly produced by smallholders and are consumed as food, and the by- products are fed to livestock (Abu, 2013). In Ethiopia, sorghum accounts for the third largest share of total cereal production. Area under sorghum cultivation expanded from 1.83 million hectare in 2014/15 to 2.01 million in 2015/16 (CSA, 2016). Sorghum is the single most important staple in drought prone areas; The trade status of the country from 2005 – 2010 shows that, import in all years and most of the sorghum import takes the form of food aid (Demeke and Di Marcantonio, 2013). In southern region, from the total land size of 1,110,931.29 hectares planted to all grain crops, cereals covered 883,290.78 hectares with a total production of 20,455,69.44 metric tons. The production of sorghum is 247,740.29 metric ton and total area coverage under sorghum is 116,887.44 hectare and average yield per hectare is 21.19 quintals (CSA, 2014/15). From the total land size of 63,733.25 hectares planted with all grain crops in Segen people’s zone, cereals covered 51,426.38 hectares with a total production of 888,919.24 quintals. And the production of sorghum is 169,497.24 quintals which is the third in terms of production preceded by maize and teff and total area coverage under sorghum is 11,638.85 hectare and average yield per hectare is 14.56 quintals (CSA, 2014/15). Among the districts of Segen Area People’s zone, Konso district is known for cereal production especially sorghum followed by maize and teff. Out of the total 27,600.23 hectares of land allocated for cereals, sorghum occupies 12,604.67 hectares or 45.67% of the total land allocated for cereal crops in the district. In 2014/15 production year, the total production and productivity of sorghum was 165,373.27 quintal and 13.12 quintal per hectare, respectively, which is less than the regional productivity of 21.19 quintal per hectare (KDARDO, 2015). In this area depending on the rainfall, several hectares are grown annually. However, productivity is as such not much. Therefore, knowledge about the level of technical inefficiency of smallholder sorghum producers in the production and the underlying socio-economic and institutional factors causing inefficiency may help to assess the opportunities for increasing agricultural production. This study thus aims to contribute towards a better understanding of potential production capacity of this crop using extended efficiencies measurement procedures. Statement of the Problem The major challenges facing most of developing countries such as Ethiopia is improving food security and to stimulate underlying food system development. There is an ever-increasing concern that it is becoming more and
- 3. Sources of Technical Inefficiency of Smallholder Farmers in Sorghum Production in Konso District, Southern Ethiopia Int. J. Agric. Educ. Ext. 182 more difficult to achieve and sustain the needed increase in agricultural production based on extensification, because there are limited opportunities for area expansion. Hence, the solution to food problem would depend on measures, which help to increase yield through intensification. Though agriculture remains to be the most important sector of the Ethiopian economy, its performance has been disappointing and food production has been lagging behind population growth (Demeke, 2008), which is unable to fulfill the requirement of the ever-increasing number of mouths. This is mainly attributed to the poor use of modern inputs such as fertilizers, improved seeds and extension services which partly explain the less productivity of the sector and apart from this, the internal inefficiency of the farmers in using the available agricultural resources such as land and labor (Kinde, 2005). Agricultural production and productivity can be enhanced through increased use of input or improvement in technology given some level of input. Therefore, if farmers are producing to supply the surplus to the market after feeding themselves with reducing land per capita due to population growth, they need to adopt new farming practices and increase their efficiency (Jema, 2008). The other way of improving productivity is to enhance the efficiency of producers. In countries like Ethiopia (having capital constraint) it is worthwhile to benefit from increasing productivity through improving efficiency in use of resources available. Cereal crops are grown primarily for the harvesting of mature grains which are used or processed into staple food and animal feed. They are also processed into various products such as starch, malt, biofuel (alcohol) and sweetener (FAO, 2014). In Ethiopia, sorghum is a staple food crop widely cultivated in different agro-ecological zones, predominantly in dry areas where other crops can survive least and food insecurity is widespread. In 2011/12, Ethiopian main rainy season (Meher), 39,512,942.36 quintals of sorghum grain is produced on 1,923,717.49 ha of land (CSA, 2012). This shows that the productivity of the crop is still low, estimated to be 2054 kg ha-1 (CSA, 2012), which is considerably lower than experimental yield that reaches up to 3500 kg ha-1 on farmers’ fields in major sorghum growing regions of the country (Geremew et al., 2004). Therefore, possible ways should be sought to alleviate food shortage and food insecurity. One way of mitigating the problem is increasing the use of improved technologies and improving the efficiency of farmers in using inputs. Alemayehu et al. (2011), however, argued that in the future cereal production growth need to come increasingly from yield improvements as there is little suitable land available for the expansion of crop cultivation in the country, especially in the highlands. Despite double-digit economic growth and substantial decreases in the percentage of the population below the national poverty line, the absolute number of the poor is roughly the same as 15 years ago and a significant proportion of the population hovers just above the poverty line and is vulnerable to shocks. Moreover, the severity of poverty increased from 2.7% in 1999/2000 to 3.1% in 2010/11 (MoFEC, 2013). Also agriculture remains the key sector of the economy, on which the great majority of the population still depends for its livelihood. GTP II targets focuses on enhancing the productivity and production of smallholder farmers who are providing the major share of the agricultural output in the country, commonly employ traditional production technology and limited modern inputs and reducing the number of chronically food insecure households (ATA, 2015). The highlands of Konso are densely populated and population is growing rapidly. The pressure on land is increasing, resulting in marginal lands to be taken into production and problems resulting from overstressing the farming system. Lately, declining soil fertility and growing population increase the pressure on limited land resources and people are unable to hold large stocks of food (Awraris, 2012). Even though, cereals especially, sorghum are the most predominate in the cropping pattern in Konso district in which this study was carried out, how much farmers are efficient in the study area was not known. Albeit there is lack of pertinent studies on technical efficiency of the smallholder farmers in sorghum production and the determinants of the variability of the inefficiency levels among farmers in the study area. Hence, this study tries to analyze the technical efficiency and its determinants of sorghum production in Konso district, which is known for the production of sorghum crop and aims to bridge the prevailing information gap by providing empirical evidence on smallholder resource use efficiency. RESEARCH METHODOLOGY Description of the Study Area The study area is located in the Southern Nations, Nationalities, and Peoples Region of Ethiopia. Konso District is one of the currently organized five Districts under Segen zone in the SNNPR. The district is located about 600 km south of Addis Ababa at 5o10’ – 5o 40’ N latitude and 37o 00’ – 37o 40’E longitude. The total land area of the District is 2,274 sq.km. (KDAO, 2012). Topographically: the altitude of Konso district varies from 500 m.a.s.l to 2000 m.a.s.l. Based on information obtained from the Konso District agricultural office, the main agro- ecological divisions of Konso accounts, about 70% arid and 30% tropical sub-humid. The mean annual temperature of the District ranges between 17.6-27.50ºC. Moreover, the climate of Konso is characterized as semi- arid with irregular and seasonally varied rainfall. The
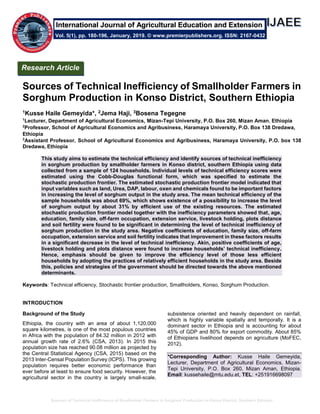
- 4. Sources of Technical Inefficiency of Smallholder Farmers in Sorghum Production in Konso District, Southern Ethiopia Gemeyida et al. 183 Source: Own Draw, 2015 Figure 1: Location of Konso district average total annual rainfall is 550 mm; the temperature of the area is mostly hot and warm. The annual rainfall variation is between 400 and 1000 mm. The rain follows a bimodal pattern of rain that is”Belg” high rainfall in the period starting from mid-February and lasts until April and the short rain season which is ”Meher” from October and November (Cheung, 2008), as cited in (Awraris, 2012). Based on CSA (2015), the District has a population of 276,985 of whom 133,715 (48.28%) are men and 143,270 (51.72%) are women. Konso district has a population density of 103.3 per Sq.km. The arable land holding size per household is estimated to be less than one hectare. Farming sustains the livelihoods of more than 90% of the Konso farmers that depends on rain fed agriculture (Awraris, 2012). There are two cropping seasons in Konso: Belg (February-May) accounting for 65-75% of the annual crop production and Meher (Hagaya) cropping season. The most common crops are cereals mainly sorghum followed by maize (Besha, 2003). Sorghum is one of the major staple crops grown in the poorest and most food insecure regions of Ethiopia like Konso district. The crop is typically produced under adverse conditions such as low input use and marginal lands. It is well adapted to a wide range of precipitation and temperature levels and is produced from sea level to above 2000 m.a.s.l. Its drought tolerance and adaptation attributes have made it the favorite crop in drier and marginal areas. Ethiopia is often regarded as the center of domestication of sorghum because of the greatest genetic diversity in the country including Konso district (Fetene, 2011 as cited in Demeke and Di Marcantonio, 2013). The climate of the Konso district is most favorable for the cultivation of a wide variety of crops like sorghum, maize, teff, wheat, barley, bean, pea, oil seeds (sesame), vegetable and fruit. The district has fertile soil although under pressure due to human activities – often-unplanned activities. However, productivity in the peasant sector is of subsistence nature. Due to the increment of population 1 man shares 0.53 ha in Konso where one can easily understand how dense the population settlement of Konso is, in relation to land size (Tamiru, 2014). Types of Data, Sources and Data Collection Methods This study used relevant data collected from both primary and secondary data sources. Primary data were collected from sample households using questionnaires, focus group discussions and key informants interview. Secondary data were collected from both published and unpublished sources which include data on agricultural
- 5. Sources of Technical Inefficiency of Smallholder Farmers in Sorghum Production in Konso District, Southern Ethiopia Int. J. Agric. Educ. Ext. 184 production, farming systems and other baseline information. The information was collected from regional, zonal and district-level offices of agriculture and rural development, and concerned government and non- governmental institutions. Sampling Technique A combination of both purposive and random sampling techniques were employed to draw an appropriate sample. Konso district was purposively selected for the study because of the presence of large number of sorghum producing households and its extent of production in the area. Konso district actually comprises of 41 rural kebeles. Since the research focus basically on sorghum production, sorghum producer kebeles were the major target areas for sample selection. In the first stage, five kebeles were selected randomly. In the second stage, based on the list of households of the kebeles who produce sorghum during 2014/15 production year, 124 sample farm households were selected from the total households of five kebeles by using simple random sampling (SRS) technique based on probability proportional to size (PPS). There are several approaches to determine the sample size, out of them the one by Yamane (1967) was used. The sample size for the study was determined based on the following formula. 124 )09.0(2769851 276985 )(1 22 eN N n Households (7) Where: n is the sample size needed, N is the total population and e is the desired level of precision. Finally, a total of 124 sample households was selected for interview as presented in Table 1 below. Table 1: Kebele, number of households, and sample size selected from sample Kebeles Kebele Sorghum producing households Sample size Percent Debana 1812 41 33 Mechekie 757 17 14 Borqara 1560 35 28 Gamolie 512 11 9 Arfaidie 898 20 16 Total 5539 124 100 Source: Own sampling design, 2015 Methods of Data Analysis Descriptive statistics In this study, descriptive tools like mean, standard deviation, frequency, percentage and inferential statistical tests like chi-square test for potential discrete (dummy) explanatory variables and t-test was used to test the significance of the mean difference of continuous variables for the sample households. Econometric models Specification of the functional form The study used the stochastic frontier functional approach, which requires the priori specification of the production function to estimate the level of technical efficiency. Among the possible algebraic forms, Cobb-Douglas and the translog functions have been the most popularly used models in most empirical studies of agricultural production analysis. As a result, taking the appropriate functional form that better fit the data was selected. Estimation of the empirical model The model parameters in stochastic production frontier were analyzed by employing a single stage estimation procedure. In using the two-stage estimation procedure of efficiency level and factors determining, the efficiency index is estimated by the stochastic production function in the first stage and then regressed against a number of other farm specific and socioeconomic variables in the second stage. The one-stage estimation procedure of the inefficiency effects model together with the production frontier function would be used in the study. The two-stage procedure produces inconsistency in the assumption (Coelli et al., 1998). Moreover one-stage procedure is the most commonly used method in the analysis of technical efficiency. Thus one-stage procedure is selected for this study. Using Ordinary Least Squares (OLS) estimation procedure, it is possible to get consistent estimators for all the parameters in the model except the intercept term. But if we use the OLS method to estimate the intercept term it will be biased. This problem occurs due to the fact that the mean of (v - u) is not zero by assumption. However, a consistent estimator of the intercept can be formed by using Corrected Ordinary Least Squares (COLS), which involves adjusting the OLS intercept by the mean of u. In addition to the COLS method, one can also adopt the more efficient maximum likelihood (ML) approach (Sharif and Dar, 1996), which requires numerical maximization of the likelihood function. The ML estimation is asymptotically more efficient than the COLS estimator and empirical investigations suggested that the ML estimation is significantly better than the COLS estimator, when the contribution of the technical inefficiency effects to the total variance term is large (Coelli et al., 1998). In this study, ML estimation procedure is used to estimate the stochastic production function model described in equation (8). To use ML estimation procedure, the assumptions made about the distributions of the error components u and v should be respected (Coelli, 1998). It is assumed that uis are independently and identically distributed half-normal random variables with mean zero
- 6. Sources of Technical Inefficiency of Smallholder Farmers in Sorghum Production in Konso District, Southern Ethiopia Gemeyida et al. 185 and variance u2. While vis are assumed to be independent and identically distributed normal random variables with mean zero and constant variance 2v. (v (0, 2 v)), independent of the uis. In most empirical applications the half normal distribution for the technical inefficiency effects (ui) has been more frequently assumed. Given a symmetric normal distribution for vi and half normal distribution for ui and by defining a parameter , which lies between zero and one and is equal to u 2 / s 2 , (where s 2 = u 2 + v 2 ), Battese and Corra (1977) showed that the log-likelihood function in terms of this parameterisation is equal to: N i is N i s is i N YLnL 1 22 1 2 2 1 ln) 2 ln( 2 )( (8) Where, iiiii XyUV ' ln and v u 2 2 (.)= Is the distribution function of the standard normal random variable. iYLln = logged output level for the ith farm X’i = logarithm of the level of input for the ith farm β = Regression coefficient = Discrepancy parameter as defined above 2 s = variance of standard error of the composed error term and N = number of observations The ML estimates of β, s 2, and is obtained by finding the maximum of the loglikelihood function defined by equation (8). The ML estimators are consistent and asymptotically efficient (Coelli et al., 2005). Once the estimates of the model parameters are found, the results can be used to estimate the technical efficiency levels of each individual farm in the sample observation as well as the mean level of the technical efficiency of the total sample households. The ratio of the observed output for the ith farm, relative to the potential output, defined by the frontier function; given the input vector Xi is used to define the technical efficiency of the i th firm. )exp( )exp( )exp( )exp( ' ' ' i ii iii ii i i U VX UVX VX Y TE (9) Where, Yi = exp(X’i β+Vi-Ui) is the stochastic frontier model for ith household, Yi = denotes output of sorghum produced by the ith household, X’i = is (1×k) row vector with the first element equal to 1, of input quantity used by the ith household for the production of sorghum, β = (β0, β1, β2, β3, β4, … βk) is (1×k) column vector of unknown parameters to be estimated, Ui = is a non-negative random variable associated with technical inefficiency of the ith household for the sorghum production, Vi = is random error term of the model which capture random shock of the production of sorghum in the ith household and i = 1, 2, 3, …, n is number of samples in a population. For the frontier model defined by equation (8), the null hypothesis, that there are no technical inefficiency effects in the model is conducted by testing the null and alternative hypothesis H0: γ = 0 versus H1: γ > 0. The hypothesis involving γ are considered due to the fact that, the Battese and Corra (1977) parameterisation was adopted for this study and the test must be performed as a one sided test because γ cannot take negative values. As a result the One-sided Generalized Likelihood ratio Test suggested by Coelli (1995) should be performed when maximum likelihood estimation is involved. This test statistic requires the estimation of the model under both the null and alternative hypotheses. Under the null hypothesis H0: γ = 0, the model is equivalent to the traditional average response function, without the technical inefficiency effect, Ui. The test statistic is calculated as: )([{2 0HLLnLR / )]}( 1HL )]}()([{2 10 HLHLLn (10) Where: L(H0) = the log likelihood value of the null hypothesis; L(H1) = the log likelihood value of the alternative hypothesis; Ln is the natural logarithms In this case if H0: γ = 0 is true the LR has asymptotic distribution which is a mixture of Chi- square distributions Coelli (1995). Then the critical value for the one-sided Generalized Likelihood ratio Test of H0: γ = 0 versus H1: γ > 0 can simply be calculated. The critical value for a test of size α is equal to the value, 2 1 (2 α), where this is the value exceeded by the χ2 1 random variable with probability equal to 2 α. Thus the one-sided generalized likelihood ratio test of size α is: “reject H0: γ = 0 in favor of H1: γ > 0 if LR exceeds, χ2 1 (2 α). As far as factors determining technical efficiency are concerned, farmers have different characteristics that make them attain different levels of technical efficiency. Given a particular technology to transform physical inputs in to outputs, some farmers are able to achieve maximum output while others are not. These, factors need to be identified in order to define the problem of inefficiency thereby investigated for remedial measures to solve the problem. Most of the time in the area of efficiency analysis the following variables are commonly used. Given the
- 7. Sources of Technical Inefficiency of Smallholder Farmers in Sorghum Production in Konso District, Southern Ethiopia Int. J. Agric. Educ. Ext. 186 specified explanatory variables below, the functional relationship between input and output used in the stochastic production function can be specified as follows: iiCHEMSEEDHLABOXDDAPUREAAREAfOUTPLn );,,,,,,()( (11) Where: Ln(OUTP) = is the total output of sorghum obtained from the ith farm in quintal. AREA = the total size of land in hectare allocated for sorghum crop by the ith household. UREA = the total amount of urea fertilizer in kilogram applied by the ith household DAP = the total amount of DAP fertilizer in kilogram applied by the ith household. OXD = the total number of oxen days used by the ith household. HLAB = the total labor force (family and hired) which are all measured in terms of man-day. SEED = the total quantity of sorghum seed used by the ith household measured in kg. CHEM = Chemicals such as herbicides or pesticides used as an input particularly in sorghum due to serious weed, pest and disease attack by the ith household. f ( ) = Appropriate functional form (e.g. Cobb-Douglas or Translog functional form) βi = vector of unknown parameters to be estimated, and i = composed error term , Where: i = Vi -Ui Ui = non-negative random variable, independently and identically distributed as N(ui, u 2 ) which is intended to capture the technical inefficiency effects in the production of sorghum measured as the ratio of observed output to maximum feasible output of the ith farm and Vi = a disturbance term independently and identically distributed as N (0, v 2 ) which is intended to capture events or factors outside the control of the farmers. The technical inefficiency effects model by Battese and Coelli (1995) in which both the stochastic frontier and factors affecting inefficiency (inefficiency effect model) are estimated simultaneously is specified in Equation (12) as a joint estimation of a stochastic frontier production function: } (lnln lnlnlnlnln{ 13121110 98765 4321076 543210 i i WSEXSLOPFERTILITYDISTRES LIVSTOCKACSCDTEXTSERVACCTRAINFRAGMENTOFFOC FAMSIZEEDUCLVLAGEHHVCHEMSEED HLABOXDDAPUREAAREAfLnOUTP (12) Where: δi = Parameter vector associated with inefficiency effect to be estimated; wi = Error term. RESULTS AND DISCUSSION Descriptive statistics of the input variables and output The production function for this study was estimated using seven input variables. To draw some picture about the distribution and level of inputs, the mean and range of input variables is presented in Table 13 below. The average sorghum yield produced by sample households was 12.82 quintal per ha, with a standard deviation of 7.94, maximum of 36 and minimum of 3 quintal per ha which is dependent variable in the production function (Table 13). In the study area, sorghum is produced two times per annum. The land allocated for sorghum production, by sample households during the survey period, ranges from 0.125 to 1.75 ha with average land size and standard deviation of 0.68 ha and 0.38 respectively. In the study area, farmers use both Urea and DAP fertilizers for sorghum production. The average amount of Urea and DAP fertilizers applied in the production of sorghum by sample households were 42.43 Kg per hectare and 49.94 Kg per hectare, respectively during 2014/15 sorghum production season. There was high variation of fertilizer utilization (both urea and DAP) in sorghum production by sample households. Like other inputs human labour and oxen power inputs were also decisive in the study area. Sample households, on average, use 36.83 man days per ha of labour for the production of sorghum during 2014/15 production season. In the production process labor input is used for major farming activities such as land preparation, sowing, chemical applications and fertilizer applications and weeding and other activities. For sorghum land preparation oxen power was used by the sample households. Field survey result showed that about 75% sample households use oxen power for ploughing their sorghum land, and this oxen power is computed to oxen days. The average oxen power used by sample households was 11.44 oxen days per ha with standard deviations of 5.20. The other very important variable, out of which production is impossible, is seed. The amount of seed sample households’ used was 19.98 Kg, on average with standard deviation of 8.15 (Table 13). There are different sorghum seed varieties used by households in the study area. Households used broadcasting method of sowing and on average the seed rate was 19.98 kg/ha which is greater than the recommended rate of 12 kg/ha for the study area. On average, sample households applied 0.32 liter of chemicals such as herbicides or pesticides per hectare in the study area for the protection of sorghum farms during production year. Table 2: Output and input variables used to estimate the production function Variable description Summary statistics Mean St. deviation Max Min Sorghum output (Qt/Ha) 12.82 7.94 36 3 Land (Ha) 0.680 0.38 1.75 0.125 Seed (kg/Ha) 19.98 8.15 34 4 Human labor (MDs/Ha) 36.83 10.26 61 14 Oxen power (ODs/Ha) 11.44 5.20 27 4 DAP (Kg/Ha) 49.94 42.11 100 45 Urea (Kg/Ha) 42.43 41.37 98 50 Chemicals (Lit/Ha) 0.32 0.45 1.75 0.15 Source: Own computation result, 2015
- 8. Sources of Technical Inefficiency of Smallholder Farmers in Sorghum Production in Konso District, Southern Ethiopia Gemeyida et al. 187 Econometric Model Outputs This section presents the econometric model outputs of the study. In this section, the production function, individual efficiency scores and sources of differences in technical inefficiency of sorghum production in the study area are presented and discussed. Test of hypothesis Before discussing the model output, let us begin with likelihood ratio (LR) tests to assess various assumptions related to the model specification. Tests of hypotheses for the parameters of the frontier model were conducted using the generalized likelihood ratio statistics. Accordingly four hypotheses were tested, to select the correct functional form for the given data set, for the existence of inefficiency, for variables that explain the difference in efficiency, and finally to identify type of distributions. Table 3: Generalized likelihood ratio tests of hypothesis for the parameters of the SPF Null hypothesis LH0 LH1 Calculated 2 (LR) value Critical 2 value Decision H0: = βij = 0 -25.92 -15.84 20.19 41.34 Accept H0: = 0 Reject H0 H0: = 1=….13 = 0 -61.52 -25.92 71.20 22.36 Reject H0 H0: = μ=0 -61.52 -61.49 0.06 2.71 Accept Source: Own computation result, 2015 The first test was the null hypothesis that identifies an appropriate functional form between restrictive Cobb Douglas and the non-restrictive Translog production function which specifies that square and cross terms are equivalent to zero. The Cobb-Douglas and the Translog functional forms are the most commonly used stochastic frontier functions in the analysis of technical efficiency in production. The Translog frontier function turns into Cobb- Douglas when all the square and interaction terms in the translog are zero. In order to choose between the two alternative functional forms that can better fit to the survey data collected, the null hypothesis that all the interaction and square terms are all equal to zero (H0 : βij = 0), i.e. Cobb-Douglas frontier functional specification, is tested against the alternative hypothesis that these coefficients are different from zero (H1 : βij ≠ 0). The test is made based on the value of likelihood ratio (LR) statistics, which can be computed from the log likelihood value obtained from estimation of Cobb-Douglas and Translog functional specifications using Equation (7). Then, this computed value is compared with the upper 5% critical value of the 2 at the degree of freedom equals to the difference between the numbers of explanatory variables used in the two functional forms (in this case df = 28). For the sample respondents, the estimated log likelihood values of the Cobb-Douglas and Translog production functions were -25.92 and -15.84, respectively. The computed value of likelihood ratio (LR = -2(15.84 – 25.92) = 20.19 is lower than the upper 5% critical value of the 2 with its respective degree of freedom (Table 15). Thus, the null hypothesis that all coefficients of the square and interaction terms in Translog specification are equal to zero was not rejected. This implies that the Cobb-Douglas functional form adequately represents the data. The second null hypothesis was H0: γ = 0, which specifies that the inefficiency effects in the SPF were not stochastic i.e. sorghum producing farms are efficient and have no room for efficiency improvement. After the appropriate production function is selected, the next step is a test for adequacy of representing the data using SPF over the traditional mean response function, OLS. The null hypothesis, H0: = 0, which specifies that the inefficiency effects are absent from the model (that is all sorghum producers are fully efficient). Whereas, the alternative hypothesis, H1: > 0, states that there is inefficiency in production of sorghum in the study area. Since this study is using the STATA version 12.1 computer programs, after fitting the function with the required defined variables the computer output displays results which include the test of null hypothesis about inefficiency component. From this computer program output it is found that, log likelihood value = 25.92, (chibar2 (01)-value = 7.11 and p = 0.004). Hereafter, the decision of null hypotheses H0: = 0, which specifies that the inefficiency effects are absent from the model is rejected at 1% level of significance for the sampled households. The coefficient for the discrepancy ratio ( ) could be interpreted in such a way that about 90 percent of the variability in sorghum output in the study area was attributable to technical inefficiency effect, while the remaining 10 percent variation in output was due to the effect of random noise. This implies presence of scope for improving output of sorghum by first identifying those institutional, socioeconomic and farm specific factors causing this variation. Therefore this data can be better represented by the stochastic production frontier than the average response function. The null hypothesis was rejected (Table 15). This implies the traditional average production function does not adequately represent the data. Therefore, the inclusion of the technical inefficiency term is an important issue to the model. The third null hypothesis that the explanatory variables associated with inefficiency effects are all zero (H0: 1=2…= 13 = 0) was also tested. To test this hypothesis likewise, LR (the inefficiency effect) was calculated using the value of the Log-Likelihood function under the stochastic production function model (a model without explanatory variables of inefficiency effects: H0) and the full frontier model (a model with explanatory variables that are supposed to determine inefficiency of each: H1). For
- 9. Sources of Technical Inefficiency of Smallholder Farmers in Sorghum Production in Konso District, Southern Ethiopia Int. J. Agric. Educ. Ext. 188 the sample households, the calculated value LR = - 2(25.92 - 61.52) = 71.20 is greater than the critical value of 22.36 at 13 degree of freedom (Table 15) the value of LR implying that, the null hypothesis (H0) that explanatory variables are simultaneously equal to zero was rejected at 5% significance level. Hence, these variables simultaneously explain the sources of efficiency differences among sample farmers in the study area. Thus the observed inefficiency among the sorghum farmers in Konso district could be attributed to the variables specified in the model and the variables exercised a significant role in explaining the observed inefficiency. Therefore, the result confirms as the null hypothesis was rejected, implying that there is at least one variable that explain the difference in efficiency. The fourth test conducted was, given such functional forms for the sample households; it was considered whether the technical efficiency levels were better estimated using a half normal or a truncated normal distribution of μi The results indicated that the half normal distribution was appropriate for the sample households in the study area as the calculated LR ratio value of 0.06 was less than the critical 2-value of 2.71 at 5% significance level. That means the null hypothesis (H0: μ=0 distribution assumption) was accepted at 5% significance level. Estimation of parameters of production function model Individual technical efficiency levels in sorghum production were estimated using the stochastic frontier production function (Appendix Table 9). The input variables used in the stochastic frontier production model were Land allocated for sorghum (ha), Urea(Kg), DAP in kg, oxen power (ODs), Human labour (MDs), Quantity of seed (kg) and chemicals (herbicides or pesticides). The coefficients of the input variables were estimated under the full frontier production function (MLE). (Table 16). The maximum likelihood estimation for the best practice households, the output elasticity with respect to all the selected variables has the expected sign. That means all input variables entered in the production frontier function have been found positive sign of estimated coefficients that generally confirm to prior expectations. The result of the Cobb- Douglas stochastic production frontier showed that land allocated for sorghum, chemical fertilizer (Urea and DAP), oxen power, human labour and chemicals (herbicide or pesticides) inputs were found to positively and significantly (at 1% significance level except oxen power which is at 5% level of significance) explained the level of efficiency of sorghum production (Table 16), which are important variables in shifting the frontier output to the right. This indicated that at each and every unit of these variables there is a possibility to increase the level of output. But the mount of seed is insignificant. Table 4: Maximum likelihood estimate of stochastic production frontier model Variables Parameters Coefficients Std. Err.Z-value Constant β0 1.297*** 0.364 3.56 Ln(LAND) β1 0.1896*** 0.042 4.54 Ln(UREA) β2 0.075*** 0.0145 5.18 Ln(DAP) β3 0.0349*** 0.0131 2.67 Ln(OXD) β4 0.1318** 0.056 2.35 Ln(HLAB) β5 0.2238*** 0.0847 2.64 Ln(SEED) β6 0.0904 0.0550 1.64 Ln(CHEM) β7 0.1409*** 0.0399 3.53 Sigma- square 2 0.399*** 0.088 Gamma 0.899*** Lambda 2.98*** Log likelihood function -25.92 Returns to scale 0.887 *, **, ***, Significant at 10%, 5% and 1% level of significance Source: Model output, 2015 One of the appealing features of the Cobb-Douglas functional form is the direct interpretation of its parametric coefficients as a partial elasticity of production with respect to the input used. This attribute allows one to evaluate the potential effects of changes in the amount of each input on the output. The variables land allocated for sorghum, oxen power, human labour and chemicals are the main inputs in determining the output level of sorghum for sample households in the study area. Whereas, the elasticity of fertilizer (urea and DAP) are very low implying that these have less effect in determining the output level at the best practice (the maximum technical efficiency score). The positive coefficients of inputs indicate a 1% increase in land allocated for sorghum, urea, DAP fertilizer, oxen power, human labour and herbicides or pesticides yields 0.189%, 0.075%, 0.035%, 0.132%, 0.224% and 0.141% increase in sorghum output, respectively. In other words, if all the inputs are increased by 1%, sorghum output would increase by 0.887% (Table 16). Labor input used for sorghum production was found to be statistically significant and with expected sign for sample households. Hence, there may be shortage of labor during sorghum production. That means there is overlapping of activities with other crops usually happened and shared the available labors. So, in this case labor would be the important variable in determining sorghum output level in the study area. Since the major concern of this study is to know the level of technical efficiency of sorghum growing households and the major factors determining the technical efficiency differentials in the study area, in-depth discussions on the structure of production function and coefficients of input variables is not required as such. The maximum-likelihood parameter estimates of the model show the relative importance of individual inputs and their aggregate
- 10. Sources of Technical Inefficiency of Smallholder Farmers in Sorghum Production in Konso District, Southern Ethiopia Gemeyida et al. 189 significance in the production process as well as being useful in predicting the level of individual household’s TE. The diagnostic statistics of inefficiency component reveals that sigma squared (δ2) was statistically significant at 1%, which indicates goodness of fit, and the correctness of the distributional form assumed for the composite error term. According to the model result of stochastic production function (Table 16) the value of λ is 2.98. The presence or absence of technical inefficiency was tested in the study using the important parameter of log likelihood in the half normal model = u/v. if = 0 there were no effects of technical inefficiency, and all deviations from the frontier were due to noise as stated in Aigner et al. (1977), the estimated value of = 2.98 significantly different from zero. The null hypothesis that there is no inefficiency effect was rejected at 5% level of significance, suggesting the existence of inefficiency effects for households in Konso district. Another important result in the analysis is the variance ratio parameter γ which found to be significant at 1% level expressing that about 90% of sorghum output deviations are caused by differences in farm level technical efficiency as opposed to the random variability that are outside their control of the producers. Returns to scale is the sum of elasticities of Cobb-Douglas frontier production function with respect to all inputs used, reflects the degree to which a proportional increase in all the inputs increase output. The sum of elasticity as presented in Table 16 is 0.89 which implies decreasing returns to scale such that when all inputs specified in the model for the production of sorghum are increased by 1 unit, output will in turn increase by 0.89 units. Even though nonnegative and less than one value of the sum of elasticity imply that producers are operating in the stage two of the production process, they are not efficient in allocation of resource this implies production is inefficient moreover there is a room to increase production with a decreasing rate. Technical efficiency scores of sample households The results of the efficiency scores indicated that there were wide ranges of differences in technical efficiency among sorghum producer households in the study area. The mean technical efficiency of sampled households during the survey period was 68.75%. The technical efficiency among households ranged from 21.29 to 96.28% (Table 17). This wide variation in household specific technical efficiency levels is consistent with study result reported by Betty (2005), Ike and Inoni (2006) and Berhan (2013). Table 5: Summary statistics of estimated technical efficiencies of sample households Description Technical efficiency estimates Maximum 0.9628 Minimum 0.2129 Mean 0.6875 Standard deviation 0.228 Skewness -0.415 Source: Own computation result, 2015. This shows that there is a wide disparity among sorghum producer households in their level of technical efficiency which may in turn indicate that there exists a room for improving the existing level of sorghum production through enhancing the level of household’s technical efficiency. The mean level of technical efficiency further tells us that the level of sorghum output of the sample households can be increased by about 31% if appropriate measures are taken to improve the efficiency level of sorghum producing households. In other words, there is a possibility to increase yield of sorghum by about 31% using the resources at their disposal in an efficient manner without introducing any other improved (external) inputs and practices. Table 6: Frequency distribution of the range of individual technical efficiency levels Range of TE (%) Frequency Percent <30 7 5.65 31-40 5 4.03 41-50 22 17.74 51-60 16 12.90 61-70 9 7.26 71-80 9 7.26 81-90 28 22.58 91-100 28 22.58 Total 124 100 Source: Own computation result, 2015. It is observed that 47.58% of the sample households are operating below the overall mean level of technical efficiency while, 22.58% of the households are operating at the technical efficiency level of more than 90%. However, as presented in Table 18 majority (52.42%) of the sorghum growing households were able to attain above the overall mean level of technical efficiency. This might imply that in the long run improving the existing level of technical efficiency of households alone may not lead to significant increment in the level of sorghum output.
- 11. Sources of Technical Inefficiency of Smallholder Farmers in Sorghum Production in Konso District, Southern Ethiopia Int. J. Agric. Educ. Ext. 190 Sources of technical inefficiency Having the information about the existence of technical inefficiency and measuring its magnitude, examining the major factors causing this inefficiency level is the next most important step of the study. About 13 socio-economic and institutional variables were hypothesized to affect level of technical inefficiency of sorghum growing households in the study area, out of which eight of them were dummy variables and the remaining were continuous variables. Most of the variables were discussed in the descriptive result section above. Hence, here we discuss only some of the variables in the inefficiency model. The driving force behind measuring households’ efficiency in sorghum production is to identify important variables or determinants to generate information in order to make an intervention and improve the existing level of efficiency. The parameters of the various hypothesized variables in the technical inefficiency effect model that are expected to determine efficiency differences among households were estimated through MLE method using one-stage estimation procedure. The determinants of technical inefficiency in a given period vary considerably depending on the socio-economic conditions of the study area particularly pertaining to managerial characteristics and other related factors. Table 19 shows the result of the technical inefficiency model estimates. Before discussing the significant determinants of inefficiency in sorghum production it is important to see how efficiency and inefficiency are interpreted. The result in table 19 is presented in terms of inefficiency and hence the negative sign shows the increase in the value of the variable attached to the coefficient means the variable negatively contribute to inefficiency level or conversely it contributes positively to efficiency levels. Thus, any negative coefficient happens to reduce inefficiency which implies its positive effect in increasing or improving the efficiency of the farm and vice versa. The coefficients of those socio-economic and institutional variables included in the model were estimated simultaneously by the ML procedure using the estimated level of technical efficiency as dependent variable. One important point to be considered is that the dependent variable is the inefficiency component of the total error term estimated in combination with the production frontier. Table 7: Maximum likelihood estimates of the factors determining technical inefficiency Variables Coefficient Std. Err z-value Constant -1.855 1.247 -1.49 Age 0.035** 0.015 2.37 Education -0.721* 0.425 -1.70 Family size -0.158** 0.081 -1.96 Off-farm occupation -0.602* 0.357 -1.69 Land fragmentation -0.089 0.130 -0.69 Access to training -0.550 0.405 -1.36 Extension service -0.902** 0.404 -2.23 Access to credit -0.134 0.409 -0.33 Livestock holding 0.101** 0.052 1.96 Plots distance 0.364*** 0.137 2.66 Soil fertility -0.705* 0.367 -1.92 Slope of farm land -0.410 0.492 -0.83 Sex of the household head -0.107 0.396 -0.27 *, **, ***, Significant at 10%, 5% and 1%, level of significance. Source: Model output, 2015. The results of the inefficiency model shows that, among thirteen variables used in the analysis, age, education level of household head, family size, off/non-farm activities, extension contact, livestock holding, plots distance from household’s residence and soil fertility status were significantly contributing to technical inefficiency of sorghum growing households. (Table 19). The following sections are dedicated for the discussions on the implications of those variables significantly contributing to technical inefficiency. Age: the technical inefficiency model result indicated that the coefficients of age for sample households, was statistically significant at 5% significance level and have positive sign. This implies that an increase in age of the household head is associated with increases in technical inefficiency model. This can be explained by the fact that as a household head becomes more aged in life, it becomes practically difficult if not impossible for him/her to take proper utilization of inputs and adoption of new technologies on their farms and therefore becoming more inefficient. The result is consistent with findings of Kinde (2005) and Hailemarim (2015).
- 12. Sources of Technical Inefficiency of Smallholder Farmers in Sorghum Production in Konso District, Southern Ethiopia Gemeyida et al. 191 Education: Education is believed to enhance the managerial and technical skills of households. According to Battese and Coelli (1995), education is hypothesized to increase the household’s ability to utilize existing technologies and attain higher efficiency levels. Several other studies also indicated that education being associated with efficient management of production systems and hence higher efficiency levels like studies of (Ahmed et al., 2002; Assefa, 2012; Zalkuwi et al., 2014; Wondimu et al., 2014; Hailemaraim, 2015). This could be argued that access to better education enables households to better manage their resources in order to sustain the environment and produce at optimum levels. The results of this analysis show that education level negatively and significantly affecting inefficiency. This indicates that, education capacitating in human capital that enhances the productivity of households since they will be better able to allocate homemade and purchased inputs, select the appropriate quantities of purchased inputs and choose among available techniques. Family size: It is plausible that the household with more members can perform farming activities on time. Crop production is labor-intensive activity in Ethiopia. In this regard, the effect of household size on technical inefficiency cannot be overemphasized. In fact, the literature offers mixed results. On the one hand, people argue that an increase in the number of family members could decrease technical inefficiency if it results in increased labor allocated to crop production. The coefficient of family size in the technical inefficiency model is negative and significant at 5% significance level. The result is similar to the expectation that those households having large family size are less inefficient than households having small family size, because; family labor is the main input in crop production. As the households has large family size, he/she would manage crop plots on time and may be able to use appropriate input combinations. The result is consistent with the findings of Abdulai and Eberlin (2001), Essa (2011) and Ahmed et al. (2002) but inconsistent with the findings of Fekadu (2004), Mekdes (2011), Endalkachew (2012) and Hailemarim (2015). Off-farm occupation: Refers to the opportunity that the farm households had to work outside their own farm operations. A number of studies conducted revealed that off/non-farm activities have a systematic effect on the technical inefficiency of the households. This is because households may allocate more of their time to off/non-farm activities and thus may lag in agricultural activities. On the other hand, incomes from off/ non-farm activities may be used as extra cash to buy agricultural inputs and can also improve risk management capacity of households. Off/non-farm activities can directly link with the timely availability of family labor for on-farm operations. That means, the time at which some portion of the family labor is diverted towards off/non-farm works can delay farm activities. It was hypothesized that there is efficiency differential among households who are engaged in off/non-farm and those who are not. The result in table 19 shows that, the coefficients of the variable entered into the technical inefficiency effect model indicated that the variable affects the level of technical inefficiency negatively and significantly. In other words, those households engaged in some off/non-farm activities are less technically inefficient relative to those who were not engaged in activities other than their farm operations. The possible explanation is that it would assist the households to supplement other costs associated with their living, perhaps. It may have affected technical inefficiency negatively for the reason that the income obtained from such off/non-farm activities could be used for the purchase of agricultural inputs, and augment financing of household expenditures which would otherwise, put pressure on on-farm income. Therefore, there is significant difference in technical inefficiency between the sample households who participate in off/non-farm activity and who are not in sorghum production in the study area. The result obtained is consistent with studies by Kinde (2005), Haileselassie (2005) and Hailemaraim (2015). But inconsistent with studies of Wondimu and Hassen (2014). Extension service: Consultation given by extension agents improves productivity of households. The output of inefficiency model also revealed that extension service utilization has negative sign and is significant at 10% significance level. This indicates that the more the household had extension visit, the less he/she will become inefficient. Thus, this result shows that consultation of extension agents increase sorghum production by decreasing level of technical inefficiency. This implies that a frequent contact facilitates the flow of new ideas between the extension agent and the household thereby giving a room for improvement in farm efficiency. Advisory service rendered to the households in general can help households to improve their average performance in the overall farming operation as the service widens the household’s knowledge with regard to the use of improved agricultural inputs and agricultural technologies. This result is in line with the results of Fekadu (2004), Abebe (2009), Musa (2013) and Hailemaraim (2015). Contrary to this, Jema (2008) found positive relationship between level of inefficiency and extension service. Livestock holding: Number of livestock the households have in terms of tropical livestock unit was hypothesized to have negative influence in the inefficiency model. That means households who have better livestock holding are less inefficient than others. However, the finding shows that, the coefficient is positive and significant at 5% level of significance indicating that household with higher livestock holding are more inefficient than those who have less livestock size. Livestock in a mixed crop-livestock farming system have two fold importance in that, it supply oxen power (draught power) for ploughing and threshing, provide manure that will be used to maintain soil fertility and it serves as shock absorber to an unexpected hazard
- 13. Sources of Technical Inefficiency of Smallholder Farmers in Sorghum Production in Konso District, Southern Ethiopia Int. J. Agric. Educ. Ext. 192 in crop failure as sources of food and income (cash) for the family. Timely ploughing and threshing is decisive in the production of crops thus access of livestock is important to better production. Since all types of animals and poultry production are considered in this study, livestock competitive effect has dominated its supplementary effect. This result is in line with the results of Fekadu (2004), Assefa (2012), Wondimu and Hassen (2014) and Hassen (2016). Plots distance: The result showed that the variable had positive sign and significant effect on technical inefficiency at 1% level as expected. This implied that there is positive relationship between plots distance from household’s residence in sorghum production and technical inefficiency (i.e., as the distance increases, technical inefficiency increases). Therefore, households whose farm plot is far from residence are more inefficient than those located at relatively near to farm plot. There is also significant mean technical efficiency difference between the nearest and the farthest farm plots from household’s residence at 1% level of significance. This could be attributed to the fact that the farther the farm land or farm plot from the respondent’s residence, the greater would be the cost of transport, management, supervision and opportunity cost. This in turn may hinder the optimal application of farm inputs and led to technical inefficiency. The result is consistent with findings of Alemayehu (2010). Soil Fertility: It was hypothesized that the fertility status of the land to have significant impact on the level of inefficiency in sorghum production. The result indicates that the coefficient of soil fertility status is negative and significant at 10% level of significance. This implies that, fertility of land is an important factor in influencing the level of inefficiency in the production of sorghum or positively contributes to technical efficiency of sorghum. Though in the short run, this value is out of the command of the household, it is possible to improve the fertility status by applying improved land management or soil conservation practices in the long run. Therefore, development programs in improving and maintaining the fertility of land will have positive impact in reducing inefficiency. This implies that households who allocated land which was relatively fertile were better in technical efficiency. Therefore, decline in soil fertility could be taken as cause for significant productivity difference. The result is in line with the arguments of Fekadu (2004), Alemayehu (2010), Mustefa (2014) and Hailemaraim (2015). CONCLUSIONS AND RECOMMENDATIONS Conclusions Efficiency is widely believed as the heart of agricultural production. This is because the scope of agricultural production can be expanded and sustained through efficient use of resources. It should be noted that studies considering agro-ecological zones will have important policy implications to identify appropriate development strategies in order to enhance the current performance of the agricultural sector. The estimated stochastic production frontier model indicated that land allocated for sorghum, Urea, DAP, oxen power, human labour and chemicals were significantly determinants sorghum production. The significant coefficients of these parameters indicates that the increased use of these input can increase the output of sorghum to a higher extent at the existing technology in the study area. Therefore timely availability of these input is crucial. The mean technical efficiency level of households in sorghum production was 0.69, ranging from 0.21 to 0.96. This implies existence of efficiency differentials among households in the study area. Sorghum production can be increased by 31% by the capacity of those households who grow sorghum through efficient use of the available resources, given the current state of technologies. Thus, the existing level of output could be increased by reallocation of the existing resources. Therefore, existence of inefficiency shows there is a room to increase the output of sorghum by improving the use of existing technologies by all households without introducing new technology. Smallholder households growing sorghum are not technically efficient and therefore there is allowance of efficiency improvement by addressing some important policy variables influenced households’ level of technical inefficiency in the study area. The estimated SPF model together with the inefficiency parameters show that age of the household head, educational, family size, off-farm activities, extension contact, livestock holding, plots distance and soil fertility were found to be the major significant determinants of technical inefficiency level of households in sorghum production. The negative coefficients of education, family size, extension contact, off-farm activities and soil fertility means these factors are significantly and negatively affected inefficiency of the households in the area. While, the positive coefficients of age and livestock holding and plots distance indicate that these factors affected inefficiency positively. The results indicated that age of the household head has positively and significantly affects technical inefficiency of sorghum production in the study area. The positive effect may be due to decrease in labour productivity as age increases after certain point. Also large family size was found to be important in crop production especially during peak seasons and this improves efficiency of farmers’ in sorghum production. That means one of the most important factors affecting households technical inefficiency is the use of intensive labour in sorghum production.
- 14. Sources of Technical Inefficiency of Smallholder Farmers in Sorghum Production in Konso District, Southern Ethiopia Gemeyida et al. 193 Off-farm activities affects technical inefficiency of sorghum producing households negatively, perhaps because incomes generated from such activities in these areas may be remarkable to bring a statistically significant variation in technical inefficiency. This suggests that, households participated in off/non-farm activities are technically less inefficient than those who are not involved. Also, estimated results of inefficiency model indicates that plots distance from households’ residence is positively related with technical inefficiency. This could be attributed to the fact that the farther the farm plot from the households’ residence, greater would be the cost of transport, management, supervision and opportunity cost. This in turn may hinder the optimal application of farm inputs and led to technical inefficiency. Finally, the negative coefficient of soil fertility in the inefficiency model indicates that, fertility of soil has significant and positive contributes to technical efficiency of sorghum production in the study area. This again implies that households with fertile land were technically efficient than those who have infertile land. Here, we can conclude that households with fertile land were technically efficient than the others. In general, it is concluded that, integrated development efforts that will improve the existing level of input use and policy measures towards decreasing the existing level of inefficiency will have paramount importance in improving the food security in the study area. These factors have important policy implications in that to mitigate the existing level of inefficiency of households in the sorghum production and development programs should act upon these variables. Recommendations Given the limited resources in the study areas, efforts to improve the efficiency of smallholder households who are the key actors in Ethiopia’s agrarian economy are indispensable. Thus, the result of the study provides information to policy makers and extension workers on how to improve farm efficiency level and specific determinants of technical inefficiency. The argument here is that improvements in the agricultural productivity in the use of modern technologies are expensive, require relatively longer time to achieve and households have serious financial problems to afford them. Moreover, the result of increment of productivity and production of agricultural sector by using improved technologies will be high if it is coupled with the improvement of the existing level of inefficiency of households. Since the existence of higher inefficiency and the principal factors that are responsible for the efficiency variation among the households have important policy implications so as to mitigate the existing level of inefficiency of households in the study area, the following policy recommendations have been drawn based on the results of the study. The implication of this study is that technical efficiency of the households can be increased by 31% through better allocation of the available resources, especially land, Urea, DAP, oxen power, human labour and chemicals. Thus, government or other concerned bodies in the developmental activities working with the view to boost production efficiency of households in the study area should work on improving productivity by giving especial emphasis for significant factors of production. Second, investment in education should be considered as a central ingredient in the achievement of improving agricultural productivity. This study indicates that, local government should give due attention for farmers education through establishing and strengthening informal education and short term trainings by using the available human and infrastructural facilities like extension agents and Farmers Training Centers. Hence, it is important for the agricultural development strategy of the study areas to have an institutional environment that facilitates farmer’s accessibility to education, especially, adult education. Therefore, it is possible to recommend that the regional government should have a prime responsibility to keep on provision of education in these areas to use the available inputs more efficiently under the existing technology. Third, negative and significant effect of the off-farm activities on technical inefficiency suggests that the income obtained from such off/non-farm activities could be used for the purchase of agricultural inputs and augment financing household expenditures which would otherwise put pressure on on-farm income. This indicates that there is a need to introduce activities that could enhance the off- farm income of households without affecting their farm time allocation so that the households would be in a position to invest the required amount of resources in sorghum production. Fourth, extension services have to keep on providing information and practical farming knowledge for all households to improve resource utilization. In other words increased investment in extension service and education could jointly contribute to an improvement in efficiency of sorghum producing households in the study area. That means, efficiency of households can better improved if the development agents equally give the extension service for all households. Therefore, the extension service given by development agents should be properly followed by the respective agricultural office. Also, the result of this study revealed that, soil fertility status affected technical inefficiency of negatively. This suggests households should strength the applications of fertilizers and indigenous soil conservation mechanisms to retain the fertility of the soil. And, development programs should give due emphasis to improve and maintain the fertility of land through awareness creation and introduction of technologies that improve and maintains fertility so that the efficiency of the households can be
- 15. Sources of Technical Inefficiency of Smallholder Farmers in Sorghum Production in Konso District, Southern Ethiopia Int. J. Agric. Educ. Ext. 194 improved. The policy implication is that improving and maintaining fertility of land by applying improved land management practices would increase efficiency of households there by crop production. The result reveals that there is land shortage in the study area as a result of high population growth. Hence, early interventions are called for intensive and efficient use of land farming practice in the area. Finally, the existing level of inefficiency in sorghum production is high and this calls for better attention of policy makers and researchers in tackling the sources of these inefficiencies to improve the benefit of sorghum producing households in the study area. ACKNOWLEDGEMENTS The authors are thankful to Haramaya University (Ministry of Education) for the financial support of the research project. REFERENCES Abba, W. 2012. Technical Efficiency of Sorghum Production in Hong Local Government Area of Adamawa State, Nigeria. Russian Journal of Agricultural and Socio Economic Sciences, 6 (6): 10- 15. Abebe Dagnew. 2009. Technical Efficiency of Onion Production Under Irrigation: The Case of Kalu Woreda of South Wollo. MSc Thesis, Haramaya University, Haramaya, Ethiopia. Abu Tefera. and Quintin, G. 2013. Ethiopia Grain and Feed Annual Report. Addis Ababa, Ethiopia. Ahmed, M. M., B. Gebremedhin, S. Benin and Ehui, S. 2002. Measurement and Source of Technical Efficiency of Land Tenure Contracts in Ethiopia. Environmental and Development Economics, 7: 507-528. Aigner, D.J. and Chu, S.F. 1968. On Estimating the Industry Production Function. American Economic Review, 58: 826-839. Aigner, D.J., C.A. Knox Lovell, and Schmidt, P. 1977. Formulation and Estimation of Stochastic Models. Journal of Econometrics, 6: 21-37. Ajibefun, I. A., 2002. Analysis of Policy Issues in the Technical Efficiency of Small Scale Farmers using the Stochastic Frontier Production: With Application to Nigerian Farmers. Paper Prepared for Presentation at the International Farm Management Association Congress, Wageningen, the Netherlands. Aldrich, N. 1984. Linear Probability, Logit, and Probit Models, Published in 1984. Sage Publications. Alemayehu, Ethiopia. 2010. Analysis of Factors Affecting the Technical Efficiency of Coffee Producers in Jimma Zone: A Stochastic Frontier Analysis. MSc Thesis, Addis Ababa University, Addis Ababa, Ethiopia. Alemayahu Seyoum, P. Dorosh and Sinafkish Asrat. 2011. Crop Production in Ethiopia: Regional Patterns and Trends Development Strategy and Governance Division, International Food Policy Research Institute, Ethiopia Strategy Support Program ІІ, Ethiopia: ESSP Working Paper, No.0016. Asefa Shumet. 2012. Analysis of Technical Efficiency of Crop Producing Smallholder Farmers in Tigray, Ethiopia. Stochastic Frontier Approach. Global Advanced Research Journal of Agricultural Science, 1(7): 191-200. ATA (Agricultural Transformation Agency). 2015. Annual Report Transforming Agriculture in Ethiopia. Addis Ababa, Ethiopia. Assefa, K. and Tadele, Z., 2012. "Increasing food production in Africa by boosting the productivity of understudied crops." Agronomy, vol. 2, pp. 240-283. Awraris Meron. 2012. The Impact of Climate Change and Adaptation through Agro ecological Farming Practices: A Case Study of the Konso Area in Ethiopia. MSc Thesis, Swedish University of Agricultural Sciences, Sweden. Battese, G.E. and Coelli, T.J. 1995. A Model for Technical Inefficiency Effects in a Stochastic Frontier Production Function for Panel Data. Empirical Economics, 20: 325 - 332. Battese, G.E. and Cora, G.S. 1977. Estimation of a Production Frontier Model: With Application to the Pastoral Zone of Eastern Australia. Australian Journal of Agricultural Economics, 21: 169-179. Berhan Tegegne. 2013. Analysis of Technical Efficiency in Onion Production under Irrigation Conditions: The Case of Smallholders in Kobo Woreda of Amhara Region. MSc Thesis, Haramaya University, Haramaya, Ethiopia. Besha, Tesfaye. 2003. Understanding Farmers Expanding Soil and Water Conservation in Konso, Wolaita and Wello, Ethiopia. Tropical Resource Management Papers, 41: 81-116. Betty Wambui. 2005. Technical Efficiency in Kenyan’s Maize Production: A Stochastic Approach. M.Sc. Thesis, Colorado State University, Fort collins, Colorado. Cheung, W.H., Senay, G.B., Singh, A. 2008. Trends and Spatial Distribution of Annual and Seasonal Rainfall in Ethiopia [online in] www.interscience.wiley.com Communities, SIDA, Nairobi, Kenya. Coelli, T.J. 1995. Estimators and Hypothesis Tests for Stochastic Frontier Function: A Monte Carlo Analysis. Journal of Productivity Analysis, 6: 247 – 268. Coelli, T.J. 1996. A Guide to FRONTIER Version 4.1: A Computer Program for Stochastic Frontier Production and Cost Function Estimation. CEPA Working Paper, 96/07, University of New England, Armidale, NSW, 2351, Austria. 34p. Coelli, T.J. 1998. ‘A Multi-stage Methodology for the Solution of Oriented DEA Models, Operations Research Letters, 23: 143-149.
- 16. Sources of Technical Inefficiency of Smallholder Farmers in Sorghum Production in Konso District, Southern Ethiopia Gemeyida et al. 195 Coelli, T., D.S.P. Rao and C.J.O .Donell G.E. Battese. 2005. Introduction to Efficiency and Production Analysis, USA. Springer. CSA (Central Statistical Agency), 2016. Annual statistics bulletin. Addis Ababa, Ethiopia CSA (Central Statistical Agency), 2014/15. Ethiopian statistical abstract for year 2014/15 vol. 2. Addis Ababa, Ethiopia. CSA (Central Statistical Agency). 2013. Agricultural Sample Survey: Area and Production of Crops, Meher Season. Addis Ababa, Ethiopia. CSA (Central Statistical Agency). 2012. Annual Statistics Bulletin. Addis Ababa, Ethiopia. Demeke, M., Di Marcantonio F. 2013. Analysis of Incentives and Disincentives for Sorghum in Ethiopia. Technical Notes Series, MAFAP, FAO, Rome. Demeke Mekuria. 2008. Impact of Small Scale Irrigation Schemes on Poverty Reduction: The Case of Bahir Dar Zuria District in West Gojjam Administrative zone. MSc Thesis, Haramaya University, Haramaya, Ethiopia. Endalkachew Yehun. 2012. Technical Efficiency Analysis of Malt Barley Production: The Case of Smallholder Farmers in Debark Woreda, North Gondar Zone of the Amhara National Regional State. MSc Thesis, Haramaya University, Haramaya, Ethiopia. Essa Chanie. 2011. Resource Use Efficiency of Smallholder Crop Production in the Central Highlands of Ethiopia. MSc Thesis, Egerton University, Egerton, Kenya. FAO (Food and Agricultural Organization). 2014. Crop and Food Security Assessment Mission to Ethiopia. Special Report of Food and Agriculture Organization. Farrell, M.J. 1957. The Measurement of Production Efficiency. Journal of the Royal Statistical Society, 120: 253 – 290. Fekadu Gelaw. 2004. Analysis of Technical Efficiency of Wheat Production: A study in Machakel Woreda. MSc Thesis, Haramaya University, Haramaya, Ethiopia. Fetene, M., Okori P., Gudu S., Mneney E., Tesfaye K. 2011. Delivering New Sorghum and Finger Millet Innovations for Food Security and Improving Livelihoods in Eastern Africa. Nairobi, Kenya, ILRI. Forch, W. 2003. Case Study: The Agricultural System of the Konso in South Western Ethiopia, Published 2003 Online: FWU Water Resources Publications 2003:1, University of Siegen, Germany. Geremew, G., Adugna A., Tadesse T., Tesso T., Belete K., Hailesilassie M. 2004. Development of Sorghum Varieties and Hybrids for Dryland Areas of Ethiopia. Uganda. Journal of Agricultural Science, 9: 594-605. Getahun Mengistu. 2014. Technical Efficiency in Onion Production: The Case of Smallholder Farmers in Dugda Woreda, East Shewa Zone. MSc Thesis, Haramaya University, Haramaya, Ethiopia. Getu Hailu, Vera B., Belay Kasa and Storck, H. 1998. Technical Efficiencies of Smallholder Annual Crop Production in Moisture Stress Area of Eastern Oromiya of Ethiopia: a Stochastic Frontier Analysis. Ethiopian Journal of Agricultural Economics, 2(2): 91 - 113. Gezehagne Walelign. 2008. Determinants and Role of Farmers’ Seed and Seedling Multiplication in the SNNP Region Seed System. MSc Thesis, Haramaya University, Haramaya, Ethiopia. Hailemaraim Leggesse. 2015. Technical Efficiency in Tef Production: The Case of Bereh District, Oromia National Regional State. MSc Thesis, Haramaya University, Haramaya, Ethiopia. Hailemichel Alemayehu. 2011. Indigenous Talents of Konso People to Cope with up with Climatic Change Susceptibility Southern Ethiopia. Arbaminch University, Ethiopia. Haileselassie Amare. 2005. Analysis of Technical Efficiency in Sorghum Production: The Case of Smallholder Farmers in Raya-Azebo District, Southern Tigray. MSc Thesis, Haramaya University, Haramaya, Ethiopia. Hassen Beshir. 2016. Technical Efficiency Measurement and Their Differential in Wheat Production: The Case of Smallholder Farmers in South Wollo Zone, Ethiopia. International Journal of Economics, Business and Finance, 4(1): 1-16. Hazarika, C. and Subramanian, S.R. 1999. Technical Efficiency of Government Supported Horticultural Crops in Oman. Indian Journal of Agricultural Economics, 54(2): 201-211. Ike, P. C. and Inoni, O. 2006. Determinants of Yam Production and Economic Efficiency Among Smallholder Farmers in South Eastern Nigeria. Journal of Central European Agriculture, 7(2): 337-342. Jema Haji. 2006. Production Efficiency of Smallholders’ Vegetable-dominated Mixed Farming System in Eastern Ethiopia: A Non-parametric Approach. Journal of African Economies, 16(1): 1-27. Jema Haji. 2008. Economic Efficiency and Marketing Performance of Vegetable Production the Eastern and Central Parts of Ethiopia. Doctoral Dissertation, Swedish University of Agricultural Science, Uppsala, Sweden. Jondrow, J., Lovell, K., I. M.I. and Schmidt, P. 1982. On the Estimation of Technical Inefficiency in the Stochastic Frontier Production Model. Journal of Economics, 19: 233-238. KDAO (Konso District Administrative Office). 2012. “Geographical Location Profile Data of the Konso District”. Annual statistics bulletin. Addis Ababa, Ethiopia. KDARDO (Konso District Agricultural and Rural Development Office). 2015. Annual Production Report of the Konso District for the Season of 2014/2015. Kifle Degefa. 2014. Economic Efficiency of Smallholder Farmers in Maize Production in Bako Tibe District, Oromia National Regional State. M.Sc. Thesis, Haramaya University, Haramaya, Ethiopia. Kinde Teshome. 2005. Analysis of Technical Efficiency of Maize Production. A Study in Assosa Woreda. MSc Thesis, Haramaya University, Haramaya, Ethiopia. Kohler, H.1992. Economics. D.C. Heath and Company. USA.
- 17. Sources of Technical Inefficiency of Smallholder Farmers in Sorghum Production in Konso District, Southern Ethiopia Int. J. Agric. Educ. Ext. 196 Koopmans, T.C. 1951. An Analysis of Production as Efficient Combination of Activities. In Activity Analysis of Production and Allocation, Koopmans, T.C., eds, Cowles Commission for Research in Economics, Monograph, 13. New York. Kopp, R.J. and V.K. Smith, 1980. Frontier Production Function Estimates for Steam Electric Generation: A Comparative Analysis. Journal of Southern Economic, 47: 1049-1059. Kumbhakar, S.C., S. Ghosh and McGuckin, T.J. 1991. A Generalized Production Frontier Approach for Estimating Determinants of Inefficiency in U.S. Dairy Farms. Journal of Business and Economic Statistics, 9: 279-286. Liewelyn, Richard V. and Williams, J. R. 1996. Non- parametric Analysis of Technical and Scale Efficiencies for Food Crop Production in East Java, Indonesia. The Journal of International Association of Agricultural Economists, 15(2): 113-126. Meeusen, W. and Van den Broeck, J. 1977. Efficiency Estimation from Cobb-Douglas Production Functions with Composed Error. International Economic Review, 18: 435-444. Mekdes Abera. 2011. Analysis of Technical Efficiency of Lentil (Lens Culinaris Medikus) Production: The Case of Gimbichu District, Eastern Shewa Zone of Oromia. MSc Thesis, Haramaya University, Haramaya, Ethiopia. MoFEC (Ministry of Finance and Economic Cooperation). 2015. Development and Poverty Profile of Ethiopia, Addis Ababa, Ethiopia. MoFEC (Ministry of Finance and Economic Cooperation). 2013. Annual Report on Macroeconomic Developments, Addis Ababa, Ethiopia. MoFEC (Ministry of Finance and Economic Cooperation). 2012. Development and Poverty Profile of Ethiopia, Addis Ababa, Ethiopia. Musa Hasen. 2013. Economic Efficiency of Smallholder Farmers in Maize Production: The Case of Arsi negelle District of West Arsi Zone, Oromia National Regional State. MSc Thesis, Haramaya University, Haramaya, Ethiopia. Mustefa Bati. 2014. Economic Efficiency in Barely Production: The Case of Chole District, East Arsi Zone, Oromia National Regional State. MSc Thesis, Haramaya University, Haramya, Ethiopia. Orewa, S.I. and Izekor, O.B. 2012. Technical Efficiency Analysis of Yam Production in Edo State: A Stochastic Frontier Approach. International Journal of Development and Sustainability, 1(2): 516–526. Reifscheider, D. and Stevenson, R. 1991. Systematic Departure from the Frontier: A Framework for the Analysis of Firm Inefficiency. International Economic Review, 32: 715- 723. Scarborough, V. and Kydd, J. 1992. Economic Analysis of Agricultural Markets: A Manual. Chatham, U.K. Natural Resource Institute. Schmidt, P. 1976. The Statistical Estimation of Parametric Frontier Production Functions. Review of Economics and Statistics, 58: 238-239. Sharif, N.M. and Dar, A.A. 1996. An Empirical Study of the Patterns and Sources of Inefficiency in Traditional and HYV Rice Cultivation in Bangladesh. Journal of Development Studies, 32: 612-629. Tamiru Karse. 2014. Indigenous Land Management Practices in Konso: South Ethiopia. MSc Thesis, Addis Ababa University, Addis Ababa, Ethiopia. UNDP (United Nations Development Program). 2015. National Human Development Report 2014 Ethiopia, Accelerating Inclusive Growth for Sustainable Human Development in Ethiopia, Addis Ababa, Ethiopia. WFP (World Food Program). 2010. Summary of Food Security and Vulnerability in Selected Cities of Ethiopia, Addis Ababa, Ethiopia. Wondimu, T. and Hassen, B. 2014. Determinants of Technical Efficiency in Maize Production: The Case of Smallholder Farmers in Dhidhessa District of Illuababora Zone, Ethiopia. Journal of Economics and Sustainable Development, 5(15): 274-284. Yamane, T. I. 1967. Statistics: An Introductory Analysis 2nd Edition. New York, Harper and Row. Zalkuwi1, J., Rakesh Singh, M.B., O.P Singh, Tribhuvan, Singh, U.P. 2015. Possibility of Improvement in Sorghum Production: A Comparative Study of Technical Efficiency in India and Nigeria. International Journal of Advances in Agricultural Science and Technology, 2(10): pg. 01-12. Zalkuwi, J., Rakesh Singh, and Singh, O.P. 2014. Assessment of Technical Efficiency of Sorghum Production in Adamawa State, Nigeria. Asian Journal of Agriculture and Food Sciences, 2(6): 542-547. Zenebe, G., O. A. and Tassew W. 2005. Technical Efficiency of Peasant Farmers in Northern Ethiopia: A Stochastic Frontier Approach. pp 103-123. In: Alemayehu, S., Assefa, A., B. D., Berehanu, N., Mulat D., T. B. and Wolday, A. (eds.), Proceeding of the Second International Conference on the Ethiopian Economy. Ethiopian Economic Association. Addis Ababa, Ethiopia. Accepted 18 December 2018 Citation: Gemeyida HK, Haji J, Tegegne B (2019). Sources of Technical Inefficiency of Smallholder Farmers in Sorghum Production in Konso District, Southern Ethiopia. International Journal of Agricultural Education and Extension, 5(1): 180-196. Copyright: © 2019. Gemeyida et al. This is an open- access article distributed under the terms of the Creative Commons Attribution License, which permits unrestricted use, distribution, and reproduction in any medium, provided the original author and source are cited.