Foraminiferal Approach to Palaeoenvironmental Interpretations: Case Study of Priabonian – Rupelian Sediments of the Niger Delta, Nigeria

Palaeoenvironmental analysis was carried out on eighty (80) ditch cutting samples of the Late Eocene-Early Oligocene sediments from two wells (well C consist of 13 samples collected at 30metres interval from depth range of 2410 -2770m while well F consists of 67 samples collected at 20metres from depth range of 2000-3320m) in the Northern Depobelt of the Tertiary Niger Delta. This study was carried out using standard micropalaeontological sample procedures and analysis as well as interpretation of the foraminiferal biofacies assemblages taking into consideration the qualitative and quantitative approaches. The qualitative method involved comparison of the recovered foraminifera with extant forms while the quantitative method involved the use of tau index, palaeowater depth (Pwd), percent of calcerous to arenaceous benthic foraminifera ratios (%FOBC: %FOBA), Fisher diversity and foraminifera/ ostracoda ratio. The palaeoenvironmental analysis indicates that the sediments were deposited in a non-marine to outer neritic environmental setting with salinity conditions fluctuating between normal marine and slightly hypersaline.

Recommended
Recommended
More Related Content
What's hot
What's hot (20)
Similar to Foraminiferal Approach to Palaeoenvironmental Interpretations: Case Study of Priabonian – Rupelian Sediments of the Niger Delta, Nigeria
Similar to Foraminiferal Approach to Palaeoenvironmental Interpretations: Case Study of Priabonian – Rupelian Sediments of the Niger Delta, Nigeria (20)
More from Premier Publishers
More from Premier Publishers (20)
Recently uploaded
Recently uploaded (20)
Foraminiferal Approach to Palaeoenvironmental Interpretations: Case Study of Priabonian – Rupelian Sediments of the Niger Delta, Nigeria
- 1. Foraminiferal Approach to Palaeoenvironmental Interpretations: Case Study of Priabonian – Rupelian Sediments of the Niger Delta, Nigeria IJGM Foraminiferal Approach to Palaeoenvironmental Interpretations: Case Study of Priabonian – Rupelian Sediments of the Niger Delta, Nigeria 1Ukpong, Aniediobong Jonah, 2Ekhalialu, Ogie Macaulay* 1,2 Department of Geology, University of Calabar, Calabar, Cross River State, Nigeria Palaeoenvironmental analysis was carried out on eighty (80) ditch cutting samples of the Late Eocene-Early Oligocene sediments from two wells (well C consist of 13 samples collected at 30metres interval from depth range of 2410 -2770m while well F consists of 67 samples collected at 20metres from depth range of 2000-3320m) in the Northern Depobelt of the Tertiary Niger Delta. This study was carried out using standard micropalaeontological sample procedures and analysis as well as interpretation of the foraminiferal biofacies assemblages taking into consideration the qualitative and quantitative approaches. The qualitative method involved comparison of the recovered foraminifera with extant forms while the quantitative method involved the use of tau index, palaeowater depth (Pwd), percent of calcerous to arenaceous benthic foraminifera ratios (%FOBC: %FOBA), Fisher diversity and foraminifera/ ostracoda ratio. The palaeoenvironmental analysis indicates that the sediments were deposited in a non-marine to outer neritic environmental setting with salinity conditions fluctuating between normal marine and slightly hypersaline. Keywords: Foraminifera, palaeoenvironment, palaeowater depth, tau index, Fisher diversity, Niger delta, palaeobathymetry, palaeosalinity INTRODUCTION Palaeoenvironmental analysis uses microfossils among other indices to provide direct evidence for the interpretation of ancient environments. Different sedimentary rocks are deposited in a wide range of environments that look very similar; the microfossils found in the sedimentary rocks are often a diagnostic feature in determining the ancient environments (Armstrong and Brasier, 2005). The presence of microfossils in sedimentary rocks therefore helps to precisely predict the depositional environment. Palaeoenvironmental analysis from microfossils perspective appears to be the most reliable method of studying the past environments. This is further confirmed by the study of Boltovskoy and Wright (1976), Boersma (1978), Brasier (1980), Murray (1971, 1976, 1991, 2006), Armstrong and Brasier (2005). Palaeoenvironmental studies most often depend on the previously established / proven relationship that exists between the biota and the ambient environment. This can be achieved with the use of abundant well-preserved foraminifera and other microfossils. The purpose of most studies including this current study is to attribute the change in living activities to actual environmental variations. Armstrong and Brasier (2005) suggested that ecological sensitivity of microfossils makes them particularly useful in studies of recent and ancient environmental conditions. Murray (2000) went further to establish that foraminifera are very dependable and extremely useful in analysing, determining and understanding recent and ancient marine environments. Changes in the composition of foraminiferal assemblages may be used to determine changes in sea-water depth. A range of factors (physical, chemical and biological) affect the ecological behaviour of foraminifera and should be considered during palaeoenvironmental studies. Furthermore, foraminifera have a wide habitation range, from terrestrial to deep sea and from polar to tropical belt (Armstrong and Brasier, 2005). *Corresponding Author: Ekhalialu Ogie Macaulay, University of Calabar, Calabar, Cross River State, Nigeria. E-mail: ansmacaulay@gmail.com International Journal Geology and Mining Vol. 4(2), pp. 165-178, June, 2018. © www.premierpublishers.org. ISSN: 3019-8261 Research Article
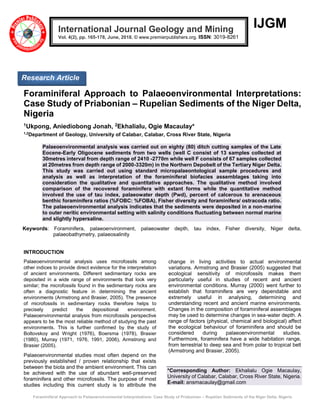
- 2. Foraminiferal Approach to Palaeoenvironmental Interpretations: Case Study of Priabonian – Rupelian Sediments of the Niger Delta, Nigeria Ukpong and Ekhalialu 166 Figure 1: Map of the Niger Delta showing the depobelts and location of the study wells (C and F) This current study is the first report in the Niger Delta using different foraminiferal palaeoenvironmental methods and harmonizing with the established depth range of the recovered foraminifera. Location of the study wells The study wells (wells C and F) were drilled in the Northern Delta depobelt of the Niger Delta which forms a segment of the Niger Delta petroleum province of Nigeria (figure. 1). The Niger Delta Basin is a prolific hydrocarbon province that contains enormous hydrocarbon both on the onshore, shallow and deep offshore areas and it is located between Latitudes 3° and 6° N and Longitudes 5° and 8° E respectively in the Gulf of Guinea, on the margin of West Africa (Reijers, 2011; Doust and Omatsola, 1987). The Niger Delta is described by Doust and Omatsola (1990) as one of the largest deltaic systems in the world. The formation of the Niger Delta basin began in the Early Cretaceous; it was developed at the triple junction between South Atlantic, Gulf of Guinea Margin and Benue Trough (Burke, 1972). The Niger Delta deltaic system is known to prograded over an area of three hundred kilometers (300 km) since the Late Eocene (Short and Stauble, 1967; Burke, 1972; Evamy et al., 1978; Whiteman, 1982; Stacher, 1995). The study by Evamy et al. (1978), Ejedawe (1981), Knox and Omatsola (1987) and Stacher (1995) point out that the evolution of the Niger Delta is controlled by pre- and synsedimentary tectonics. The delta has prograded southwestward, forming depobelts known as the most active sections / portions of a delta during each stage of its development (Doust and Omatsola, 1990). Kulke (1995) and Hospers (1965) defined the Niger Delta as one of the largest regressive deltas in the world and it covers an area of approximately 300,000 km2 with a sediment volume of 500,000 km3 respectively. Kaplan et al. (1994) proposed a sediment thickness of over 10 km in the basin depocenter. The Niger Delta is a delta at equilibrium state due to the equal contribution from fluvial, wave and tide influence. Research by Evamy et al. (1978) and Doust and Omatsola (1990) suggested that the structural configuration and the stratigraphy of the Niger Delta were largely influenced by the interaction between the rates of sediment supply and subsidence. Three (3) main vertically stacked lithologic units are known and defined in the Niger Delta by various workers (Doust and Omatsola, 1990; Weber, 1971; Weber & Daukoru, 1975; Evamy et al., 1978; Ejedawe, 1981; Knox and Omatsola, 1987) and they correspond to the three-fold lithostratigraphic subdivision proposed by Short and Stauble (1967) for the subdivision of the Niger Delta viz: i. Benin Formation (indicating continental environment) (youngest) ii. Agbada Formation (indicating transitional environment) and iii. Akata Formation (indicating marine environment) (oldest) Numerous authors have published papers on the geology of Niger Delta. Examples include the following: Short and Stauble (1967), Evamy et al. (1978), Ejedawe (1981), Knox and Omatsola (1987) Petters (1979, 1981, 1982, 1983, 1984, 1995); Doust and Omatsola (1990), Stacher (1995), Reijers et al. (1997), Reijers (2011), Ukpong et al (2017a, 2017b, 2017c)
- 3. Foraminiferal Approach to Palaeoenvironmental Interpretations: Case Study of Priabonian – Rupelian Sediments of the Niger Delta, Nigeria Int. J. Geol. Min. 167 MATERIALS AND METHODS Materials A total of eighty (80) ditch cutting samples were used for this study. Well C ranges from depth 2800m – 2410m consisting of thirteen (13) samples at 30metres interval while well F ranges from depth 2000m – 3320m consisting of sixty-seven (67) samples at 20metres interval respectively. Foraminiferal analysis The anhydrous sodium carbonate method was utilized for the separation of foraminifera in this study as outlined by Brasier (1980) and Armstrong and Brasier (2005). 20 - 40g of the ditch cutting was used in the sample preparation. The sample preparation was made in three (3) phases: soaking, wet sieving and drying of residues. The residues obtained after the extraction of foraminifera from the prepared samples were properly stored in well labelled sample bags for lithologic/sedimentologic analysis. Identification of the foraminifera extracted from the samples was done by comparing picked forms with previously published forms. Palaeoenvironmental analysis The current approaches used in foraminiferal palaeoenvironmental studies are mainly based on concepts in vogue in modern foraminiferal studies mostly on empirical comparison of living and death forms in modern assemblages. The studies of Murray (1971, 1973, 1976 and 2006) and Murray and Wright (1974) have proven this fact. The palaeoenvironmental interpretation also relies on the use of planktonic and benthic foraminifera as well as other accessory taxa such as ostracoda, pelecypoda and gastropoda. The palaeoenvironment interpretations of this study rest on three basic assumptions (after Douglas 1979): i. The physiological adaptations of species do not change with time ii. The depth distribution of foraminifera species do not change with time iii. The palaeoenvironemental requirements of foraminifera species are fixed and do not change with time. These assumptions are made with the view that, as new bathymetric zones are generated in the marine environments, the new depth range of the foraminifera species either remain unchanged or remain somewhat similar to their parent species due to development of similar morphological features that can be attributed to the transfer of genetic information from parents to offspring. Douglas’s (1979) study of form, structure and environment of living species and fossil fauna correlates and supports these assumptions. Foraminiferal palaeoenvironmental methods used in this study include: i. Species diversity patterns: Species diversity shows an upsurge from the shoreline to the edge of the continental shelf and then declines or remains unchanged on the continental slope (Bandy, 1953a, b).This is probably due to prevailing of tougher conditions in the coastal area such as clastic influx and mixing at the coast. The species diversity index adopted in this study is the Fishers- index developed by Fisher et al., (1943) taking into account the species abundance as well as the number of species. Fisher index (α) of species diversity is given as α=n1:x. X is a constant with a value of <1, n1= N(1-x), N denotes the number of individuals. The measure of the distribution of species abundance can be approximated using the Fisher’s log series. The Fisher’s log series used here is after Wright (1972). Species diversity has a multiple purpose. It is a pointer to palaeosalinity (Valchev, 2003) of sediment using the recovered foraminiferal information and it is also informative for palaeobathymetry (Valchev, 2003). The values of Fisher-index increase as the depth increases. Outer shelf is characterized by α=5-19, the slope – by α=5-25. The highest values of α demonstrates the lowermost continental slope (Murray, 1976). Salinity levels of a water body influence the species diversity value. Values of α>5 suggest normal salinity (Murray, 1991). Hyposaline and hypersaline conditions are generally characterized by low species diversity (Valchev, 2003). Species diversity can also be useful in determining the dissolved oxygen levels. Low oxygenated environment demonstrate low species diversity (α<7) and they are dominated by 2-3 species comprising over 80 percent of the total number of individuals in the samples (Valchev, 2003). ii. Palaeowater depth (Pwd): Palaeowater depth is a significant descriptor in reconstructing palaeoenvironment. Planktic/Benthic (P/B) ratio is the measure of the ratio between the planktic and benthic foraminifera. Grimsdale and Morkhoven (1995) observed that the abundance of planktic foraminifera increases beyond the outer shelf depths; this also validates the use of P/B ratio as depth estimators and can be easily determined as it requires no taxonomic identification apart from the separation into planktic and benthic groups. Lipps (1979) observed that there is preferential elimination of some foraminifera species towards the shoreline. The use of P/B ratio is based on the fact that planktic foraminifera are depth-stratified and are very sensitive to certain environmental (limiting) factors such as hydrostatic pressure, temperature, salinity and light which are dependent on water depth (Douglas, 1979). However, it is pertinent to state in clear terms that water depth per se is not a limiting factor to the survival of foraminifera species.
- 4. Foraminiferal Approach to Palaeoenvironmental Interpretations: Case Study of Priabonian – Rupelian Sediments of the Niger Delta, Nigeria Ukpong and Ekhalialu 168 The palaeowater depth was measured using recalculated equation of Van der Zwaan et al. (1990) instead of the traditional method. Depth (m) = e3.58718 + (0. 03534 x percent P) . According to Murray (1976), inner shelf is characterized by up to 20percent planktic individuals, the middle shelf – 10-60 percent, the outer shelf – 40- 70percent, and the upper slope - >70percent. The highest values 90percent are known in the lowermost slope (Boersma, 1978). iii. Triangular plot for foraminifera assemblages: This is based on the three major groups of wall structure (shell composition) of foraminifera: the agglutinated/ arenaceous (Textulariina), the porcellanous (Miliolina) and the hyaline (Rotaliina). The first group (Suborder Textulariina) builds their test from sea/ ocean particles held together with organic calcerous / siliceous cements. The second group (Suborder Miliolina) and the third group (Suborder Rotaliina) secrete calcerous shells that vary in chemical components, microstructure and even in surface lustre. The relative proportion of shell types found in benthic foraminifera assemblages varies from one sample to another. The Miliolina, Rotaliina and Textulariina (MRT) plot can be used to discriminate ranges of palaeosalinity of deposition (Murray, 1971, 1973, 2006; Murray and Wright, 1974; Petters, 1982). iv. Percent of calcerous to arenaceous benthic forminifera ratios (%FOBC: %FOBA): this is an indirect measures of salinity conditions (Douglas, 1979). The percent ratio of calcareous to arenaceous benthic foraminifera (%FOBC: %FOBA) is a good pointer for palaeoenvironmental studies, the high values of %FOBC: %FOBA suggests shallower palaeowater depths while higher %FOBA: %FOBC suggests deeper palaeodepths (Boersma, 1978). v. Tau-index: Gibson (1988) was the first to introduce the use of Tau-index as a bathymetrical indicator from data obtained from the Gulf of Mexico. Tau index tends to increase with depth and can be calculated using the formula: Tau index = b. %p. Where b is the number of benthic individuals and %p is the percent of the number of planktic individuals in a sample, both converted into %. Depths of up to 40m has a tau value of<100, depths range between 40 and 1000 m are characterized by tau values between 100-1000 while depths up to 2000m has tau values between 1000-10000 (Gibson, 1988). vi. Percent Foramininfera: percent Ostracoda (%F: %O): This can also be used as an environmental indicator. The percentF: percentO tends to increase with depth from lagoonal areas into Open Ocean and offshore areas (Bandy, 1963). The P/B ratio of offshore areas is usually hundred times higher than the ostracoda recovery (Brady, 1967). The palaeoenvironment of deposition of the sediment penetrated by the study wells are interpreted based on quantitative methods (such as tau index, pwd, percent FOBA/ percent FOBC and Fisher’s diversity) and qualitative method (depth range of living form). The study of Petters (1982,1995) have proven that the formations that comprises the Niger Delta contain palaeobathymetrically significant benthic foraminifera that characterized different environments of deposition from shallow (coastal) to very deep (bathyal). The indicator foraminiferal assemblages and individual specimens for different depths described by Bandy (1953a, 1953b, 1963), Murray (1971, 1973, 2006), Boltovsky and Wright (1976) are used to characterize the palaeobathymetric environments. For convenience and for clarification purposes, the terminology of palaeobathymetric subdivision adopted by Petters (1995) has been used in this study (Figure 2). Neritic will be depth range of 0-200m (comprising of shallow inner neritic = 0-10m, inner neritic = 0-40m, middle neritic = 40-100m, outer neritic = 100-200m). Bathyal will be > 1000m. RESULTS AND DISCUSSION The study wells (well C: interval 2410 – 2800m and well F: interval 2000 – 3320m sampled at 30m and 20m depth ranges respectively) penetrated sediments characterized by alternation of sandstone/sand and shale, the shale is dark grey in colour, sub fissile – fissile, micromicaceous and moderately hard - hard. The sand is smoky white – brown, fine - coarse grained, sub-angular - rounded, poorly - well sorted and occasionally ferruginized, carbonaceous, glauconitic and predominantly unconsolidated – consolidated. These sediments of heterogeneous sequence of alternating shale and sand/sandstone belong to the Middle - Lower units of the paralic Agbada Formation described by Short and Stauble (1967), Doust and Omatsola (1990) and Whiteman (1982) as a lithostratigraphic subdivision of the Niger Delta subsurface. Foraminiferal analysis was carried out on eighty (80) samples obtained from the two wells (C and F). The foraminifera forms recovered include planktonic and benthic foraminifera (calcareous benthic and arenaceous benthic foraminifera). Some foraminifera forms are long ranging in terms of stratigraphic occurrence while others have restricted stratigraphic occurrence with regional – cosmopolitan distribution. Foraminifera distribution chart of the wells C and F are presented in appendix. The total count of picked foraminifera prior to description was four thousand and twenty two (4022) specimens but due to poor preservation most of the recovered foraminifera could not be described and it is strongly associated with the Eocene – Oligocene transition. A total count of one
- 5. Foraminiferal Approach to Palaeoenvironmental Interpretations: Case Study of Priabonian – Rupelian Sediments of the Niger Delta, Nigeria Int. J. Geol. Min. 169 Figure 2: Foraminiferal biofacies model for the Niger Delta (Petters,1995). thousand, eight hundred and seventy-two (1872) foraminifera specimens were described from the two wells (wells C and F). Also recovered were seventy-two (72) ostracods, two (2) pelecypods and one (1) gastropod which were collectively classified as miscellaneous. The Eocene – Oligocene boundary was detected based on the recovered foraminifera from the study wells. The age (biozonation and biochronology) and the transition oxygen changes across the Eocene – Oligocene boundary of the study wells (wells C and F) have been discussed in Ukpong et al. (2018) and Ukpong and Ekhalialu (2017c) Palaeobathymetry The foraminiferal distribution chart of the two wells (wells C and F) is presented in figure 3 and 4 respectively. The palaeoenvironmental analysis of the study wells (wells C and F) show a range of environment from non-marine, shallow inner neritic, inner neritic, mid neritic and outer neritic settings based on the foraminiferal biofacies assemblages (planktonic and benthic forms) obtained and the use of some quantitative methods (such as tau index, pwd, percent FOBA / FOBC, Fisher diversity). Table 1 and 2 (in appendix) show the summary of the quantitative foraminiferal distribution of wells C and F.
- 6. Foraminiferal Approach to Palaeoenvironmental Interpretations: Case Study of Priabonian – Rupelian Sediments of the Niger Delta, Nigeria Ukpong and Ekhalialu 170 Figure 3: Foraminiferal chart of well C
- 7. Foraminiferal Approach to Palaeoenvironmental Interpretations: Case Study of Priabonian – Rupelian Sediments of the Niger Delta, Nigeria Int. J. Geol. Min. 171 Figure 4: Foraminiferal chart of well F
- 8. Foraminiferal Approach to Palaeoenvironmental Interpretations: Case Study of Priabonian – Rupelian Sediments of the Niger Delta, Nigeria Ukpong and Ekhalialu 172 Palaeobathymetry of Well C In Well C, intervals 2410-2440m, 2530-2560m, 2590- 2680m, 2710-2741m were inferred to have been deposited in shallow inner neritic settings based on the calculated indices (table 1), absence of planktic foraminifera and the abundance of shallow marine foraminifera such as Nonion spp., Nonionella spp., Hanzawaia spp., Hopkinsina spp.,Eponides spp., Epistominella spp. etc within the interval. In well C, interval 2560-2590m was deposited in a non- marine setting based on the calculated indices (table 1 in appendix) and absence of foraminifera. In Well C, interval 2440-2530m indicated to be deposited in inner – mid neritic settings based on the calculated indices (table 1 in appendix), paucity of planktic foraminifera and the co-occurrence of shallow marine foraminifera (Nonion spp., Nonionella spp., Hanzawaia spp., Hopkinsina spp. Eponides spp., Epistominella spp.) and few deep marine foraminifera (Bolivina spp. and Uvigerina spp.) within the interval. This corresponds to the study of Petters (1995) Palaeobathymetry of Well F In well F, intervals 2020-2240m and 2860-2880m were inferred to have been deposited in a non-marine setting based on the calculated indices (table 2 in appendix) and absence of foraminifera. Intervals2000-2020m, 2320- 2340m, 2400-2420m, 2760-2780m, 2880-2920m, 2980- 3000m, 3080-3100m, 3200-3220m,3240-3300min well F were also inferred to have been deposited in shallow inner neritic settings based on the calculated indices (table 2 in appendix), absence of planktic foraminifera and the abundance of shallow marine foraminifera such as Nonion spp., Nonionella spp., Hanzawaia spp., Hopkinsina spp.,Eponides spp., Epistominella spp. etc within the interval. Similar assemblages have been used by Petters (1995). Sediment deposited in Well F, intervals 2260-2320m, 2340-2360m, 2380-2400m, 2440-2500m, 2540-2720m, 2740-2760m, 2780-2800m,2820-2840m, 2920-2980m, 3000-3080m, 3100-3200m, 3220-3240m were also indicative of inner – mid neritic depositional settings based on the calculated indices (table 2 in appendix), paucity of planktic foraminifera and the co-occurrence of shallow marine foraminifera (Nonion spp., Nonionella spp., Hanzawaia spp., Hopkinsina spp., Eponides spp., Epistominella spp.) and few deep marine foraminifera (Bolivina spp., Uvigerina spp., Praeglobobulimina spp.) within the interval. This corresponds to the study of Petters (1995). In Well F, interval 2340-2360m, 2420-2440m, 2500-2540m, 2720-2740m were also indicative of an outer neritic depositional setting based on the calculated indices (table 2 in appendix), moderate planktic foraminifera recovery and the co-occurrence of some shallow marine foraminifera (Nonion spp., Nonionella spp., Hanzawaia spp., Hopkinsina spp.,Eponides spp., Epistominella spp.) and abundance deep marine foraminifera (Bolivina spp., Uvigerina spp.). This corresponds to the study of Petters (1995). Palaeosalinity Foraminifera have successfully conquered most habitats and live in all marine environments from the shallowest intertidal area to the deepest ocean (Murray, 1971). All these areas are characterized by different salinity values and can be distinguished and interpreted based on the Fisher’s log series plot of Wright (1972) and Foraminifera shell-type (morphogroup) ratio (triangular plot) of Murray (1973). Palaeosalinity analysis of well C The Miliolina, Rotaliina and Textulariina (MRT) plot (Figure of well C reveals the dominance of the Rotaliina / hyaline calcareous with frequent but minor occurrence of arenaceous test and minute miliolina shell type, suggesting a range of environment based on varying salinity viz: normal marine shelf sea – continental slope as well as hyposaline - hypersaline environment while the Fisher’s log series plot (Fig. 6) suggests hypersaline setting. Comparison with modern microfaunas based on the study of Murray (1973, 1991 and 2006) and Valchev (2003) assisted in constricting the results. The microfaunas of the sediments penetrated by well C are essentially of those that are indicative of a normal-marine – slightly hypersaline shelf. The dominance of the calcareous benthic foraminifera (FOBC) with over 90percent of total foraminifera forms; suggest normal marine condition (Nagy et al., 1988) and the presence of few Miliolids affirm slightly hyper marine conditions. Armstrong and Brasier (2005) further reaffirms this interpretation. Figure 5: MRT plot for well C (Modified from Murray, 1973)
- 9. Foraminiferal Approach to Palaeoenvironmental Interpretations: Case Study of Priabonian – Rupelian Sediments of the Niger Delta, Nigeria Int. J. Geol. Min. 173 Figure 6: Fisher’s log series plot for well C (modified from Wright, 1972) Palaeosalinity analysis of well F The Miliolina, Rotaliina and Textulariina (MRT) plot (Figure 7) of well F reveals the dominance of Rotaliina / Hyaline calcerous with frequent but minor occurrence of arenaceous test and minute miliolina suggesting a range of environment based on varying salinity viz: normal marine shelf – continental slope as well as hyposaline – hypersaline environments while the Fisher’s log series plot (Figure 8) suggest hypersaline - normal marine shelf setting. Comparison with modern microfaunas based on the study of Murray (1973, 1991, and 2006) and Valchev (2003) assisted in constraining the results. The microfaunal content of the sediments penetrated by well F are essentially of those that characterize a normal-marine – slightly hypersaline environmental setting. The dominance of the calcareous benthic foraminifera (FOBC) with over 90percent of total foraminifera forms, suggest normal marine condition (Nagy et al., 1988) and the presence of few Miliolids affirms the slightly hyper marine conditions. Armstrong and Brasier (2005) further reaffirms the interpretation presented in this study. Figure 7: MRT plot for well F (modified from Murray (1973) Figure 8: Fisher’s log series plot for well F (modified from Wright, 1972)
- 10. Foraminiferal Approach to Palaeoenvironmental Interpretations: Case Study of Priabonian – Rupelian Sediments of the Niger Delta, Nigeria Ukpong and Ekhalialu 174 SUMMARY AND CONCLUSION The palaeoenvironment of deposition (palaeobathymetry and palaeosalinity) of two wells from the Niger Delta encompassing Priabonian – Rupelian sediments was attempted based on qualitative and quantitative methods. The qualitative method involved comparison of the recovered foraminifera with extant forms or living relatives while the quantitative method involved the use of tau index, pwd, percent FOBA/ percent FOBC, Fisher diversity, foraminifera / ostracoda ratio. The palaeoenvironmental analyses reveal that the sediments were deposited in a non-marine to outer neritic environmental setting with salinity conditions fluctuating between normal marine to slightly hypersaline. ACKNOWLEDGEMENT We (the authors) wish to express our profound gratitude to the management of Nigerian National Petroleum Corporation (NNPC) and Nigerian Agip Oil Company (NAOC) for providing the ditch cuttings for this study. Many thanks to the Department of Geology, University of Calabar, Calabar for the encouragement. The authors are grateful to the following reviewers: Prof. Om N. Bhargava. (Centre of Advanced Geology, Panjab University, India), Dr. Kamil Zágoršek (Technical University of Liberec, Czech Republic), Dr. Lluís Checa Soler (Institut Català de Paleontologia "M.Crusafont", Spain), Dr. Sanjay Kumar Mukhopadhyay, (formerly, Geological Survey of India) and Dr. Andrey Yu. Gladenkov (Geological Institute, Russian Academy of Sciences, Russia) for their useful comments that greatly improved this paper. REFERENCES Armstrong H. A. And Brasier M. D. (2005). Microfossils. Second Edition. Blackwell Publishing. Bandy, O. L. (1953a). Ecology and paleoecology of some California foraminifera; Part I, the frequency distribution of Recent foraminifera off California. Journal of Paleontology, 22, 161-182. Bandy, O. L. (1953b). Ecology and paleoecology of some California foraminifera; Part II, foraminifera evidence of subsidence rates in the Ventura basin. Journal of paleontology, 27, 183-203. Bandy, O. L. (1963). Dominant parallic foraminifera of Southern California and Gulf of California. Contribution Cushman Foundation for Foraminiferal Research, 14 (4), 127-134. Blow, W. H. (1969). Late - middle Eocene to recent planktonic foraminiferal biostratigraphy. In P. Bronnimann, & H. H. Renz (Eds.), Proceedings of first international conference on planktonic microfossils (pp. 199-422). Geneva: Leiden. Boersma, A. (1978). Foraminifera. In B. U. Haq & A. Boersma (Eds.), Introduction to Marine Micropaleontology (pp. 19-77). North Holland: Elsevier. Boltovskoy, E., & Wright, R. (1976). Recent Foraminifera: The Hague: Springer Science Media. Brasier, M.D. (1980). Microfossils. Kingtons-upon-Hull : University of Hull Press. Burke, K. (1972). Longshore drift, submarine canyons and submarine fans in development of Niger Delta. American Association of Petroleum Geologists Bulletin, 56, 1975-1983. Channel. Paleontology Association. London: Douglas, R. G. (1979). Benthic foraminiferal ecology and paleoecology: a review of concepts and methods. Society of Economic Paleontologist and Mineralogists short course, 6, 21-53. Doust, H., & Omatsola, E. (1990). Niger Delta. In J. D. Edwards, & P. A. Santogrossied, (Eds.), Divergent / passive margin basins (pp. 201-238). American Association of Petroleum Geologists. Ejedawe, J. E (1981). Patterns of incidence of oil reserves in Niger delta basin, American Association of Petroleum Geologists Bulletin, 65, 1574-1585. Evamy, B.D., Haremboure, J., Kamerling, P., Knaap, W.A., Malloy, F.A, & Rowlands, P.H. (1978). Hydrocarbon habitat of Tertiary Niger Delta. American Association of Petroleum Geologists Bulletin, 62, 1-39. Fisher, R. A., Corbet, A. S., & Williams, C. B. (1943). The relation between the number of species and number of individuals in random samples of an animal population. Gibson, T. G. (1988). Assemblage characteristics of modern benthic foraminifera and application to environmental interpretation of Cenozoic deposits of Eastern North America. Review of Paleobiology Colloquium Special, 2, 777-787. Grimsdale, T., & Markhoven, F. (1955). The ratio between pelagic and benthonic foraminifera as a means of estimating depth of deposition of sedimentary rocks. 4th World Petrology Congress Proceedings Section, 473- 491. Hampshire and Paris Basins and the English Hospers, J. (1971). The geology of the Niger Delta area. In P. M. Delany (Ed.), The geology of the east Atlantic continental margin (pp. 125-142). London: International Council for Scientific Unions. Journal of Animal Ecology, 12, 42-58. Kaplan, A., Lusser, C.U., & Norton, I. O. (1994). Tectonic map of the world. American Association of Petroleum Geologists, panel 10. Knox, G. J., & Omatsola, E.M. (1989). Development of the Cenozoic Niger Delta in terms of the ‘escalator regression’ model and impact on hydrocarbon distribution. In W. J. M. Van der Linden, S. A. P. L. Cloetingh, J. P. K. Kaasschieter, J. A. M. Van der Gin. Coastal Lowlands, Geology and Geotechnology (pp. 181-202). Dordrecht: Kluwer Academic Publishers. Kulke, H. (1995). Nigeria, In H. Kulke (Ed.), Regional petroleum geology of the world. Part II: Africa, America, Australia & Antarctica (pp. 143-172). Berlin: Brüder Borntraeger. Lipps, H. J. (1979). Ecology and paleoecology of planktic foraminifera. Society of Economic Paleontologist & Mineralogists (SEPM) short course, 6, 62-104.
- 11. Foraminiferal Approach to Palaeoenvironmental Interpretations: Case Study of Priabonian – Rupelian Sediments of the Niger Delta, Nigeria Int. J. Geol. Min. 175 Murray, J. W. (1976). A method of determining proximity of marginal seas to an ocean. Marine Geology, 22, 103-119. Murray, J. W. (2006). Ecology and applications to benthic foraminifera. Cambridge: Cambridge University Press. Paleontology, 14, 1-129 Murray, J. W., & Wright, C. A. (1974). Paleogene 11oraminiferida and paleoecology, Murray, J.W. (1971). Ecology and paleoecology of benthicforaminifera. New York: John Wille & Sons. Murray, J.W. (1973). Distribution and ecology of living benthic foraminiferids. New York: Crane, Russak & Company. Murray, J.W. (1991). Ecology and paleoecology of benthic foraminifera. New York: Longman Scientific and Technical. Murray, J.W. (2000). When does environmental variability become environmental change? The Proxy Record of benthic Formanifera. Environmental Micropaleontology, Topics in Geobiology. New York, Kluwer Academic/Plenum Publishers. Nagy, J., Lofadli, M., & Backstrom, S.A. (1988). Aspects of Foraminiferal Distribution and Depositional Conditions in Middle Jurassic to Early Cretaceous Shales in Eastern Spitsbergen. Abh Geology Journal, 41, 287-300. Petters, S. W. (1979). Some late Tertiary foraminifera from parabe-1 well, eastern Niger Delta. Revista Espanola de micropaleontologia, 11, 119 – 133. Petters, S. W. (1981). Eocene foraminifera from clastic and phosphatic beds of the Gulf of Guinea. In J. W. Neale, & M. D. Brasier (Eds.), Microfossils from recent and fossil shelf Sea (pp. 214-230). Chichester, England: Ellis Horwood. Petters, S. W. (1983). Gulf of Guinea planktonic foraminiferal biochronology and geological history of the South Atlantic. Journal of Foraminiferal Research, 13, 32 – 59. Petters, S. W. (1984). An ancient submarine canyon in the Oligocene – Miocene of the western Niger Delta. Sedimentology. 31, 805-810. Petters, S. W. (1995). Foraminiferal biofacies in the Nigerian rift & continental margin deltas. In M.N. Oti & Postma (Eds.), Geology of deltas (pp. 219-235). Rotterdam: Balkema. Petters, S.W. (1982). Central West African Cretaceous – Tertiary benthic foraminifera and stratigraphy. Palaeontographica, 179, 1-104. Reijers, T.J.A (2011). Stratigraphy and sedimentology of the Niger Delta. Geologos, 17 (3), 133-162 Reijers, T.J.A., Petters, S.W., & Nwajide, C.S. (1997). The Niger Delta Basin. In R.C. Selley (Ed.), African basins (pp. 145-168). Sedimentary Basins of the World. Short, K. C., & Stauble, A. J. (1967). Outline of Geology of Niger Delta. American Association of Petroleum Geologists Bulletin, 51, 761-779. Stacher, P. (1995). Present understanding of the Niger Delta hydrocarbon habitat. In M.N. Oti, & G. Postma, (Eds.), Geology of deltas (pp. 257-267). Rotterdam: Balkema. Ukpong, A. J. & Ekhalialu, O. M. (2017c). Evaluation of palaeo-oxygen conditions of Priabonian – Rupelian sediments of the Agbada Formation, Niger Delta based on Fisher’s diversity index and benthic foraminifera oxygen index. EPRA International Journal of Research and Development (IJRD), 2 (12): 65-80. Ukpong, A. J., Ekhalialu, O. M., Osung, W. E., & Omoko, E. N. (2018). Foraminiferal biozonation and biochronology of Priabonian – Repulian sediments of the Agbada Formation, Niger Delta. International Journal of Scientific and Research, 8 (1), 425-441. Ukpong, A. J., Ikediasor K. C., Anyanwu, T. C., Osung E. W., & Ekhalialu O. M. (2017a). Foraminiferal biozonation of “Well K-27”, greater ughelli depobelt, Niger Delta basin, South Eastern Nigeria. International Journal of Multidisciplinary Research, 3 (10), 23-32. Ukpong, A. J., Ikediasor, K.C., Ekhalialu, O. M., & Osung, E. W. (2017b). Sequene stratigraphic analysis of Well “X2” in the Niger Delta, Southeastern Nigeria. International Journal of Scientific and Technology Research, 6 (10), 342-351. Valchev, B. (2003). On the potential of small benthic foraminifera as paleoecological indicator: recent advances. 50 years University of Mining and Geology “St. Ivan Rilski” Annual, 46, Part I, Geology and Geophysics, 189-194. Van der Zwaan, G. J., Jorissen F. J., & de Stigter H. C. (1990). The depth dependency of planktonic / benthic foraminiferal ratios: Constraints and applications. Marine Geology, 95, 1-16. Weber, K. J., & Daukoru, E. M. (1975). Petroleum Geology of the Niger Delta. In Proceedings of the 9th World Petroleum Congress, Geology 2 (pp. 209-221). London: Applied Science Publishers Limited. Weber, K.J. (1971). Sedimentological aspects of oil fields in the Niger Delta. Geologie enMijnbouw 50, 559-576. Whiteman, A. (1982). Nigeria- its petroleum geology, resources and potential. London: Graham & Trotman. Wright, C. A. (1972). Foraminiferids from the London Clay at Lower Swanwick and their paleoecological interpretation. British Geology Association, 83 (3), 337- 348. Accepted 28 June 2018 Citation: Ukpong A.J, Ekhalialu O.M (2018). Application of Foraminiferal Study to Palaeoenvironmental Analysis of Priabonian – Rupelian Sediments of the Niger Delta, Nigeria. International Journal Geology and Mining 4(2): 165-178. Copyright: © 2018 Ukpong and Ekhalialu. This is an open- access article distributed under the terms of the Creative Commons Attribution License, which permits unrestricted use, distribution, and reproduction in any medium, provided the original author and source are cited.
- 12. Foraminiferal Approach to Palaeoenvironmental Interpretations: Case Study of Priabonian – Rupelian Sediments of the Niger Delta, Nigeria Ukpong and Ekhalialu 176 APPENDIX Table 1: Quantitative foraminifera distributions of well C Depth (m) M R TC BC A B P TFC %P %B %M %A %R %FOBC %FOBA T Pwd Α %F %O 2410-2440 0 3 3 3 0 3 0 3 0 100 0 0 100 100 0 0 36.13 0.6 100 0 2440-2470 0 5 5 5 0 5 0 5 0 100 0 0 100 100 0 0 36.13 1 100 0 2470-2500 0 37 37 37 0 37 0 37 0 100 0 0 100 100 0 0 36.51 2.6 100 0 2500-2530 0 9 9 9 0 9 1 9 11.11 88.89 0 0 100 100 0 9 53.51 1.6 100 0 2530-2560 0 4 4 4 0 4 0 4 0 100 0 0 100 100 0 0 36.13 0.6 100 0 2560-2590 0 0 0 0 0 0 0 0 0 0 0 0 0 0 0 0 0 0 100 0 2590-2620 0 6 6 6 0 6 0 6 0 100 0 0 100 100 0 0 36.13 1.4 75 25 2620-2650 0 0 0 0 0 0 0 0 0 0 0 0 0 0 0 0 0 0 100 0 2650-2680 0 6 6 6 0 6 0 6 0 100 0 0 100 100 0 0 36.13 1 100 0 2680-2710 1 11 12 12 1 13 0 13 0 100 7.69 7.69 84.62 92.31 7.69 0 36.13 1.8 100 0 2710-2740 0 4 4 4 0 4 0 4 0 100 0 0 100 91.67 8.33 0 36.13 0.6 100 0 2740-2770 1 10 11 10 1 11 1 12 8.33 91.67 8.33 8.33 83.33 90.91 9.09 11 48.50 1.8 92.31 7.69 2770-2800 0 53 53 53 5 58 0 58 0 100 0 8.62 91.38 91.38 8.62 0 36.13 3 100 0 Keys: M=Miliolina/Porcelaneous , R= Rotaliina/Hyaline, TC= Total calcerous, BC = Calcerous benthic, A= Textulariina/Arenaceous, B=Benthic, P=Planktic, TFC=Total foraminifera count, %P= percentage of planktic, %B= percentage of benthic, %M= percentage of Miliolina, %A= percentage of Arenaceous, %R= percentage of Rotaliina, %FOBC= percentage of Benthic Calcerous Foraminifera, %FOBA= percentage of Benthic Arenaceous Foraminifera, T = Tau index, Pwd=Palaeowater depth, P/B ratio= Plantkic/Benthics ratio, α= Fisher diversity index,% F/O = percentage of Foraminifera to Ostracoda ratio. Application of Foraminiferal Study to Palaeoenvironmental Analysis of Priabonian – Rupelian Sediments of the Niger Delta, Nigeria
- 13. Foraminiferal Approach to Palaeoenvironmental Interpretations: Case Study of Priabonian – Rupelian Sediments of the Niger Delta, Nigeria Int. J. Geol. Min. 177 Table 2: Quantitative foraminifera distribution of well F. Depth (m) M R TC BC A B P TFC %P %B %M %A %R %FOBC %FOBA T- Pwd α %F %O index 2000-2020 0 1 1 1 0 1 0 1 0 100 0 0 100 100 0 0 36.13 0.2 100 0 2020-2040 0 0 0 0 0 0 0 0 0 0 0 0 0 0 0 0 0 0 0 0 2040-2060 0 0 0 0 0 0 0 0 0 0 0 0 0 0 0 0 0 0 0 0 2060-2080 0 0 0 0 0 0 0 0 0 0 0 0 0 0 0 0 0 0 0 0 2080-2100 0 0 0 0 0 0 0 0 0 0 0 0 0 0 0 0 0 0 0 0 2100-2120 0 0 0 0 0 0 0 0 0 0 0 0 0 0 0 0 0 0 0 0 2120-2140 0 0 0 0 0 0 0 0 0 0 0 0 0 0 0 0 0 0 0 0 2140-2160 0 0 0 0 0 0 0 0 0 0 0 0 0 0 0 0 0 0 0 0 2160-2180 0 0 0 0 0 0 0 0 0 0 0 0 0 0 0 0 0 0 0 0 2180-2200 0 0 0 0 0 0 0 0 0 0 0 0 0 0 0 0 0 0 0 0 2200-2220 0 0 0 0 0 0 0 0 0 0 0 0 0 0 0 0 0 0 0 0 2220-2240 0 0 0 0 0 0 0 0 0 0 0 0 0 0 0 0 0 0 0 0 2240-2260 0 0 0 0 0 0 0 0 0 0 0 0 0 0 0 0 0 0 0 0 2260-2280 0 77 77 77 1 78 0 78 0 100 0 1.28 98.72 98.72 1.28 0 36.13 5 93.98 6.02 2280-2300 0 43 43 43 0 43 0 43 0 100 0 0 100 100 0 0 36.13 5 100 0 2300-2320 0 4 4 3 0 3 1 4 25 75 0 0 100 100 0 3 87.42 1 80 20 2320-2340 0 4 4 4 0 4 0 4 0 100 0 0 100 100 0 0 36.13 0.4 100 0 2340-2360 0 62 62 62 0 62 0 62 0 100 0 0 100 100 0 0 36.13 2.8 95.39 4.61 2360-2380 0 118 118 114 0 114 4 118 3.39 96.61 0 0 100 100 0 456 40.73 8 100 0 2380-2400 0 44 44 43 1 44 1 45 6.67 93.33 0 2.23 97.78 97.28 2.22 44 45.74 6 100 0 2400-2420 0 1 1 1 0 1 0 1 0 100 0 0 100 100 0 0 36.13 0.2 100 0 2420-2440 0 26 26 22 0 22 4 26 15.38 84.62 0 0 100 100 0 96 62.22 5 100 0 2440-2460 0 14 14 14 1 15 0 15 0 100 0 6.67 93.33 93.33 6.67 0 36.13 2 100 0 2460-2480 0 10 10 10 0 10 0 10 0 100 0 0 100 100 0 0 36.13 1.8 100 0 2480-2500 0 14 14 14 1 15 0 15 0 100 0 6.67 93.33 93.33 6.67 0 36.13 2 100 0 2500-2520 0 170 170 169 1 170 1 171 0.85 99.4 0 0.58 99.4 99.42 0.58 170 36.88 3.6 93.44 6.55 2520-2540 0 297 297 278 19 307 9 316 2.85 97.15 0 6.61 94.30 93.99 6.01 27.63 39.96 16 96.04 3.96 2540-2560 0 27 27 27 2 29 0 29 0 100 0 6.90 93.10 93.60 6.40 0 36.13 4 100 0 2560-2580 0 12 12 12 4 16 0 16 0 100 0 25 75 75 25 0 36.13 3 100 0 2580-2600 0 17 17 17 3 20 0 20 0 100 0 15 85 85 15 0 36.13 3 95.34 4.76 2600-2620 0 51 51 50 1 51 1 52 1.89 98.11 0 1.95 98.08 98 2 52 40.64 8 98.07 1.92 2620-2640 0 30 30 30 0 30 0 30 0 100 0 0 100 100 0 0 36.13 4.6 100 0 2640-2660 0 25 25 24 1 26 0 26 0 100 0 3.85 96.15 96 4 0 36.13 3.6 100 0 2660-2680 0 26 26 26 0 26 0 26 0 100 0 0 100 100 0 0 36.13 5 74:28 25.72 2680-2700 0 56 56 56 0 56 0 56 0 100 0 0 100 100 0 0 36.13 7.8 100 0 Keys: M=Miliolina/Porcelaneous , R= Rotaliina/Hyaline, TC= Total calcerous, A= Textulariina/Arenaceous, BC = Calcerous benthic, B=Benthic, P=Planktic, TFC=Total foraminifera count, %P= percentage of planktic, %B= percentage of benthic, %M= percentage of Miliolina, %A= percentage of Arenaceous, %R= percentage of Rotaliina, %FOBC= percentage of Benthic Calcerous Foraminifera, %FOBA= percentage of Benthic Arenaceous Foraminifera, T = Tau index, Pwd=Palaeowater depth, α= Fisher diversity index, %F/O = percentage of Foraminifera to Ostracoda ratio.
- 14. Foraminiferal Approach to Palaeoenvironmental Interpretations: Case Study of Priabonian – Rupelian Sediments of the Niger Delta, Nigeria Ukpong and Ekhalialu 178 Table 2 cont. Depth (m) M R TC BC A B P TFC %P %B %M %A %R %FOBC %FOBA T- Pwd α %F %O index 2700-2720 0 18 18 17 0 17 1 18 5.80 94.20 0 0 100 100 0 32 53.51 3.2 90 10 2720-2740 0 44 44 40 2 42 4 46 10.87 89.14 0 4.35 95.65 95.22 4.88 220 53.03 7.8 97.87 2.13 2740-2760 2 18 20 20 0 20 0 20 0 100 10 0 90 100 0 0 36.13 3.2 97.87 2.13 2760-2780 0 4 4 4 0 4 0 4 0 100 0 0 100 100 0 0 36.13 1 89.74 11.26 2780-2800 0 8 8 8 0 8 0 8 0 100 0 0 100 100 0 0 36.13 1.8 100 0 2800-2820 0 1 1 1 0 1 0 1 0 100 0 0 100 100 0 0 36.13 0.2 100 0 2820-2840 0 10 10 10 0 10 0 10 0 100 0 0 100 100 0 0 36.13 2 100 0 2840-2860 0 35 35 35 0 35 0 35 0 100 0 0 100 100 0 0 36.13 2 100 0 2860-2880 0 0 0 0 0 0 0 0 0 0 0 0 0 0 0 0 0 0 100 0 2880-2900 0 4 4 4 0 4 0 4 0 100 0 0 100 100 0 0 36.13 1 100 0 2900-2920 0 1 1 1 0 1 0 1 0 100 0 0 100 100 0 0 36.13 0.2 100 0 2920-2940 0 9 9 9 0 9 0 9 0 100 0 0 100 100 0 0 36.13 1.6 100 0 2940-2960 0 21 21 21 0 21 0 21 0 100 0 0 100 100 0 0 36.13 1.8 95.45 4.55 2960-2980 0 17 17 17 0 17 0 17 0 100 0 0 100 100 0 0 36.13 1.8 89.47 10.53 2980-3000 0 18 18 18 0 18 0 18 0 100 0 0 100 100 0 0 36.13 1 100 0 3000-3020 0 35 35 35 0 35 0 35 0 100 0 0 100 100 0 0 36.13 2 100 0 3020-3040 0 42 42 42 0 42 0 42 0 100 0 0 100 100 0 0 36.13 3.6 100 0 3040-3060 0 43 43 43 0 43 0 43 0 100 0 0 100 100 0 0 36.13 5.4 100 0 3060-3080 0 36 36 36 0 36 0 36 0 100 0 0 100 100 0 0 36.13 3 100 0 3080-3100 0 12 12 12 0 12 0 12 0 100 0 0 100 100 0 0 36.13 1.6 100 0 3100-3120 1 76 77 77 0 77 0 77 0 100 1.29 0 98.70 100 0 0 36.13 3.6 97.47 2.53 3120-3140 0 37 37 37 0 37 0 37 0 100 0 0 100 100 0 0 36.13 3.6 94.87 5.13 3140-3160 0 5 5 5 0 5 0 5 0 100 0 0 100 100 0 0 36.13 1 83.33 17.67 3160-3180 0 14 14 14 0 14 0 14 0 100 0 0 100 100 0 0 36.13 1.6 100 0 3180-3200 0 24 24 24 0 24 0 24 0 100 0 0 100 100 0 0 36.13 2 100 0 3200-3220 0 1 1 1 0 1 0 1 0 100 0 0 100 100 0 0 36.13 0.2 100 0 3220-3240 0 18 18 18 0 18 0 18 0 100 0 0 100 100 0 0 36.13 1.6 100 0 3240-3260 0 7 7 7 0 7 0 7 0 100 0 0 100 100 0 0 36.13 0.6 100 0 3260-3280 0 7 7 7 0 7 0 7 0 100 0 0 100 100 0 0 36.13 0.6 100 0 3280-3300 0 4 4 4 0 4 0 4 0 100 0 0 100 100 0 0 36.13 0.6 100 0 3300-3320 0 4 4 4 0 4 0 4 0 100 0 0 100 100 0 0 36.13 1 100 0 3320-3340 0 10 10 10 0 10 0 10 0 100 0 0 100 100 0 9 36.13 2 100 0 Keys: M=Miliolina/Porcelaneous , R= Rotaliina/Hyaline, TC= Total calcerous, BC = Calcerous benthic, A= Textulariina/Arenaceous, B=Benthic, P=Planktic, TFC=Total foraminifera count, %P= percentage of planktic, %B= percentage of benthic, %M= percentage of Miliolina, %A= percentage of Arenaceous, %R= percentage of Rotaliina, %FOBC= percentage of Benthic Calcerous Foraminifera, %FOBA= percentage of Benthic Arenaceous Foraminifera, T = Tau index, Pwd=Palaeowater depth, α= Fisher diversity index, %F/O = Foraminifera to Ostracoda ratio.