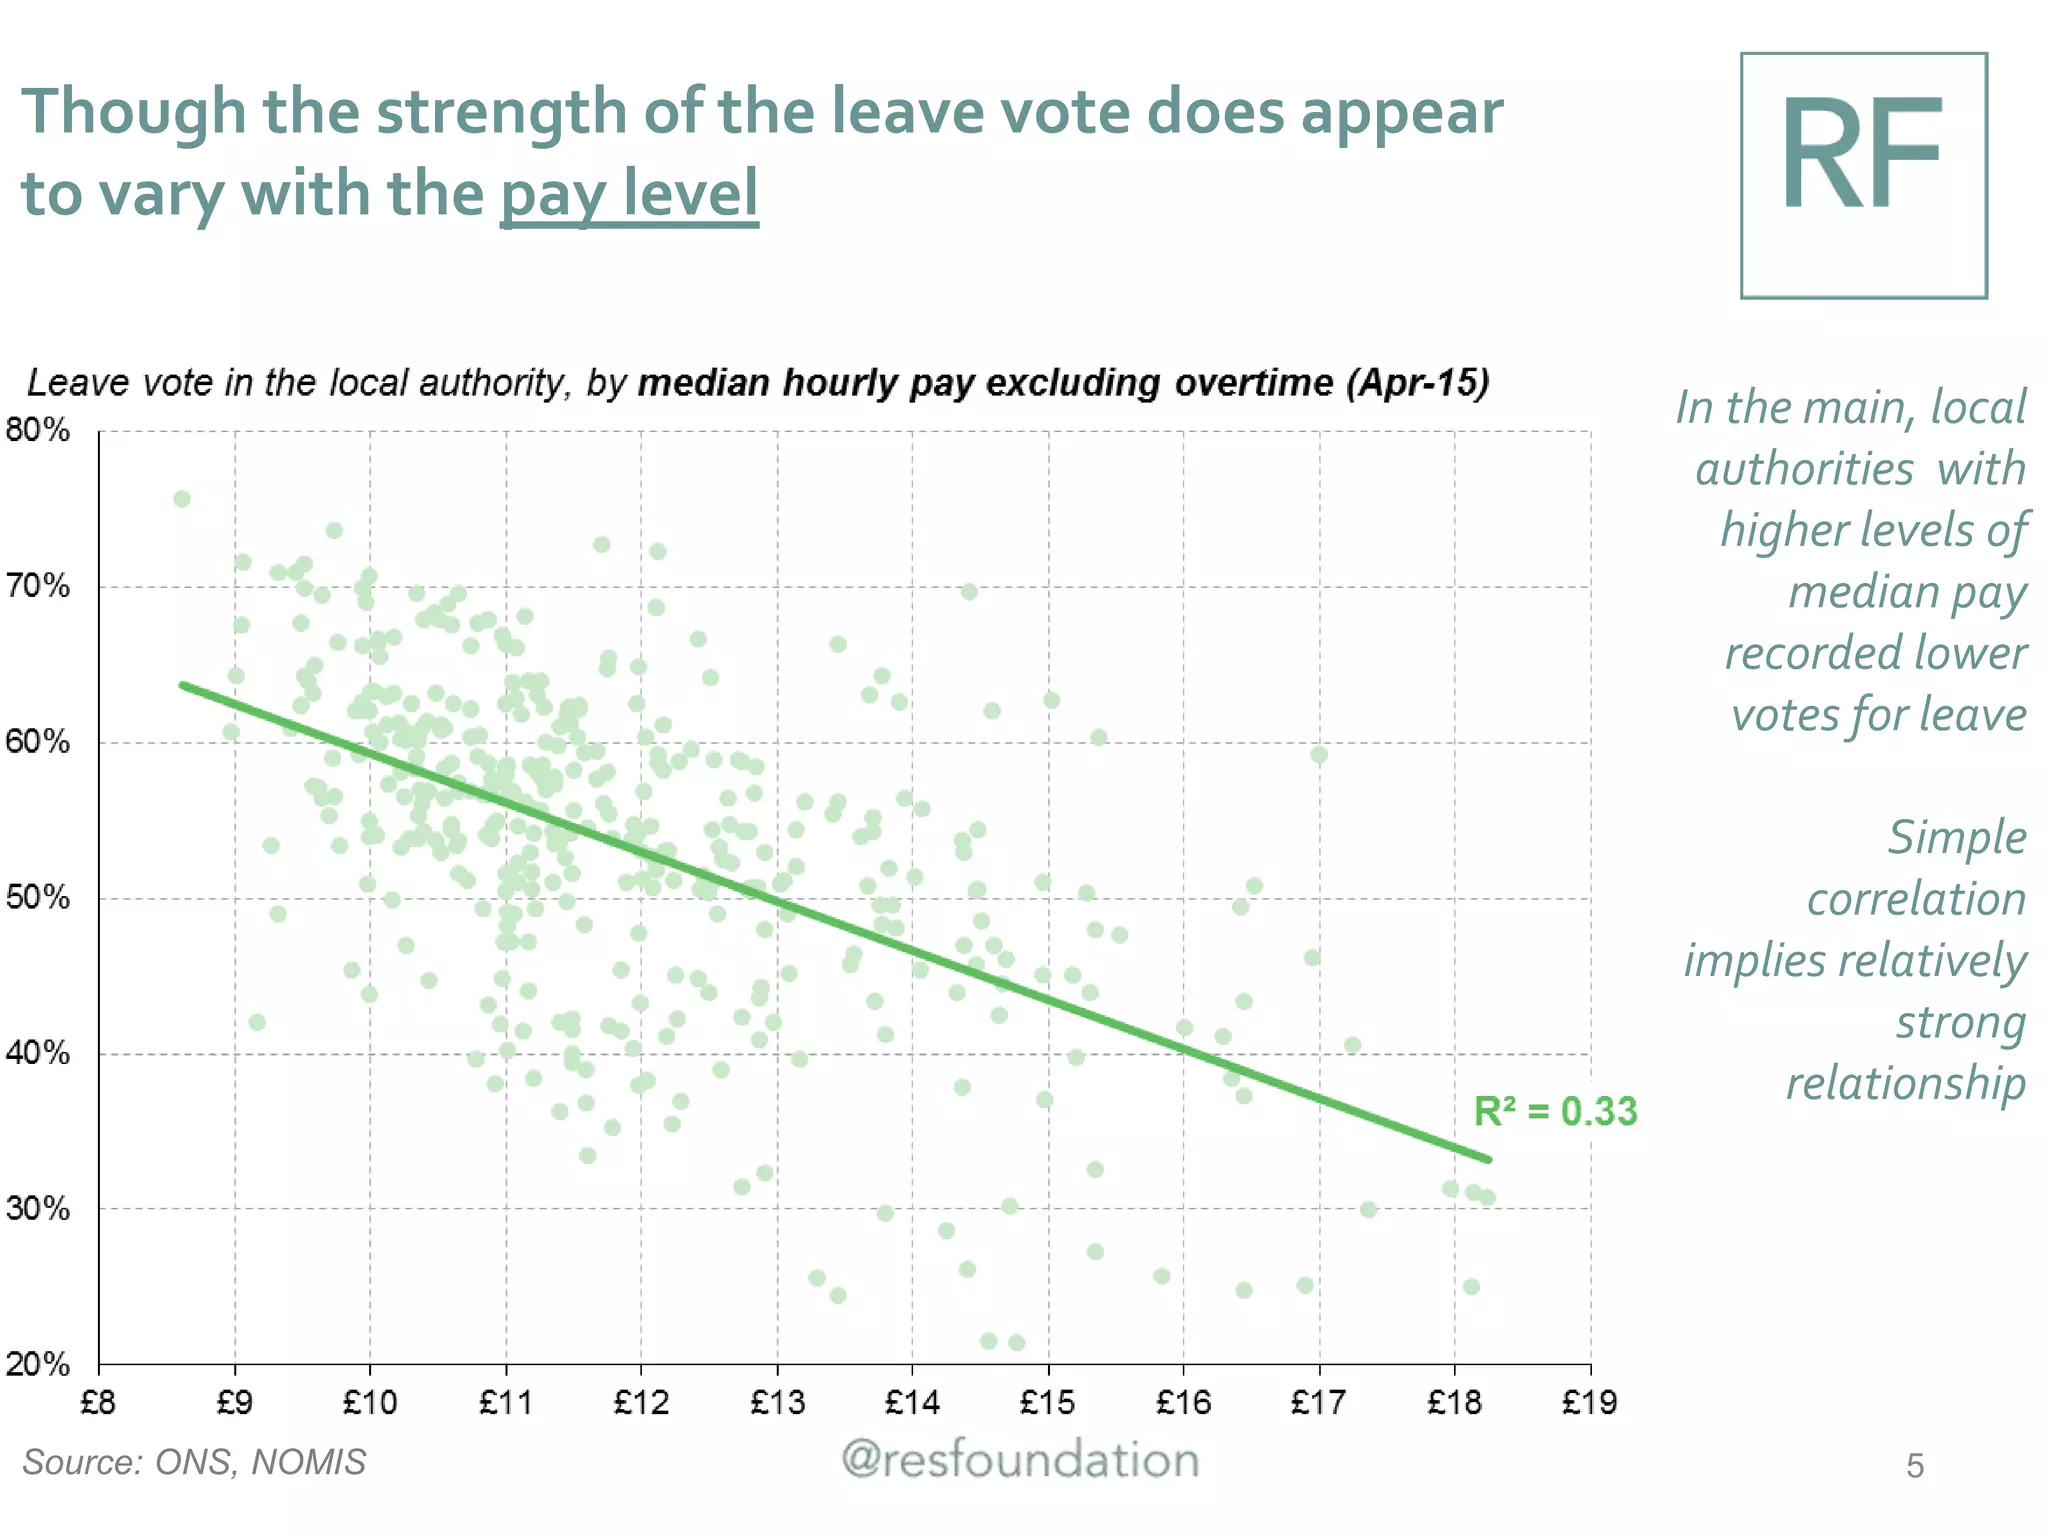
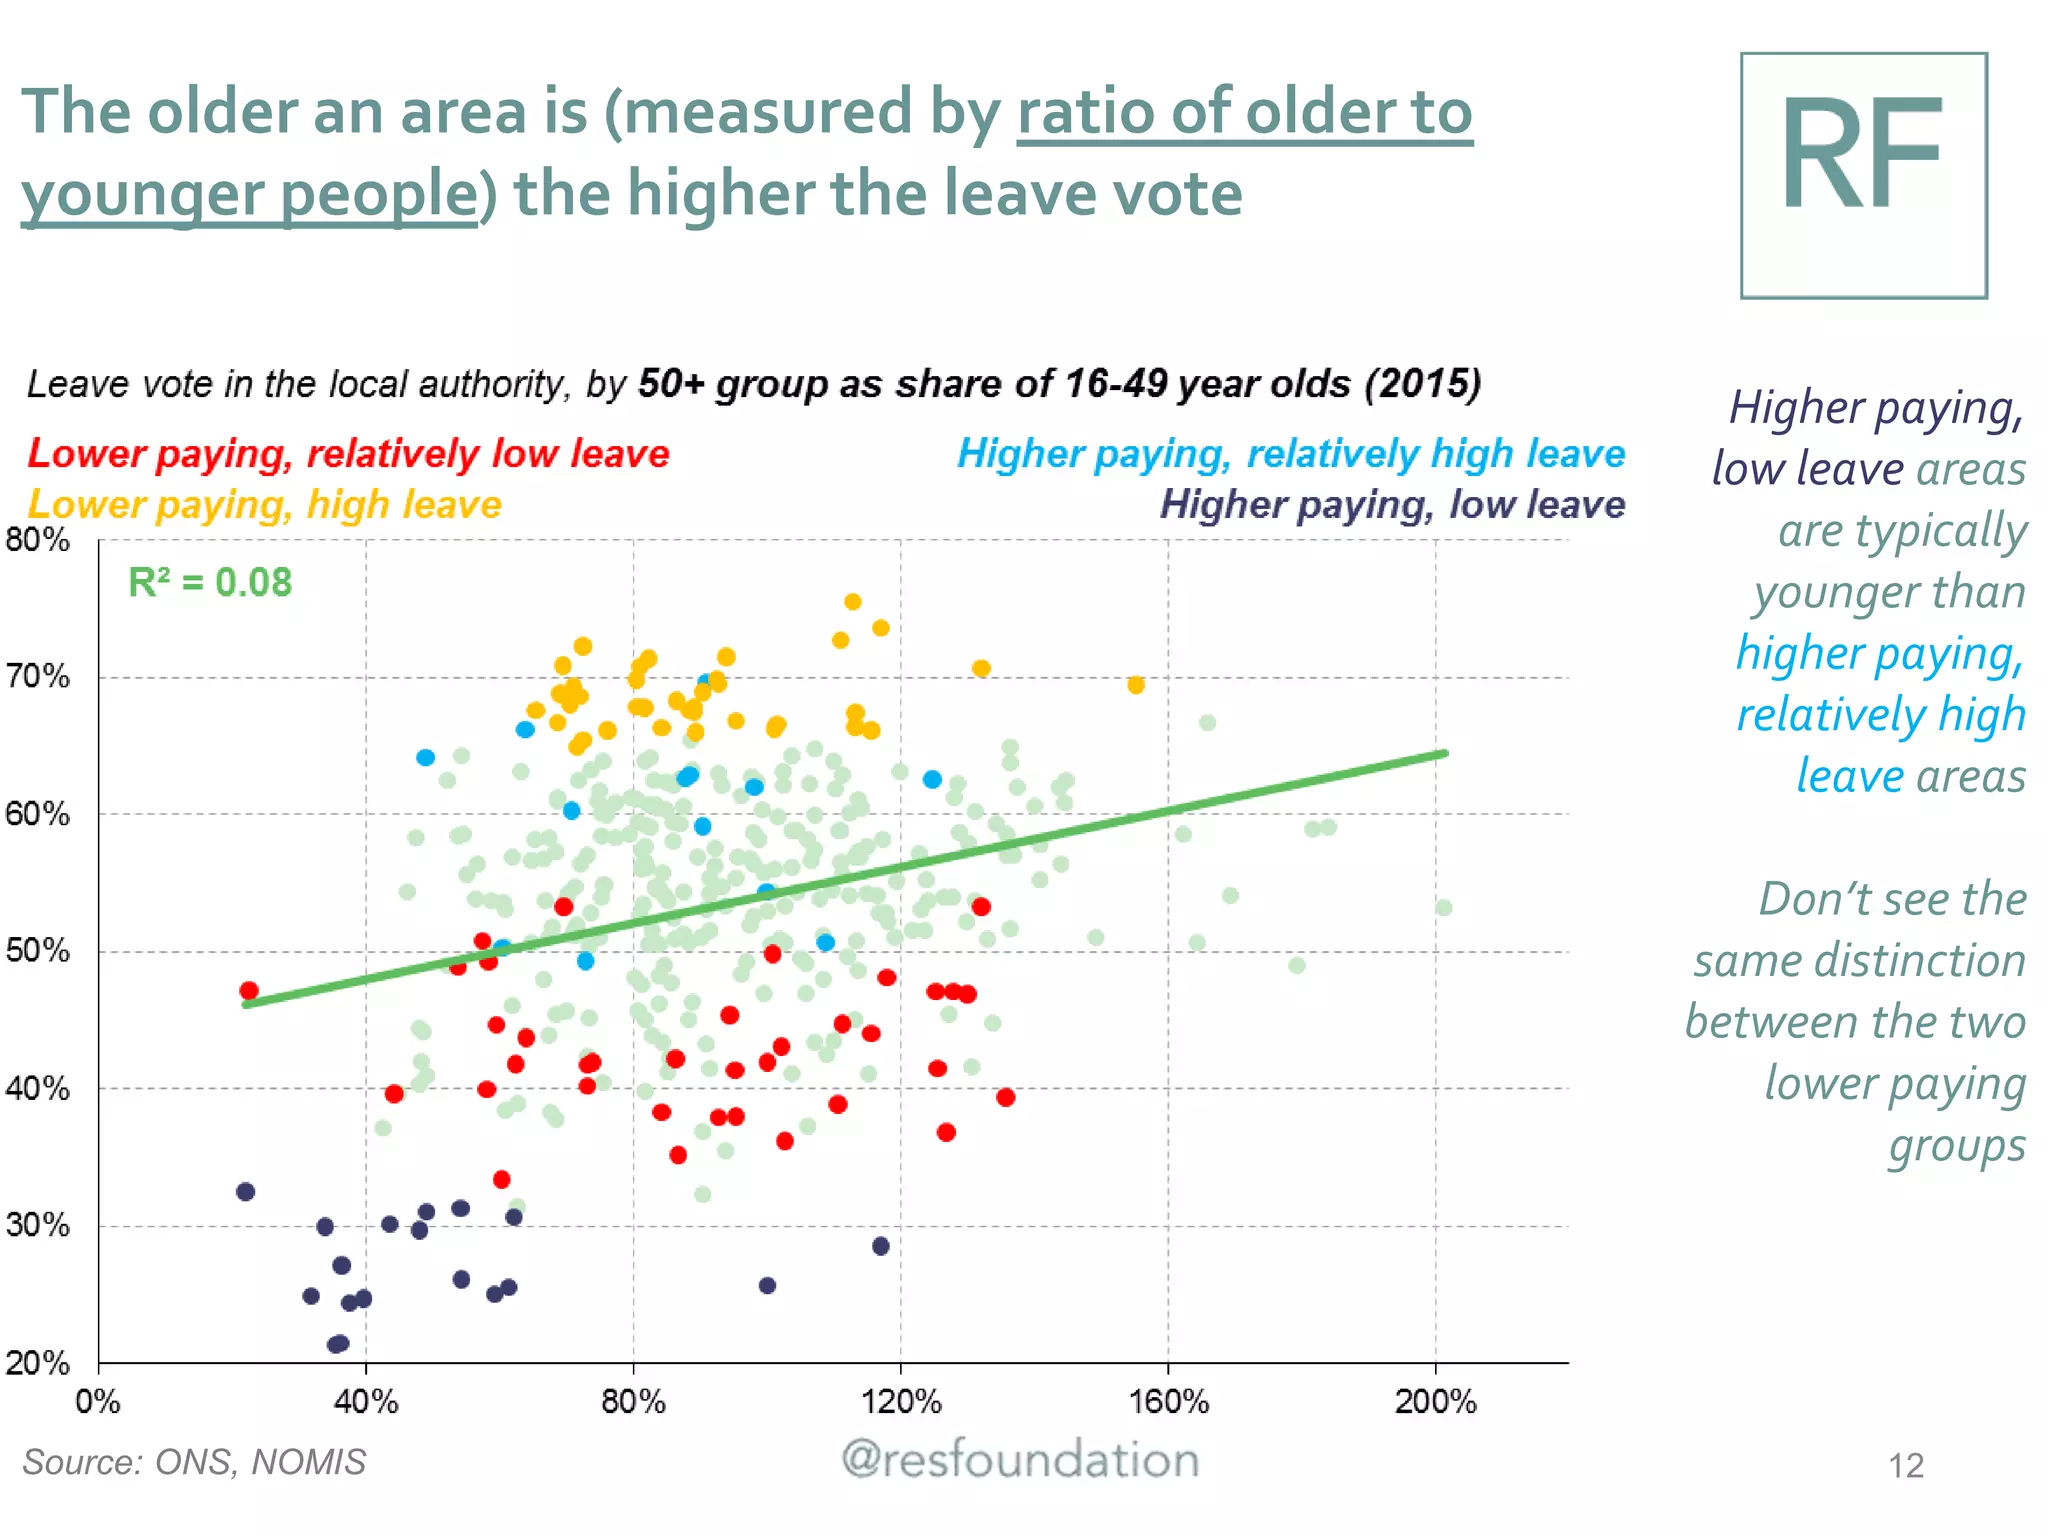
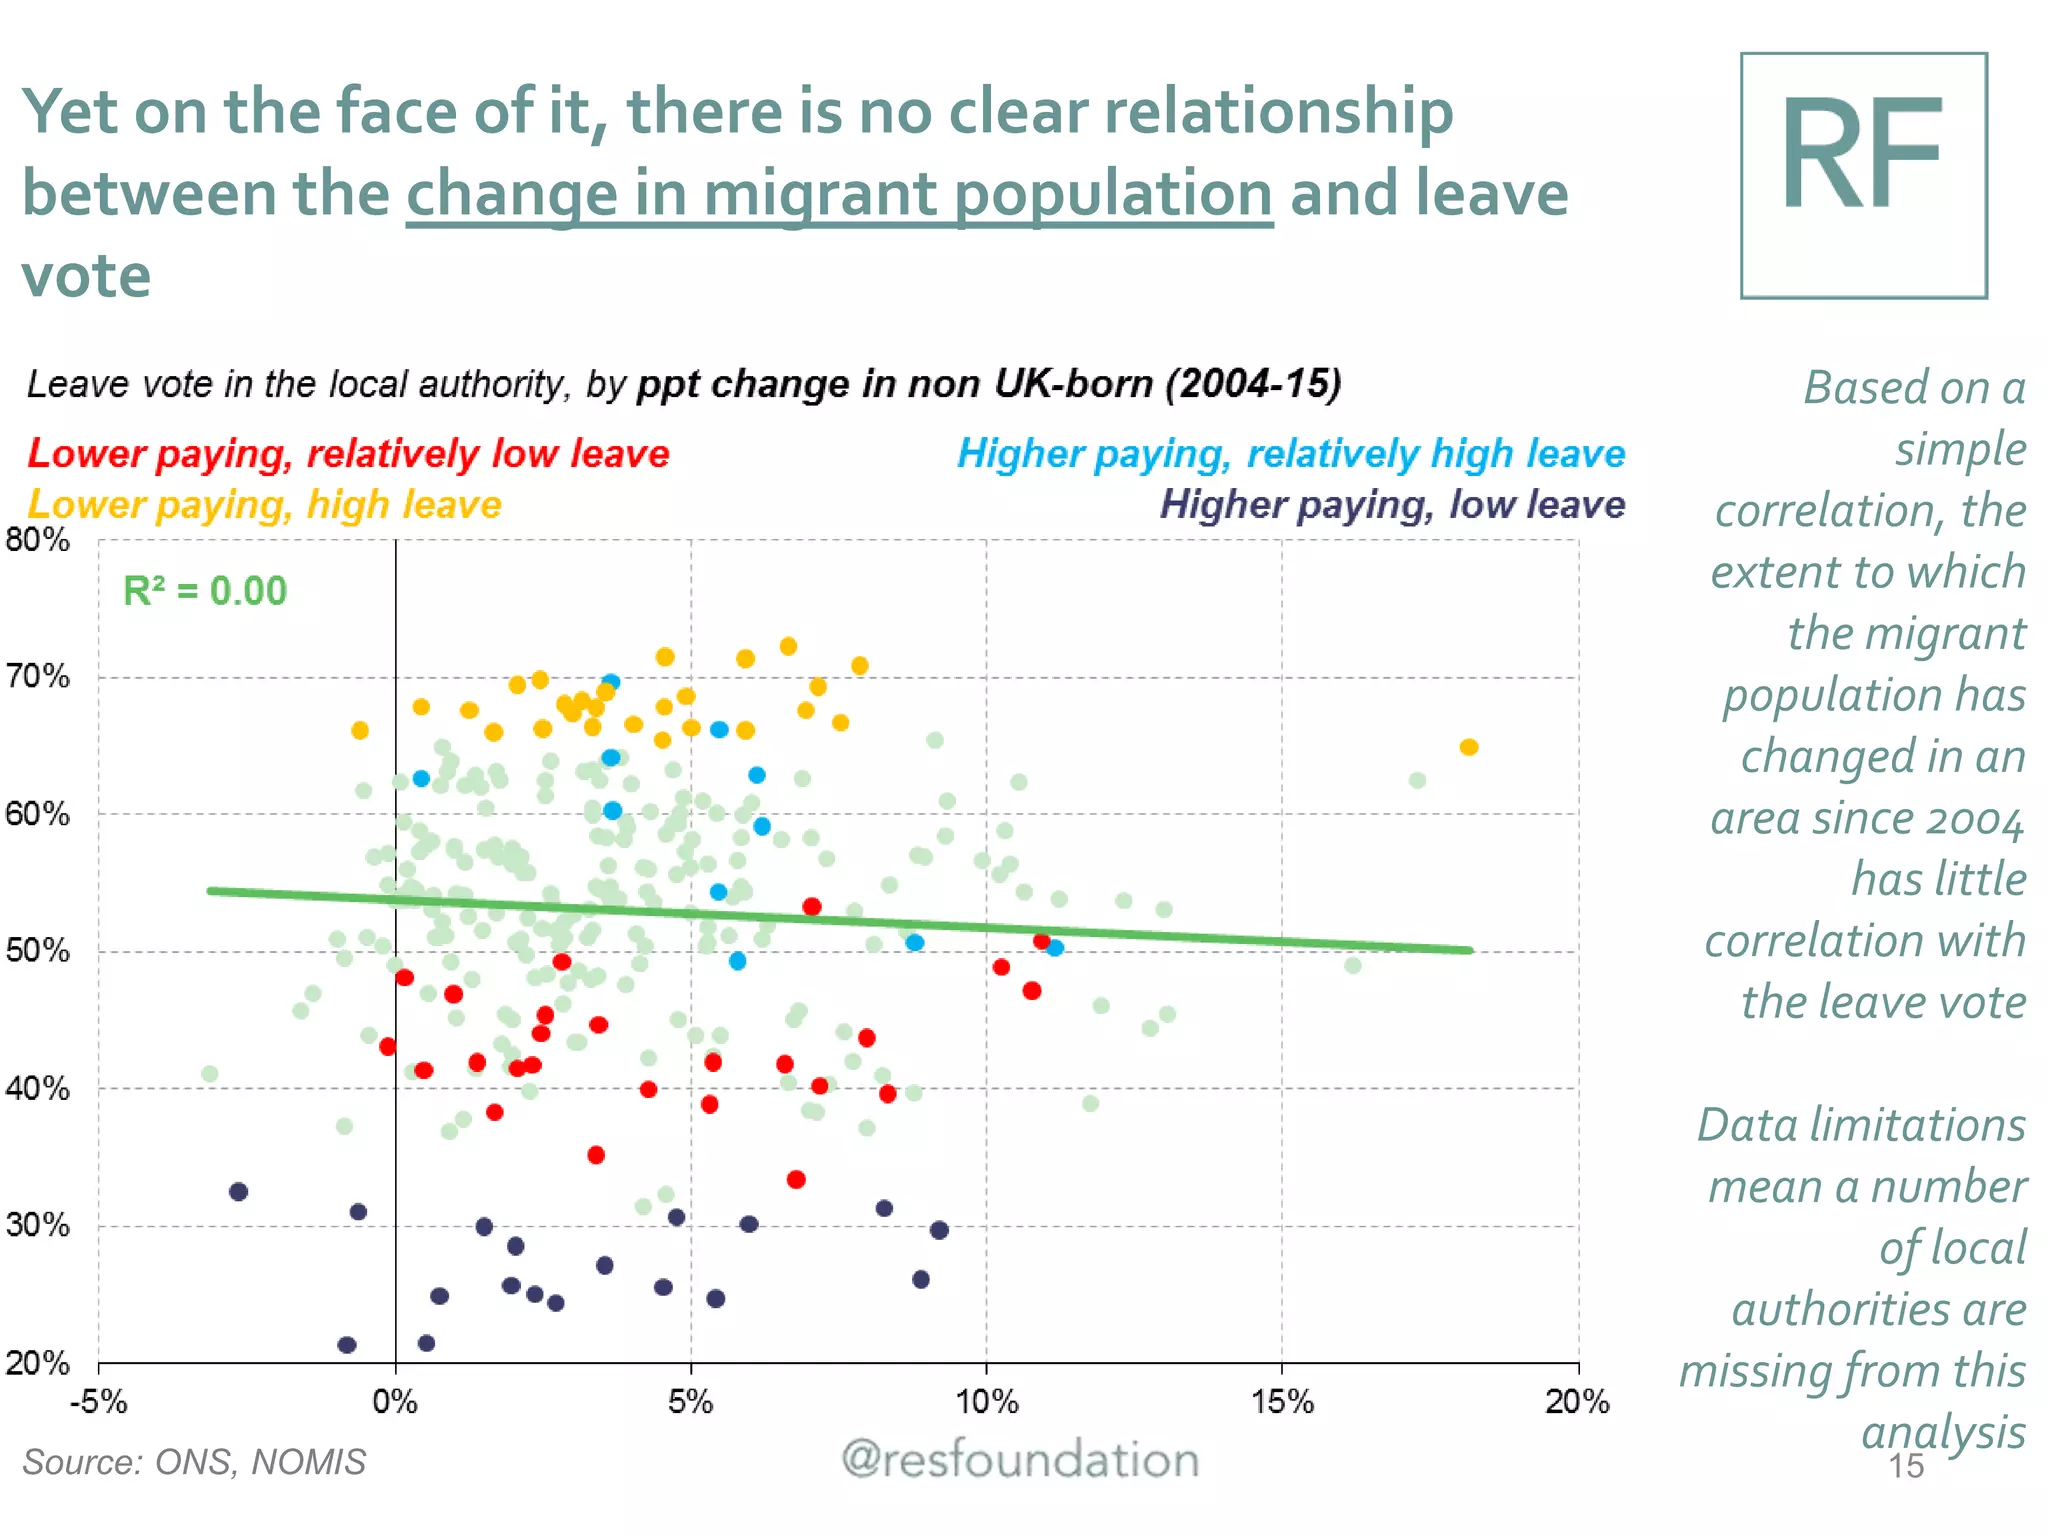
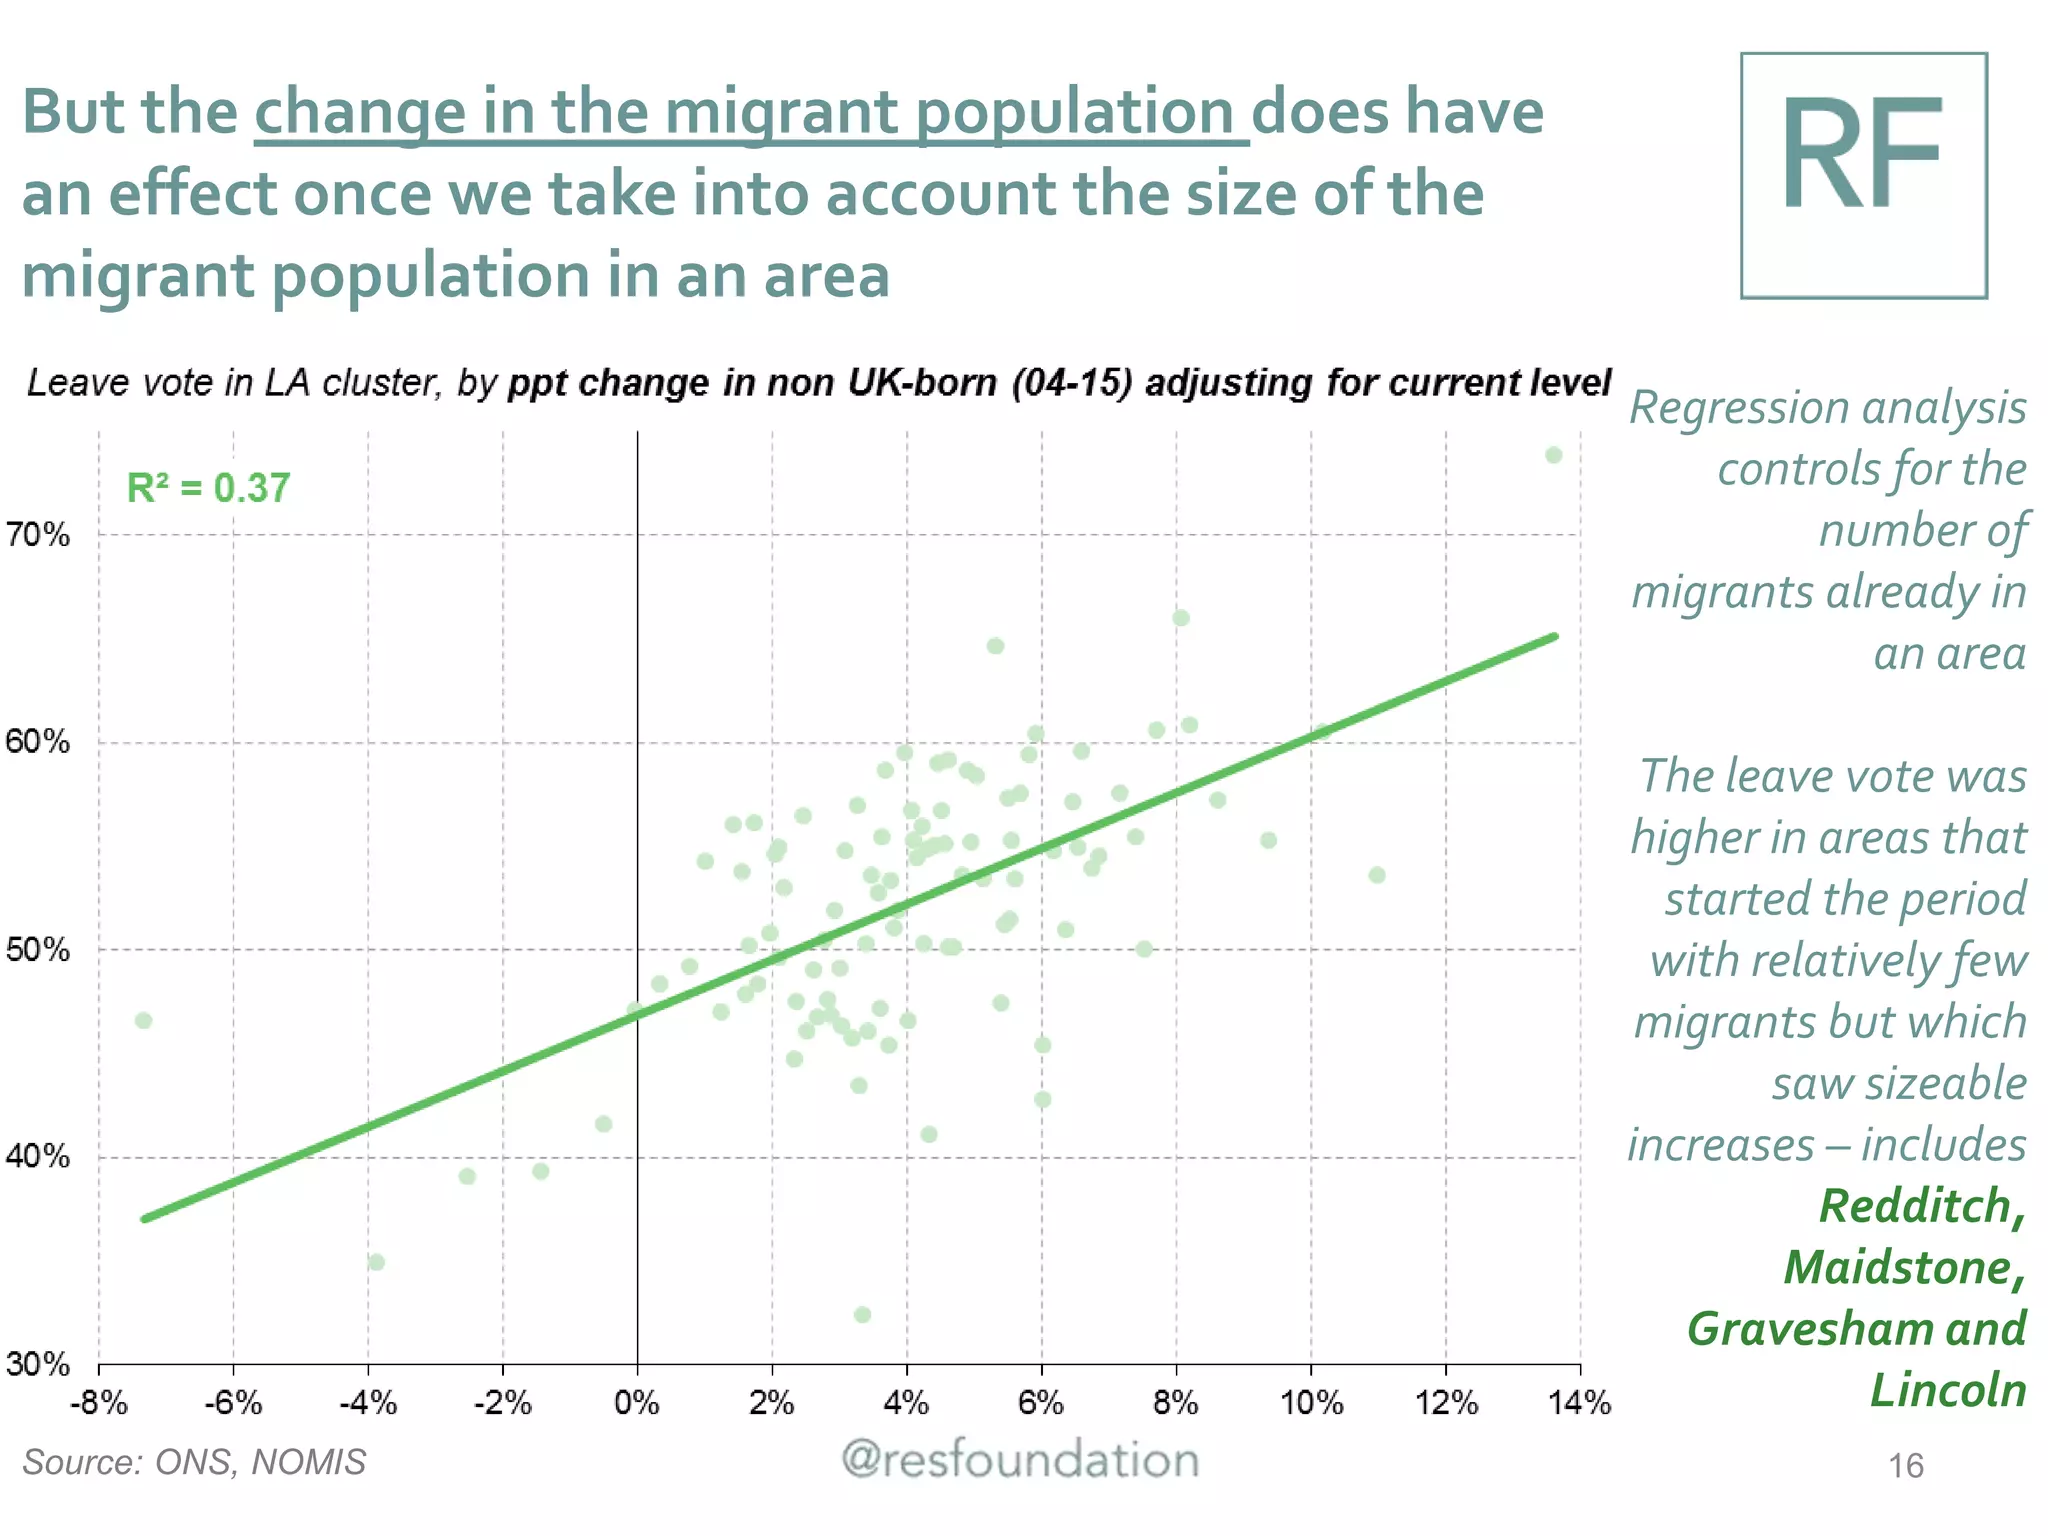
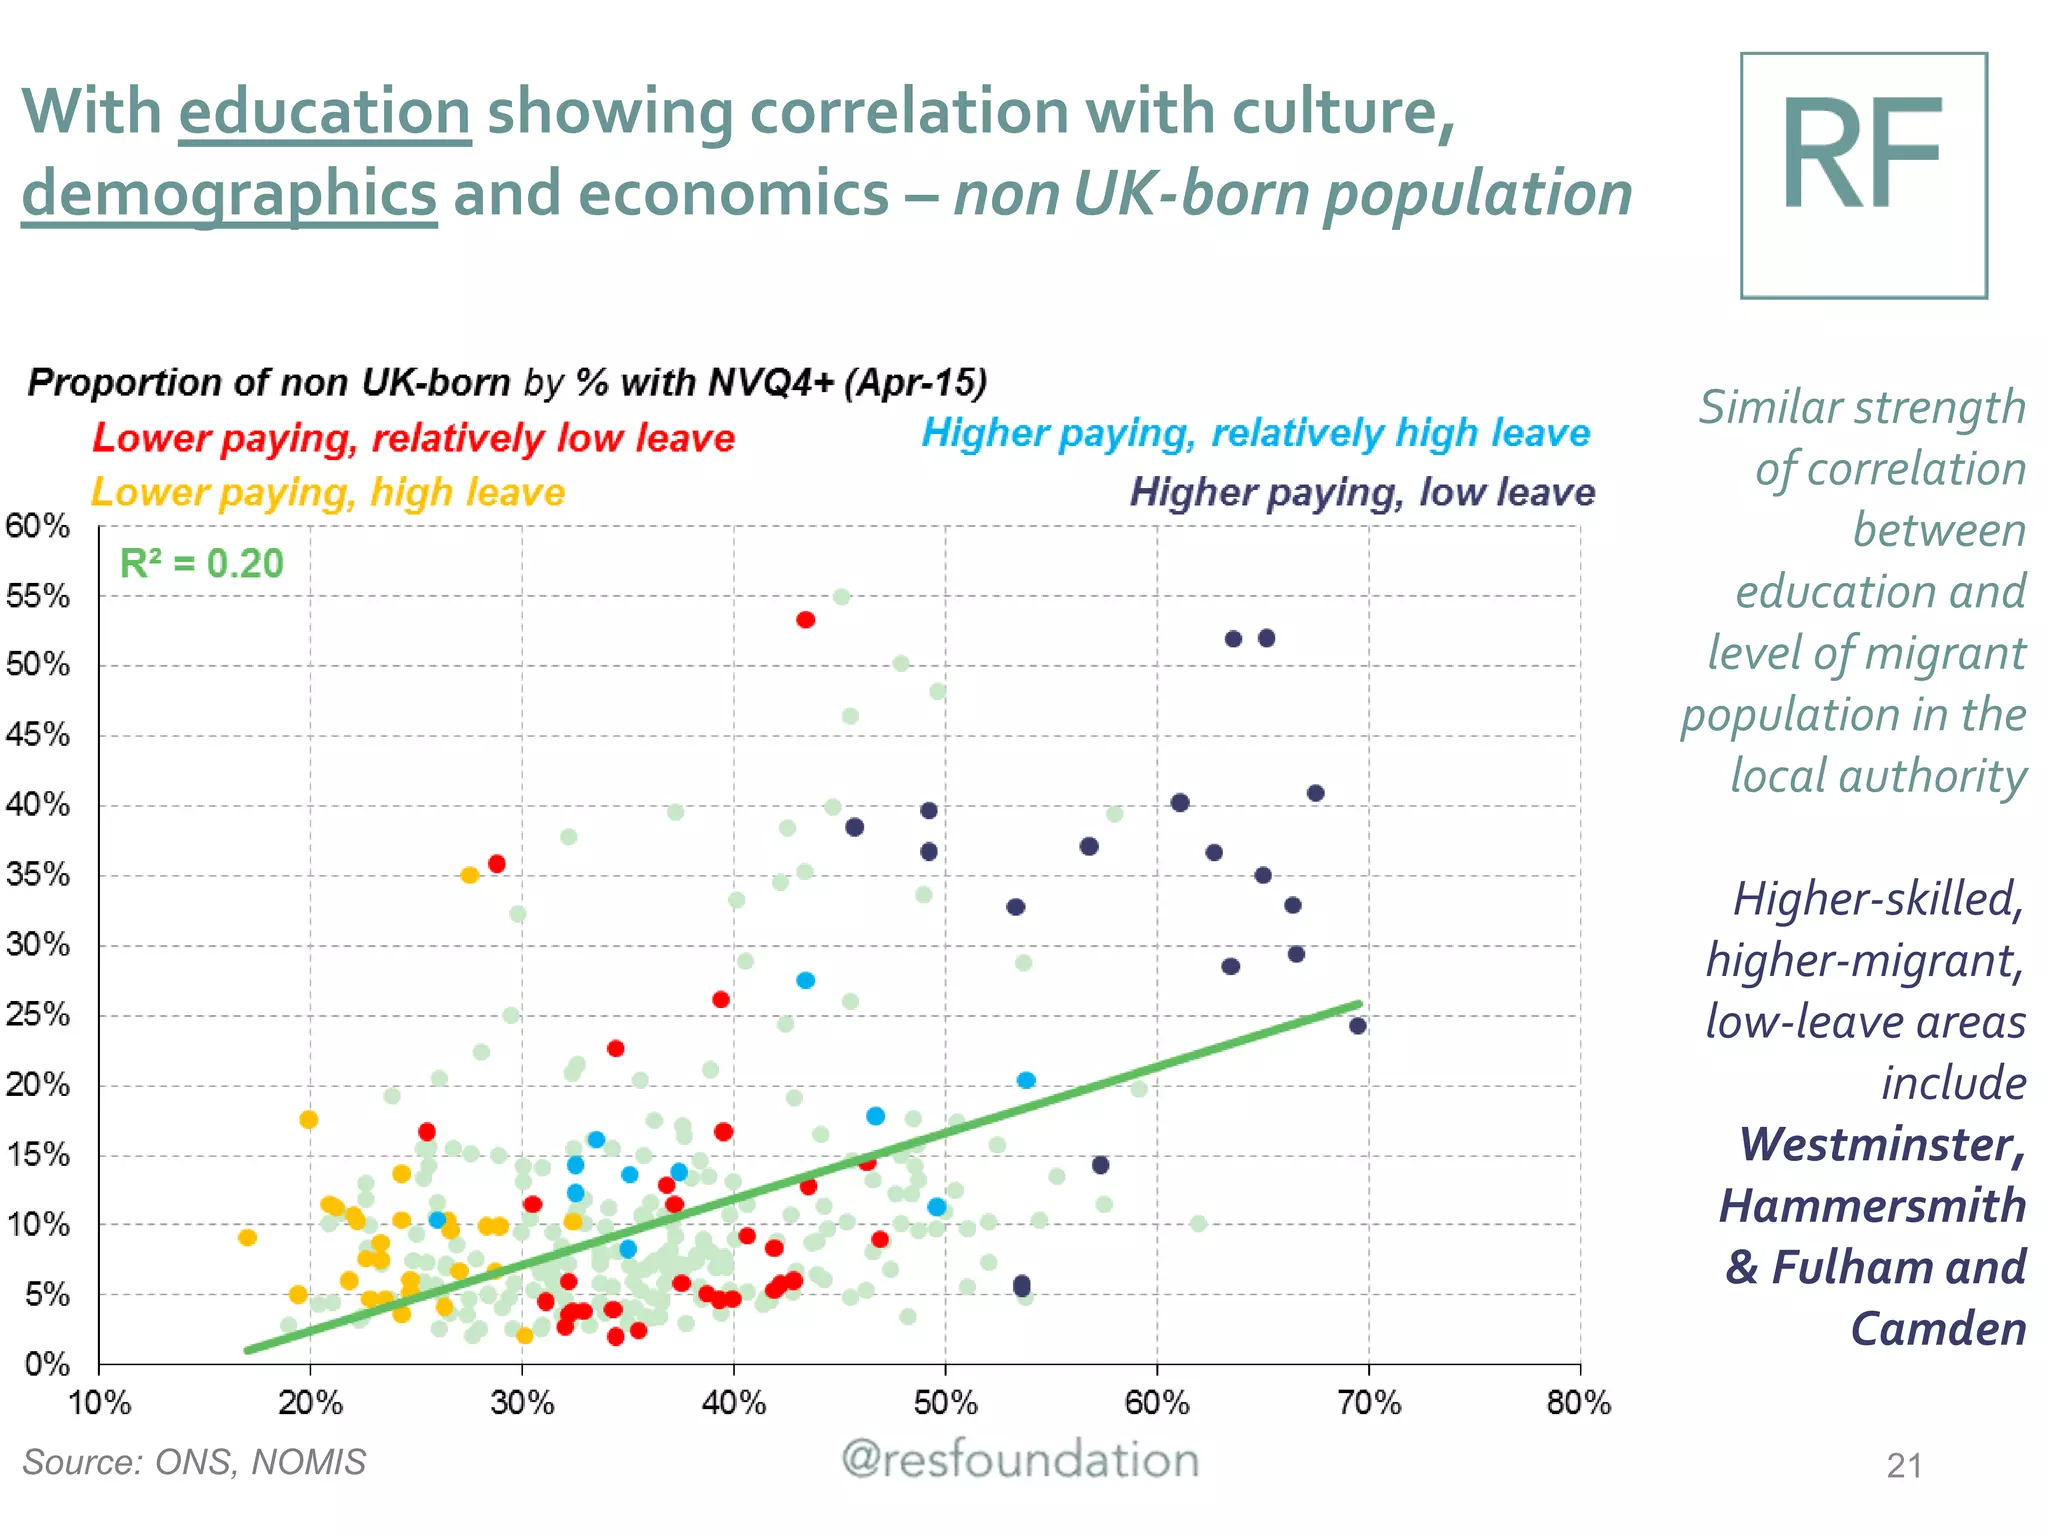
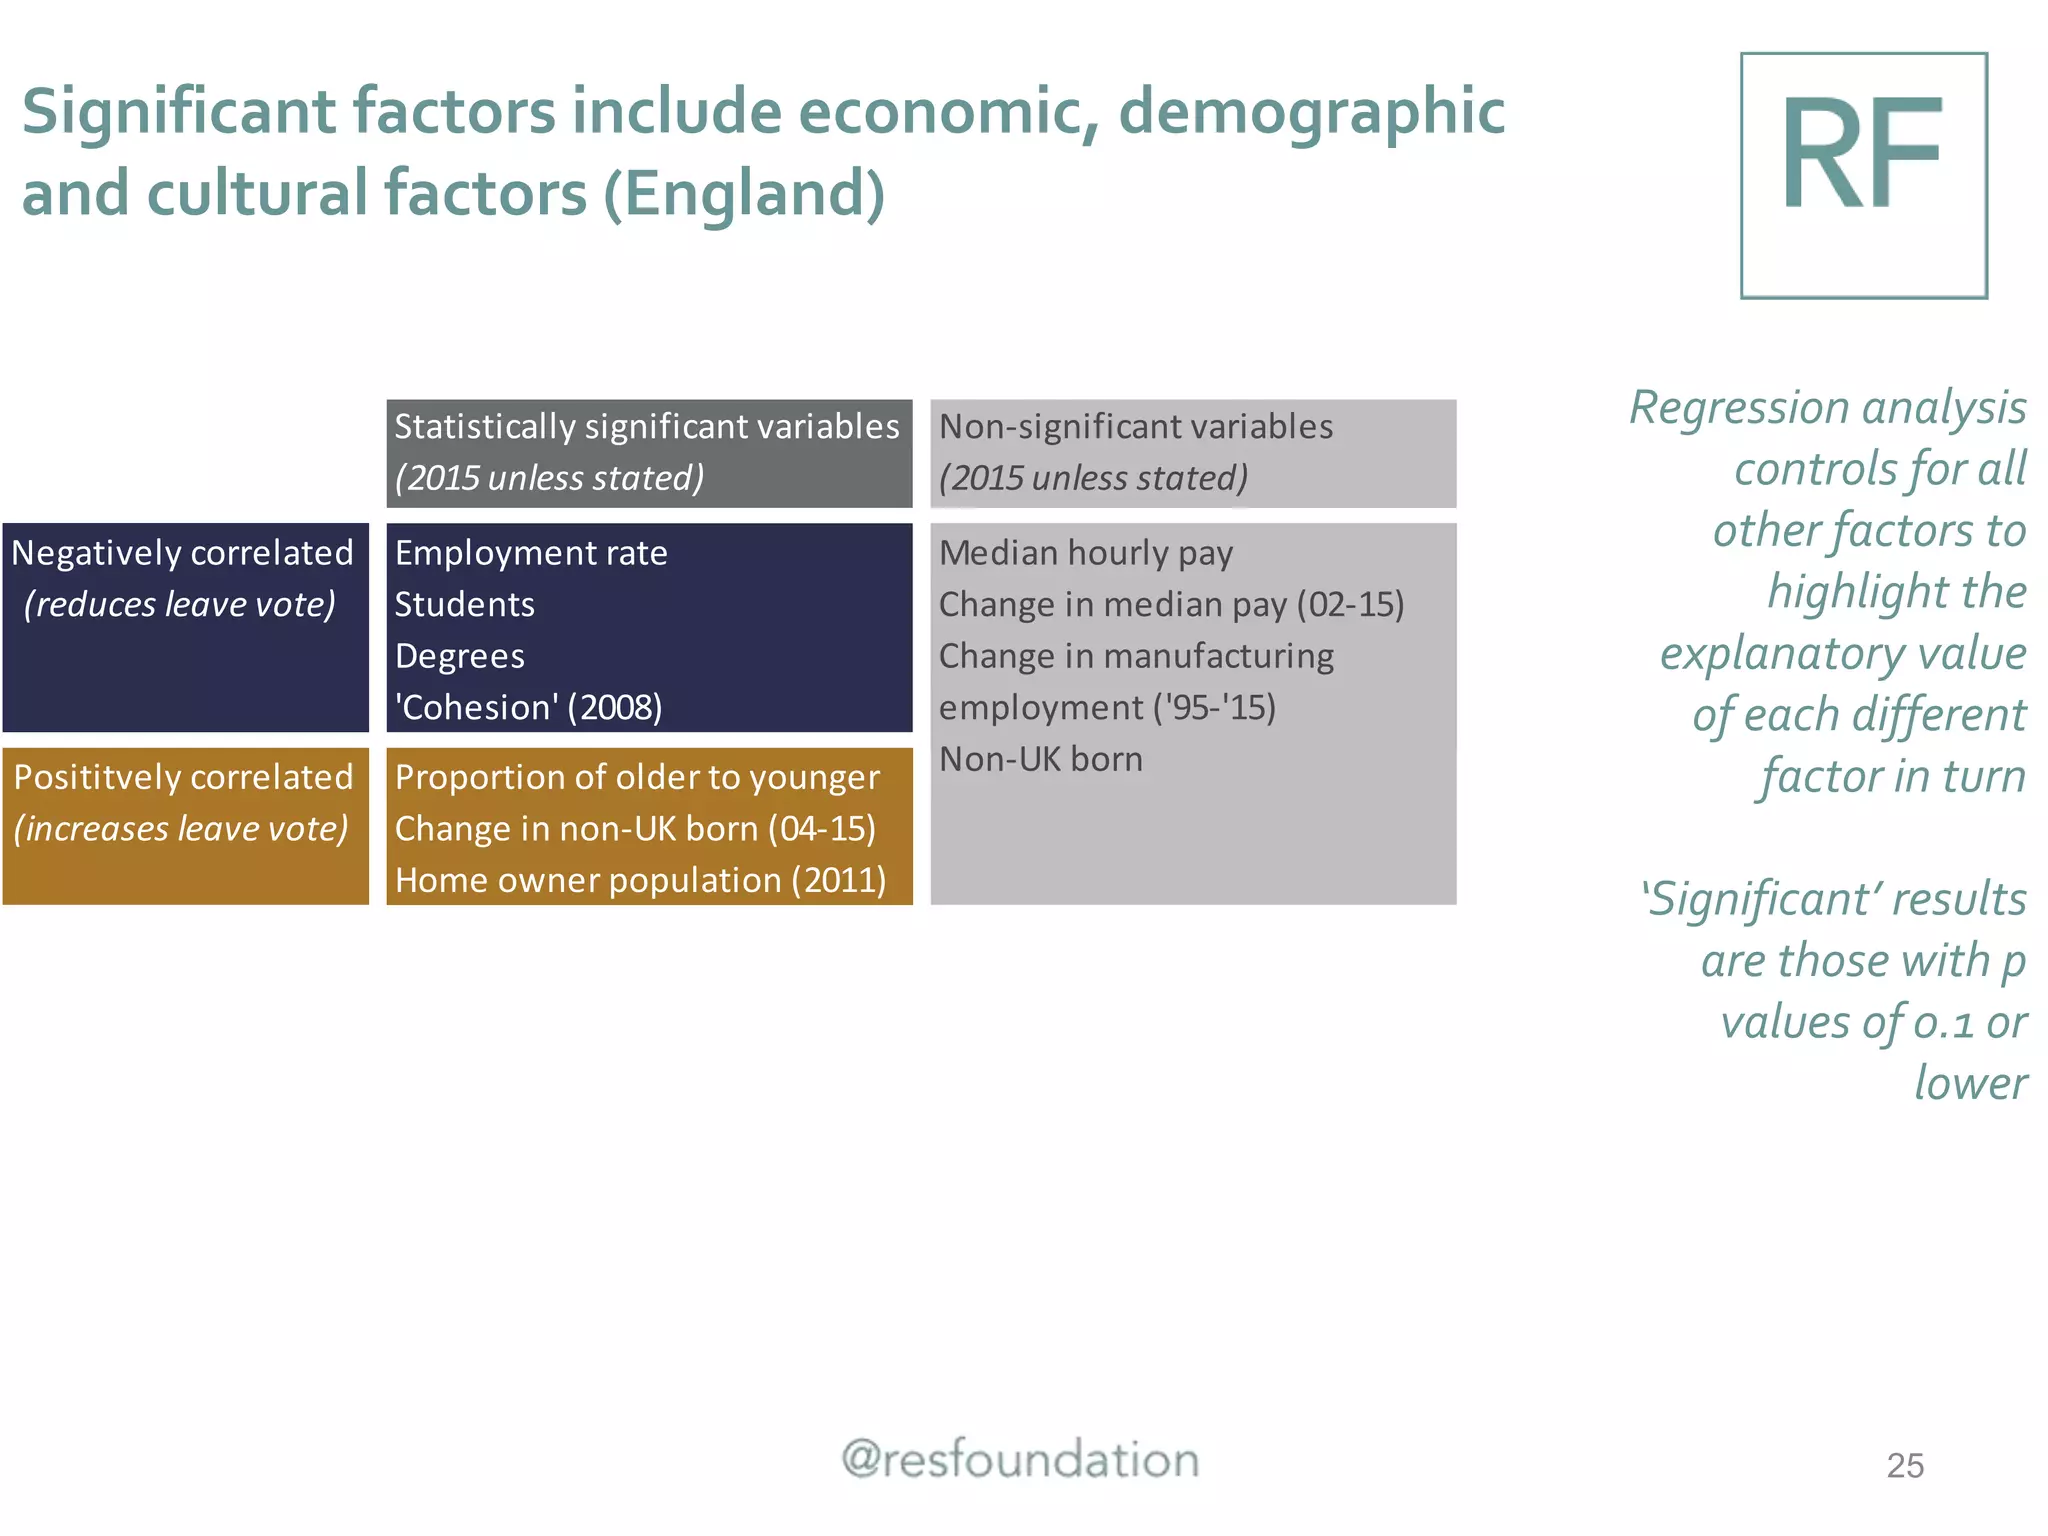
The importance of place
Explaining the characteristics underpinning the Brexit vote
across different parts of the UK
Stephen Clarke & Matt Whittaker
July 2016
@mattwhittakerRF /@stephenlclarke/ @resfoundation
1
In analysing the EU referendum vote, geography
matters
2
• Post-referendum analysis has highlighted the importance of
demographic, economic and cultural factors on individuals’ vote
• In this note, we consider the importance of place; highlighting the
extent to which those same factors matter across 378 of Britain’s 380
local authorities
• We test the strength of the relationship between these different
factors and the vote while holding all else constant (using a series of
regression models) for England,Wales and Scotland
• We highlight some of the more important economic factors in
Section 1; demographics in Section 2; and cultural issues in Section 3
• We provide a full description of the regression results in Section 4
3
1 PLACE AND ECONOMICS
Pay, employment and housing tenure
No relationship between voting patterns and median
hourly pay change since the early 2000s
Earnings were
subject to a pre-
crisis slowdown
across much of
the distribution,
followed by a six
year squeeze
that was
relatively evenly
felt
Simple
correlation finds
no evidence to
suggest depth of
the pay squeeze
affected the vote
Source: ONS, NOMIS 4
Though the strength of the leave vote does appear
to vary with the pay level
In the main, local
authorities with
higher levels of
median pay
recorded lower
votes for leave
Simple
correlation
implies relatively
strong
relationship
Source: ONS, NOMIS 5
But there are exceptions… with a clear division
between higher and lower paying groups
Can split lower
paying areas into
those with high
leave votes and
those with
relatively low
leave votes
Can similarly
split higher
paying areas into
those with low
leave votes and
those with
relatively high
leave votes
Source: ONS, NOMIS 6
Four groups of interest
7
No obvious correlation with employment levels, and
no clear differences across the four groups
Higher paying,
relatively high
leave areas
marginally more
likely to have
higher
employment
rates than higher
paying, low
leave areas, but
the differences
are slight
Source: ONS, NOMIS 8
But employment-vote relationship becomes much
clearer when we control for student numbers
Moving beyond
the simple
scatter chart,
regression
analysis shows
that
employment is
important once
the number of
students in an
area is controlled
for
Dots now show
clusters of LAs
Source: ONS, NOMIS 9
Home ownership levels also appear to matter, with
high owning areas more likely to vote leave
Big distinction
between
ownership in the
two higher
paying groups:
low leave areas
record much
lower levels of
ownership than
relatively high
leave areas
But this
distinction is less
marked between
the two lower
paying groups
Source: ONS, NOMIS 10
11
2 PLACE AND DEMOGRAPHICS
Age, student population and immigration
As already touched on, the link with the number of
current students runs in the opposite direction
Students form a
higher
proportion of the
population in low
leave vote areas,
marking a clear
difference
between some of
the lower paying
areas
Higher paying,
relatively high
leave vote tend
to have relatively
few students
Source: ONS, NOMIS 12
As does the size of the migrant population – i.e. the
higher the proportion of migrants in the local
population the lower the leave vote
Clear distinction
between higher
paying, low
leave and higher
paying, relatively
high leave areas
But distinction
not obvious in
relation to the
two lower paying
groups
Source: ONS, NOMIS 13
Yet on the face of it, there is no clear relationship
between the change in migrant population and leave
vote
Source: ONS, NOMIS 14
Based on a
simple
correlation, the
extent to which
the migrant
population has
changed in an
area since 2004
has little
correlation with
the leave vote
Data limitations
mean a number
of local
authorities are
missing from this
analysis
But the change in the migrant population does have
an effect once we take into account the size of the
migrant population in an area
Source: ONS, NOMIS 15
Regression analysis
controls for the
number of
migrants already in
an area
The leave vote was
higher in areas that
started the period
with relatively few
migrants but which
saw sizeable
increases – includes
Redditch,
Maidstone,
Gravesham and
Lincoln
16
3 PLACE AND CULTURE
Cohesion and education
Higher leave vote in areas that report lower levels of
‘cohesion’ (where different backgrounds ‘get on’)
Difference is
most marked
between the two
lower paying
groups: lower
paying, high
leave areas
record lower
cohesion than
lower paying,
relatively low
leave areas
Findings remain
even after
holding all other
factors constant
Source: DCLG, Hub Interchange 17
Simple correlation highlights apparently very strong
correlation with education levels
Having a
qualification
equivalent to
NVQ level 4 (i.e.
degree level) or
higher is key
difference
Separates both
the two higher
paying groups
and the two
lower paying
groups
Source: ONS, NOMIS 18
Source: ONS, NOMIS 19
With education showing correlation with culture,
demographics and economics – ‘cohesion’
Clear distinction
between levels of
‘cohesion’ in
areas with
highest and
lowest
proportions with
NVQ4+
Lower-skilled,
less-cohesive,
high-leave areas
include
Thurrock,
Boston &
Burnley
Source: ONS, NOMIS 20
With education showing correlation with culture,
demographics and economics – non UK-born population
Similar strength
of correlation
between
education and
level of migrant
population in the
local authority
Higher-skilled,
higher-migrant,
low-leave areas
include
Westminster,
Hammersmith
& Fulham and
Camden
Especially strong
relationship
between
education and
pay
Lower-skilled,
high-pay, higher-
leave areas
include
Havering,
Brentwood and
Bromley
Source: ONS, NOMIS 21
With education showing correlation with culture,
demographics and economics – pay levels
22
4THE KEY DRIVERS
Regression results
Regression analysis isolates the impact of each
variable when holding all others constant
23
• The simple correlations set out above depict those factors that are
related to the strength of the leave vote in each local authority
• These factors are shown to be important in a number of regression
models.We isolate the explanatory value of each different factor,
holding all other factors constant
• Technically, we use a clustered standard errors approach
• Due to data availability, most of our findings relate to England only,
but we run separate models with fewer variables to identify the
Scottish andWelsh ‘effects’
Significant factors include economic, demographic
and cultural factors (England)
24
Regression analysis
controls for all
other factors to
highlight the
explanatory value
of each different
factor in turn
‘Significant’ results
are those with p
values of 0.1 or
lower
Statistically significant variables
(2015 unless stated)
Non-significant variables (2015
unless stated)
Employment rate
Students
Degrees
'Cohesion' (2008)
Change in non-UK born (04-15)
Home owner population (2011)
Median hourly pay
Change in median pay (02-15)
Non-UK born
Proportion of older to younger
Change in manufacturing
employment ('95-'15)
Posititvely correlated
(increases leave vote)
Negatively correlated
(reduces leave vote)
Significant factors include economic, demographic
and cultural factors (England)
25
• Results show, for example, that a 10ppt increase in the employment rate
is associated with a 1.4ppt reduction in leave vote (all else constant)
• Likewise, a 10ppt increase in the share of the population with NVQ4+
qualifications is associated with a 4.8ppt reduction in the leave vote
• In contrast, a 10ppt increase in home ownership rates increases the
leave vote by 4.1ppt
Statistically significant variables
(2015 unless stated)
Ppt change in leave vote assoc.
w/ 10ppt increase in variable
Average across
English LAs
Employment rate -1.4 75.4%
Students -5.0 5.4%
Degrees -4.8 36%
'Cohesion' (2008) -4.1 77%
Change in non-UK born (04-15) 3.1 4.2%
Home owner population (2011) 4.1 66%
Negatively correlated
(reduces leave vote)
Posititvely correlated
(increases leave vote)
26
Relative to the SouthWest (which voted broadly in
line with the UK average), regional ‘effects’ are visible
Holding constant
factors such as pay,
education, migration
and cohesion, local
authorities in
Scotland recorded
leave votes that
were 12ppts lower
than in the South
West
In contrast, areas in
theWest Midlands
recorded leave votes
that were 3.6ppts
higher than in the
SouthWest
ppt change in leave vote associated
with the region
Statistically significantly different from South West vote
Scotland -12.01***
North West -2.876***
Wales -2.771***
Yorkshire and the Humber 1.632***
East Midlands 1.727***
North East 2.077**
West Midlands 3.624***
Not statistically significantly different from South West vote
London 0.565
South East 0.694
East 0.202
*** p<0.01, ** p<0.05, * p<0.1
27
Full regression results
England
Including
Wales
Including Wales &
Scotland
Median hourly pay ex. overtime (logged) -2.068 -3.298 4.218
Change in median pay (2002-15) -0.00386 -0.00930 -0.0511**
16-64 employment rate (2015) -0.141* -0.288*** -0.174*
Proportion of 50+ year-olds to 16-49 year olds (2015) 0.0154 -0.0182 0.0314
Students as proportion of population (2015) -0.502** -0.828*** -0.836***
Proportion of people with NVQ4 or higher (2015) -0.488*** -0.598*** -0.643***
Change in proportion of people in employment in manufacturing (1995-15) 0.0746 0.0623 -0.0223
Proportion of population who are migrants (2015) -0.0611 -0.0754 -0.241**
Change in the proportion of population who are migrants (2004-15) 0.312** 0.409*** 0.635***
Proportion of population who own home (2011) 0.342*** 0.301***
Proportion of population who believe people from different backgrounds get on well in local area (2008) -0.414***
Relative to South West
East 0.672 0.533 0.202
East Midlands 1.657*** 0.947** 1.727***
London -0.00474 1.207 0.565
North East 2.507*** 2.866*** 2.077**
North West -3.487*** -2.646*** -2.876***
South East 0.159 0.724 0.694
West Midlands 2.944*** 3.494*** 3.624***
Yorkshire and the Humber -0.0389 1.586*** 1.632***
Wales -3.682*** -2.771***
Scotland -12.01***
Constant 98.06*** 91.13*** 82.99***
Observations 235 251 271
R-squared 0.869 0.837 0.837
All models run with standard errors clustered by region *** p<0.01, ** p<0.05, * p<0.1
28
5 CONCLUSION
Economics clearly matter, but by no means the only
consideration
29
• Evidence that the geographical distribution of living standards influenced the
referendum vote, with employment having a significant effect
• But recent changes in pay appear not to have had a significant effect, implying
that living standard issues are long-established
• Demographics also matter, with areas with lots of students being more likely to
vote remain
• Cultural and geographical factors play a key role, represented by the importance
of feelings of cohesion within the local area, and by the tendency for different
regions to vote differently even after controlling for all other factors
• The level of migration doesn’t seem to matter but the pace of change over the
past decade or so does
• The strength of the correlation with higher qualification levels in an area is
particularly telling, with this variable closely associated with both economic and
wider cultural factors

The importance of place

  • 1.
    The importance ofplace Explaining the characteristics underpinning the Brexit vote across different parts of the UK Stephen Clarke & Matt Whittaker July 2016 @mattwhittakerRF /@stephenlclarke/ @resfoundation 1
  • 2.
    In analysing theEU referendum vote, geography matters 2 • Post-referendum analysis has highlighted the importance of demographic, economic and cultural factors on individuals’ vote • In this note, we consider the importance of place; highlighting the extent to which those same factors matter across 378 of Britain’s 380 local authorities • We test the strength of the relationship between these different factors and the vote while holding all else constant (using a series of regression models) for England,Wales and Scotland • We highlight some of the more important economic factors in Section 1; demographics in Section 2; and cultural issues in Section 3 • We provide a full description of the regression results in Section 4
  • 3.
    3 1 PLACE ANDECONOMICS Pay, employment and housing tenure
  • 4.
    No relationship betweenvoting patterns and median hourly pay change since the early 2000s Earnings were subject to a pre- crisis slowdown across much of the distribution, followed by a six year squeeze that was relatively evenly felt Simple correlation finds no evidence to suggest depth of the pay squeeze affected the vote Source: ONS, NOMIS 4
  • 5.
    Though the strengthof the leave vote does appear to vary with the pay level In the main, local authorities with higher levels of median pay recorded lower votes for leave Simple correlation implies relatively strong relationship Source: ONS, NOMIS 5
  • 6.
    But there areexceptions… with a clear division between higher and lower paying groups Can split lower paying areas into those with high leave votes and those with relatively low leave votes Can similarly split higher paying areas into those with low leave votes and those with relatively high leave votes Source: ONS, NOMIS 6
  • 7.
    Four groups ofinterest 7
  • 8.
    No obvious correlationwith employment levels, and no clear differences across the four groups Higher paying, relatively high leave areas marginally more likely to have higher employment rates than higher paying, low leave areas, but the differences are slight Source: ONS, NOMIS 8
  • 9.
    But employment-vote relationshipbecomes much clearer when we control for student numbers Moving beyond the simple scatter chart, regression analysis shows that employment is important once the number of students in an area is controlled for Dots now show clusters of LAs Source: ONS, NOMIS 9
  • 10.
    Home ownership levelsalso appear to matter, with high owning areas more likely to vote leave Big distinction between ownership in the two higher paying groups: low leave areas record much lower levels of ownership than relatively high leave areas But this distinction is less marked between the two lower paying groups Source: ONS, NOMIS 10
  • 11.
    11 2 PLACE ANDDEMOGRAPHICS Age, student population and immigration
  • 12.
    As already touchedon, the link with the number of current students runs in the opposite direction Students form a higher proportion of the population in low leave vote areas, marking a clear difference between some of the lower paying areas Higher paying, relatively high leave vote tend to have relatively few students Source: ONS, NOMIS 12
  • 13.
    As does thesize of the migrant population – i.e. the higher the proportion of migrants in the local population the lower the leave vote Clear distinction between higher paying, low leave and higher paying, relatively high leave areas But distinction not obvious in relation to the two lower paying groups Source: ONS, NOMIS 13
  • 14.
    Yet on theface of it, there is no clear relationship between the change in migrant population and leave vote Source: ONS, NOMIS 14 Based on a simple correlation, the extent to which the migrant population has changed in an area since 2004 has little correlation with the leave vote Data limitations mean a number of local authorities are missing from this analysis
  • 15.
    But the changein the migrant population does have an effect once we take into account the size of the migrant population in an area Source: ONS, NOMIS 15 Regression analysis controls for the number of migrants already in an area The leave vote was higher in areas that started the period with relatively few migrants but which saw sizeable increases – includes Redditch, Maidstone, Gravesham and Lincoln
  • 16.
    16 3 PLACE ANDCULTURE Cohesion and education
  • 17.
    Higher leave votein areas that report lower levels of ‘cohesion’ (where different backgrounds ‘get on’) Difference is most marked between the two lower paying groups: lower paying, high leave areas record lower cohesion than lower paying, relatively low leave areas Findings remain even after holding all other factors constant Source: DCLG, Hub Interchange 17
  • 18.
    Simple correlation highlightsapparently very strong correlation with education levels Having a qualification equivalent to NVQ level 4 (i.e. degree level) or higher is key difference Separates both the two higher paying groups and the two lower paying groups Source: ONS, NOMIS 18
  • 19.
    Source: ONS, NOMIS19 With education showing correlation with culture, demographics and economics – ‘cohesion’ Clear distinction between levels of ‘cohesion’ in areas with highest and lowest proportions with NVQ4+ Lower-skilled, less-cohesive, high-leave areas include Thurrock, Boston & Burnley
  • 20.
    Source: ONS, NOMIS20 With education showing correlation with culture, demographics and economics – non UK-born population Similar strength of correlation between education and level of migrant population in the local authority Higher-skilled, higher-migrant, low-leave areas include Westminster, Hammersmith & Fulham and Camden
  • 21.
    Especially strong relationship between education and pay Lower-skilled, high-pay,higher- leave areas include Havering, Brentwood and Bromley Source: ONS, NOMIS 21 With education showing correlation with culture, demographics and economics – pay levels
  • 22.
  • 23.
    Regression analysis isolatesthe impact of each variable when holding all others constant 23 • The simple correlations set out above depict those factors that are related to the strength of the leave vote in each local authority • These factors are shown to be important in a number of regression models.We isolate the explanatory value of each different factor, holding all other factors constant • Technically, we use a clustered standard errors approach • Due to data availability, most of our findings relate to England only, but we run separate models with fewer variables to identify the Scottish andWelsh ‘effects’
  • 24.
    Significant factors includeeconomic, demographic and cultural factors (England) 24 Regression analysis controls for all other factors to highlight the explanatory value of each different factor in turn ‘Significant’ results are those with p values of 0.1 or lower Statistically significant variables (2015 unless stated) Non-significant variables (2015 unless stated) Employment rate Students Degrees 'Cohesion' (2008) Change in non-UK born (04-15) Home owner population (2011) Median hourly pay Change in median pay (02-15) Non-UK born Proportion of older to younger Change in manufacturing employment ('95-'15) Posititvely correlated (increases leave vote) Negatively correlated (reduces leave vote)
  • 25.
    Significant factors includeeconomic, demographic and cultural factors (England) 25 • Results show, for example, that a 10ppt increase in the employment rate is associated with a 1.4ppt reduction in leave vote (all else constant) • Likewise, a 10ppt increase in the share of the population with NVQ4+ qualifications is associated with a 4.8ppt reduction in the leave vote • In contrast, a 10ppt increase in home ownership rates increases the leave vote by 4.1ppt Statistically significant variables (2015 unless stated) Ppt change in leave vote assoc. w/ 10ppt increase in variable Average across English LAs Employment rate -1.4 75.4% Students -5.0 5.4% Degrees -4.8 36% 'Cohesion' (2008) -4.1 77% Change in non-UK born (04-15) 3.1 4.2% Home owner population (2011) 4.1 66% Negatively correlated (reduces leave vote) Posititvely correlated (increases leave vote)
  • 26.
    26 Relative to theSouthWest (which voted broadly in line with the UK average), regional ‘effects’ are visible Holding constant factors such as pay, education, migration and cohesion, local authorities in Scotland recorded leave votes that were 12ppts lower than in the South West In contrast, areas in theWest Midlands recorded leave votes that were 3.6ppts higher than in the SouthWest ppt change in leave vote associated with the region Statistically significantly different from South West vote Scotland -12.01*** North West -2.876*** Wales -2.771*** Yorkshire and the Humber 1.632*** East Midlands 1.727*** North East 2.077** West Midlands 3.624*** Not statistically significantly different from South West vote London 0.565 South East 0.694 East 0.202 *** p<0.01, ** p<0.05, * p<0.1
  • 27.
    27 Full regression results England Including Wales IncludingWales & Scotland Median hourly pay ex. overtime (logged) -2.068 -3.298 4.218 Change in median pay (2002-15) -0.00386 -0.00930 -0.0511** 16-64 employment rate (2015) -0.141* -0.288*** -0.174* Proportion of 50+ year-olds to 16-49 year olds (2015) 0.0154 -0.0182 0.0314 Students as proportion of population (2015) -0.502** -0.828*** -0.836*** Proportion of people with NVQ4 or higher (2015) -0.488*** -0.598*** -0.643*** Change in proportion of people in employment in manufacturing (1995-15) 0.0746 0.0623 -0.0223 Proportion of population who are migrants (2015) -0.0611 -0.0754 -0.241** Change in the proportion of population who are migrants (2004-15) 0.312** 0.409*** 0.635*** Proportion of population who own home (2011) 0.342*** 0.301*** Proportion of population who believe people from different backgrounds get on well in local area (2008) -0.414*** Relative to South West East 0.672 0.533 0.202 East Midlands 1.657*** 0.947** 1.727*** London -0.00474 1.207 0.565 North East 2.507*** 2.866*** 2.077** North West -3.487*** -2.646*** -2.876*** South East 0.159 0.724 0.694 West Midlands 2.944*** 3.494*** 3.624*** Yorkshire and the Humber -0.0389 1.586*** 1.632*** Wales -3.682*** -2.771*** Scotland -12.01*** Constant 98.06*** 91.13*** 82.99*** Observations 235 251 271 R-squared 0.869 0.837 0.837 All models run with standard errors clustered by region *** p<0.01, ** p<0.05, * p<0.1
  • 28.
  • 29.
    Economics clearly matter,but by no means the only consideration 29 • Evidence that the geographical distribution of living standards influenced the referendum vote, with employment having a significant effect • But recent changes in pay appear not to have had a significant effect, implying that living standard issues are long-established • Demographics also matter, with areas with lots of students being more likely to vote remain • Cultural and geographical factors play a key role, represented by the importance of feelings of cohesion within the local area, and by the tendency for different regions to vote differently even after controlling for all other factors • The level of migration doesn’t seem to matter but the pace of change over the past decade or so does • The strength of the correlation with higher qualification levels in an area is particularly telling, with this variable closely associated with both economic and wider cultural factors