Stypoldione images.pptx
•Download as PPTX, PDF•
0 likes•1 view

New Paper on Sypoldione Drug used against breast cancer treatment

Recommended
Recommended
More Related Content
Similar to Stypoldione images.pptx
Similar to Stypoldione images.pptx (20)
Recently uploaded
Recently uploaded (20)
Stypoldione images.pptx
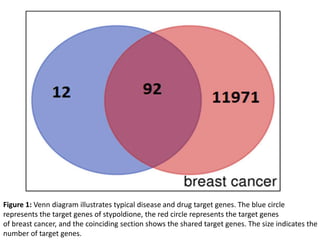
- 1. Figure 1: Venn diagram illustrates typical disease and drug target genes. The blue circle represents the target genes of stypoldione, the red circle represents the target genes of breast cancer, and the coinciding section shows the shared target genes. The size indicates the number of target genes.
- 3. Figure 2B
- 4. B
- 6. Figure 4B
- 9. Figure 5C
- 13. A
- 14. B = HSP90AA1 C= CXCL8 A= ESR1 D = APP E = MDM2 F = JAK2 G= KD J= MAPK14 K= KIT
- 16. Time (ns) 0 20 40 60 80 100 RMSD (Å) 0 1 2 3 4 5 6 Resiude Index 0 100 200 300 400 500 RMSF (Å) 0 1 2 3 4 5 6 7 Time (ns) 0 20 40 60 80 100 Radius of Gyration (Rg, Å) 24.6 24.8 25.0 25.2 25.4 25.6 25.8 26.0 26.2 Time (ns) 0 20 40 60 80 100 Number of H-Bonds 0.0 0.5 1.0 1.5 2.0 2.5
- 19. PI3K AKT mTOR BAD se 9 FKHR GRB2 SOS Ras MAP/ERK PLC-γ DAG PIP2 PKC FAK Ca2 eNOS cPLA2 NO PGs Gene expression Cell Proliferation Vascular Tone Permeability Cell Migration Cell Survival VEGFR2 VEGFR2 VEGFR2 STYPOLDIONE Nucleus
- 20. a b c
Editor's Notes
- Figure 1
- Figure 2A
- Figure 2: The outcome of the interaction between common target genes (a) PPI network of the shared target genes. Target genes are represented by the nodes, their filling by the 3D structure of the target genes, the edges by associations of target genes, and the colors of the edges by various interactions, such as cyan and purple for known interactions, green, red, and blue purple for predicted interactions, and chartreuse, black, and light blue for others. (b) The top 30 frequent target genes' frequency.
- Figure 3: GO analysis (top 20): molecular function, cellular component, and biological process. A) bubble diagram for the word in the molecular function category from the analysis of Gene Ontology enrichment. B) A bubble diagram for the Gene Ontology enrichment analysis term for the category of cellular components. C) A bubble diagram for the Gene Ontology enrichment analysis term for the biological processes category. B) The top processes identified by the numbers of associated target genes and the GO category findings.
- Figure 4A
- Figure4: KEGG pathway enrichment analysis (top 20) (A) Bar Plot for Pathway enrichment Analysis (B)Bubble chart for Pathway enrichment Analysis
- Figure 5A
- Figure 5B
- Figure 5: A) Protein-Protein interaction network based on common targets. B) The KEGG key pathway network based on KEGG enrichment analysis. C) the Stypoldione (shown as blue hexagon node), 92 common targets (shown as red oval nodes)
- Figure 6a
- Figure 6: Verification of the hub targets' UALCAN mRNA expression. (a) Twelve hub targets' mRNA levels in normal and BC tissues (***P0.001). (b) The mRNA levels of 12 hub targets at various phases of BC tumor development (*P<0.05; **P<0.01; ***P<0.001)
- Figure 7: OS analysis of 8 hub targets in Breast Cancer (K-M plot).
- Figure 8: Genetic changes in twelve hub targets in BC patients (cBioPortal). (a) Visual OncoPrint overview of genomic changes found in 12 hub targets. (b) A summary of changes in 12 hub targets across various BC types.
- Figure 9: Molecular docking of stypoldione with eleven hub genes: (A) ESR1, (B) HSP90AA1, (C) CXCL8, (D) APP, (E) MDM2, (F) JAK2, (G) KDR, (H) LCK, (I) GRM2, (J) MAPK14, (K) KIT
- Figure 10: shows the 4WPB's molecular surface with Stypoldione attached in a deep hole. The connections between ligand and protein are visible in the right top view of the 2D interaction, whereas the highly charged core ligand-bound site is visible in the right downcharged surface.
- Figure 11: MD simulation study of 100 ns trajectories of (A) C-backbone RMSD of 4WPB (black) and RMSD of Stypoldione (red), (B) RMSF of C-backbone of 4WPB, (C) Radius of gyration (Rg) of C-backbone of 4WPB+ Stypoldione, and (D) Formation of hydrogen bonds in 4WPB+ Stypoldione.
- Figure 12: Free energy decomposition of individual residues of protein during ligand binding.
- Figure 13: Using the MD trajectory for 100 ns, a PCA analysis on the Eigen vectors of 1000 frames in Cartesian coordinates.
- Figure 14: Overview of the involvement of VEGFR2 in various signaling pathway in breast cancer and inhibitory action of Stypoldione on VEGFR2 to reduce the breast cancer metastasis.
- Figure 15: In-vitro assays validated by Brazilian group on stypoldione (a) Results showing effectiveness of stypoldione on multiple myeloma cells by MTT assay (b) Represents apoptosis evaluation in multiple myeloma cells treated with stypoldione (c) Annexin V assay and cell cycle evaluation in multiple myeloma cells after incubation with stypoldione