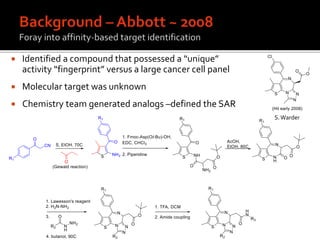
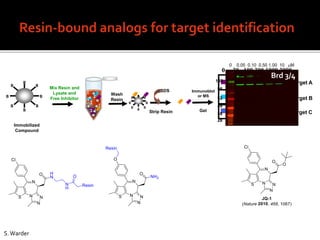
1. A compound was identified that had unique activity against a panel of cancer cell lines but the molecular target was unknown.
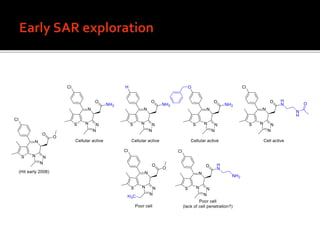
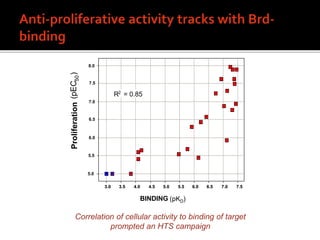
2. Analog synthesis defined the structure-activity relationship of the compound.
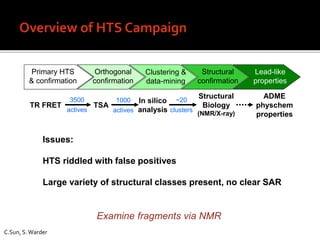
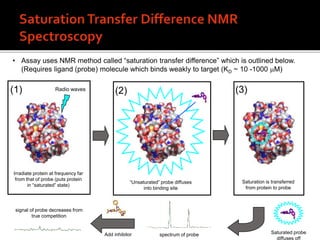
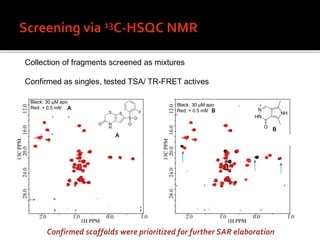
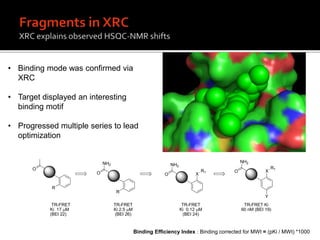
3. Fragment screening by NMR identified potential binding sites, which was confirmed by X-ray crystallography, and multiple series were progressed to optimization.