1. GROUP 1: Introduction toHydrology
I. Introduction
II. Hydrologic Cycle
III. History ofHydrology
IV. Hydrology in Engineering
HYDROLOGY
I. INTRODUCTIONTO HYROLOGY
Definition: Hydrology is the science thatencompassesthe occurrence, distribution, movementand properties ofthe watersof
the earth and their relationship with the environmentwithin each phase ofthe hydrologic cycle.
The term hydrology is from Greek: hydro, "water"; and logos,"study".
Water distribution: 70% ofthe Earth’s surface is covered with water but97.5% ofthis water is saltwater. Only 2.5%ofthe
planet’s water is freshwater,and only 1% ofthatexists on Earth’ssurface:
1%=lakes, rivers
20%=groundwater
79%=ice caps and glaciers
ComponentsOf The EarthSystem:
Lithosphere: the solid Earth; land
Hydrosphere: the liquid Earth; water
Atmosphere: the gaseous Earth; air
Biosphere: living things(organisms)and the parts ofthe lithosphere, hydrosphere, and atmospherein which
things live
Cryosphere: frozen or solid water such as ice caps, glaciers, snow and permafrost
In nature wateris present inthree aggregation states:
solid: snow and ice;
liquid: pure water and solutions;
gaseous: vaporsunder differentgrades ofpressure and saturation
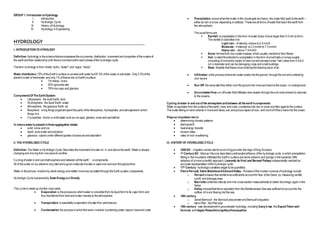
II. THE HYDROLOGICCYCLE
Definition: The Water or Hydrologic Cycle:Describes the movementofwater on, in,and above the earth; Water is always
changing and moving from one place to another
Cycling ofwater in and outofatmosphere and between all the earth’scomponents.
All of the water on our planetis recycled and a given molecule ofwater is used over and over throughouttime.
Water is the primary mediumby which energy and matter move are circulated through the Earth system components.
Hydrologic Cycle ispoweredby SolarEnergyand Gravity.
This cycle is made up ofa few main parts:
Evaporation:is the processby whichwater is converted from its liquid form to its vapor form and
thus transferred from land and water masses to the atmosphere.
Transpiration: is essentially evaporation ofwater from plantleaves.
Condensation: the processin which the warm,moistair (containing water vapour) risesand cools
Precipitation: occurswhenthe water in the cloudsgets too heavy,the water falls back to the earth --
either as rain or snow depending on altitude. These are all forms ofwater thatreach the earth from
the atmosphere.
The usual forms are
Rainfall: Is precipitation in the form ofwater drops ofsize larger than 0.5 mm to 6mm.
The rainfall is classified in to:
Light rain– ifintensity istrace to 2.5 mm/h
Moderate – ifintensity is2.5 mm/hr to 7.5 mm/hr
Heavy rain – above 7.5mm/hr
Snow: formed from ice crystal masses,which usually combine to form flakes
Hail: (violentthunderstorm) precipitation in the form ofsmall balls or lumpsusually
consisting ofconcentric layers ofclear ice and compactsnow.Hail varies from 0.5 to 5
cm in diameter and can be damaging crops and small buildings.
Sleet: droplets thatfreeze once entering the freezing layer ofair.
Infiltration: isthe processwhererain water soaks into the ground, through the soil and underlying
rock layers
Run Off- the rainwater flow either over the ground into riversand backto the ocean, or underground
Groundwaterflow- run offwater thatinfiltrates downwards through the soil rockswhereitis returned
to the oceans.
Cycling of water in and out of the atmosphere andbetween all the earth’scomponents:
Water evaporates from the surface ofthe earth, rises and cools,condensesinto rain or snow and falls againto the surface.
The water falling on land collects in riversand lakes,soil,and porous layersofrock, and muchofitflows backinto the ocean.
Plays an important role in:
determining climatic patterns
plantgrowth
heatenergy transfer
erosion rates
rates of rock weathering
III. HISTORY OF HYDROLOGICCYCLE
3200 BC – irrigation canals startto existin Egyptunder the reign ofKing Scorpion
1st Century BC- Marcus Vitruvius described a philosophicaltheory ofthe hydrologic cycle, in which precipitation
falling in the mountains infiltrated the Earth's surface and led to streams and springs in the lowlands.With
adoption of a more scientific approach,Leonardo da Vinci and Bernard Palissy independently reached an
accurate representation ofthe hydrologic cycle.
17th Century- hydrologicvariables began to be quantified.
Pierre Perrault, Edme MariotteandEdmundHalley - Pioneersofthe modern science ofhydrology include
o Perrault showed thatrainfall wassufficientto accountfor flow ofthe Seine, by measuring rainfall,
runoff, and drainage area.
o Marriottecombined velocity and river cross-section measurements to obtain discharge,again in the
Seine.
o Halley showedthatthe evaporation from the Mediterranean Sea was sufficientto accountfor the
outflow ofrivers flowing into the sea.
18th century
o Daniel Bernoulli - the Bernoulli piezometer and Bernoulli'sequation
o Henri Pitot - the Pitot tube
19th century - saw developmentin groundwater hydrology,including Darcy's law, the Dupuit-Thiem well
formula, and Hagen-Poiseuille'scapillaryflowequation.
2. 20th Century- Leroy Sherman'sunithydrograph,the infiltration theory ofRobert E.Horton
1930 - The greatexpansion ofactivity in flood control, irrigation,soil conservation,and related fields gave the first
real impetus to organized research in hydrology, asneed for more precise design data became evident.
IV. HYDROLOGY IN ENGINEERING
Engineering hydrology includes thosesegments ofthe field related to planning, design, and operation ofengineering projects
for the control and use ofwater.
Deals with:
estimation ofwater resources
the study ofprocesses such asprecipitation, runoff, Evapotranspiration and their interaction and
the study ofproblems such asflood and draughtand strategies to combatthem.
Applications:
The capacity ofstorage structures such asreservoirs
The magnitude offlood flows to enable safe disposal ofthe excess flow.
The minimum flow and quantity offlow available atvariousseasons.
The interaction ofthe flood waveand hydraulicstructures,such as levees,reservoirs,barragesand bridges.
GROUP 2: WeatherandHydrology
I. Temperature
II. JetStreams
III. Temperature
IV. Humidity
V. Geographic Distribution ofTemperature
VI. Winds
WEATHER AND HYDROLOGY
I. RADIATION
Radiation: the transfer ofenergy though spaceby electromagneticwaves.
Figure: Sea Breeze during daytime
Figure: Land Breeze during Nighttime
Heat Can Be Transferred In 3 Ways:
Conduction, Radiation, Convection
What Happens To IncomingSolar Radiation?
Reflection: LightBouncesBackFromAn ObjectAtThe Same Angle And Intensity.
Scattering: ProducesA Large Number OfWeaker RaysTraveling In DifferentDirections.
Backscattering: Scattering, Both Backwards And Forwards
ReflectionAnd The Earth’s Albedo:
Albedo Is ThePercent(%) OfRadiation Reflected By An Object.
***The Albedo For Earth Is About30%.For TheMoon,The AlbedoIs About7%.
LightObjects Have Higher Albedos And Darker Objects Have Lower Albedos.
Larger Angle:More Intense Heat(Hotter)
Acute Angle: LessIntense Heat(Cooler)
3. Measurementof Radiation:
Actinometerand Radiometer: are general namesfor instruments used to measure intensity ofradiantenergy.
Pyrheliometer: For measuring intensity ofdirectsolar radiation.
Pyranometer: For measuring hemispherical shortwave radiation,i.e.,the combined intensity ofdirectsolar
radiation and diffuse sky radiation.
Pyrgeometer: For measuring long wave radiation.
Pyrradiometeror Total HemisphricalRadiometer: For measuring all- wave radiation flux.
Net Pyrradiometer orNet Radiometer: For measuring netall-wave radiation flux.
The General Circulation:
Thermal Circulation
If the earth were a non-rotating sphere, a purely thermalcirculation would result. Theequator receives more solar radiation
than the higher latitudes. Equatorial air, being warmer,is lighter and tends to rise. Asitrises, itis replaced by cooler air from
higher latitudes.
Examples of ThermalCirculations:
sea breeze
land breeze
monsoons
mountain and valley breezes
Effects of Earth’s Rotation:
The earth from westto east, and a pointatthe equator movesatabout1670 km/hr.whileone at60◦ latmovesatone halfthis
speed.
II. JETSTREAMS
Jet streams: are fastflowing,narrow air currents found in the atmospheres ofsomeplanets, including Earth.The strongest
winds in the atmosphere.Jetstreamsmay start, stop,splitinto two or moreparts, combine into one stream,or flow in various
directions including the opposite direction ofmostofthe jet.
Air Current: is a flowing movementofair within a larger body ofair. Air currents flow in the atmosphere, the layersofair
surrounding the Earth. Their speeds usually range from 129 to 225 kilometersper hour (80 to 140 miles per hour),butthey
can reach more than 443 kilometers per hour (275 milesper hour).
Westerly Winds: The major jetstreamson Earth flowing westto east. Their paths typically have a meandering shape.
Two Parts of Jet stream:
• Polar Jets: The strongestjetstreams ataround 7–12 km(23,000–39,000 ft) above sea level
• SubtropicalJets: The higher and somewhatweaker ataround 10–16 km(33,000–52,000 ft).
Effect of Land andWaterDistribution:
• The horizontal flow ofair in any layer ofthe atmosphere always hasa componentdirected toward low pressure.
• Heat gains and losses are distributed through relatively greatdepths in large bodies ofwater by mixing,while land
is affected only near the surface. Consequently, land surface temperaturesare morevariable than those ofthe
surface oflarge bodies ofwater. This condition is further emphasized by the lower specificheat ofthe soil and its
higher albedo, especially in winter, when snow cover reflectsmostofthe incidentradiation back to space. In
winter there is a tendency for the accumulation ofcold denseair over land masses and warm air over oceans.In
summer, the situation is reversed.
Migratory Systems of Jet Streams:
The Semi-permanentfeatures ofthe general, or mean, circulation are statistical and atany time may be distorted or displaced
by transitory,or migratory system. Both semi-permanentand transitory features are classified as cyclonesor anticyclones.
• Cyclone-a more or lesscircular area oflow atmosphericpressure in w/c the wind blow counter clockwise in the
Northern Hemisphere.
• Tropical cyclone-formatlow latitudes and may develop into hurricane or typhoon w/wind exceeding 33m/sover
areas as large as 300km in diameter.
• Extra tropical Cyclone-usually formalong the boundaries between warmand cold air masses.
Type of Fronts:
• Frontal Surface: boundary between two adjacentair massesofdifferenttemperature and moisture content.
Frontal “surfaces” are actually layers or zone oftransition. The line ofintersection ofa frontal surface with the
earth is called a surface front.
• Upper-AirFront: formed by the intersection oftwofrontal surface aloftand hence marksthe boundary between
three air masses.
• Warm Front: the air masses are moving so thatwarmair displacescolderair.
• Stationary Front:Ifthe front is notmoving
• Occluded Front:is formed during the processofcyclogenesiswhen a coldfrontovertakes a warmfront.
III. TEMPERATURE
Definitionof Terms:
• Temperature: is a numerical measure ofhotand cold; Isa measure ofa quality ofa state ofa material.
• Air temperature: is a measure ofhow hotor cold the air is. Itis the mostcommonly measured weather
parameter.
• Terrestrial (Ground) Temperature: is nominally measuredat9 am and is the lowesttemperature recorded since
6 pm the previous day.
• Lowest maximum temperature(°C): The lowest(by month and overall)maximumair temperature observed at
the site.
• Mean minimum temperature (°C):The long-termaveragedaily minimum air temperature observed during a
calendar month and over the year.
• Lowest temperature (°C): The lowestrecorded temperature observed atthe site, calculated overall years of
record.
4. • Highest minimum temperature(°C): The highestrecorded minimum temperature observed atthe site,
calculated overall yearsofrecord.
• Average Highor Low Temperature:is a statistical average.
• Typical Temperatures: are the mostcommon temperaturesa location experiences.
• Mean maximum temperature (°C): The averagedaily maximumair temperature,for each month and as an
annual statistic, calculated overall yearsofrecord.
• Highest temperature (°C): The highestmaximumair temperature observed atthe site.
• Mean daily terrestrial minimum temperature (°C): The long-term average daily terrestrial (ground) minimum
temperature observed atthe site for each month and the year.
• Lowest terrestrialtemperature (°C): The lowestterrestrial minimum temperature observed atthe site over the
period
• Degree Day: is a measure ofheating or cooling.
• Lapse Rate: the rate atwhich atmospherictemperature decreaseswith increase in altitude.
Types of lapse rates:
Environmental Lapse Rate: is the rate ofdecrease oftemperature with altitude in the stationary
atmosphere ata given time and location
Dry AdiabaticLapse Rate:is the rate oftemperature decrease with altitude for a parcel ofdry or
unsaturated air rising under adiabatic conditions.
Saturated adiabatic LapseRate: This lapse rate variesstrongly with temperature.
Super-adiabatic LapseRate: isusually caused by intense solar heating atthe surface.
Measurementof Temperature:
• Thermometer: are mainly closed glasstubes thatcontain a liquid like alcohol or mercury.
• Stevenson Screen: or instrumentshelter is an enclosure to shield meteorological instruments against
precipitation and directheatradiation from outside sources, while still allowing air to circulate freely around them.
• Terrestrial Minimum Temperature thermometer: Thisthermometer measuresthe minimum temperature close
to ground level.
• Pyrometer: is a type ofthermometer usedto measure high temperatures.
• Thermocouple: is a temperature-measuring device consisting oftwodissimilar conductors thatcontacteach
other at one or more spots.
• Thermistor: is a type ofresistor whose resistance varies significantly with temperature,more so than in standard
resistors.
• Langmuir Probe: used to determine the electron temperature,electron density,and electric potential ofa
plasma.
• Gas Bulb Thermometer: measures temperature by the variation in volume or pressure ofa gas
• Infrared Thermometer: A type ofthermometer thatsenseselectromagneticwaves in the infrared wavelengths,
and compares the emissionsfrom a body to an internal reference for relative temperature.
IV. HUMIDITY
Humidity: refers to the amountofmoisture (water vapor) in the surrounding air. Humidity indicatesthe likelihood
of precipitation, dew,or fog.
Higher humidity reducesthe effectivenessofsweating in cooling the body by reducing the rate of evaporation ofmoisture from
the skin.
Water Vapor:Source ofall condensation and precipitation; Mostimportantgas in the atmosphere for understanding
atmospheric processes;Zero to 4% by volume
Relative Humidity: is a measure ofthe amountofmoisture in the air compared with the amountofmoisture the air can hold.
Relative humidity isexpressed as a percentage ofhow muchmoisture the air could possibly hold atthe temperature it
happens when youmeasure it.
If the air is at 90% relative humidity,sweatwill notevaporate into the air. As a result, we feel much hotter than the actual
temperature when the relative humidity is high.
If the relative humidity is low, wecan feel muchcooler than the actual temperature because our sweatevaporates easily,
cooling the body.
Dew Point: The temperature atwhich one parcel ofair wouldneed to be cooled in order to reach saturation
If the air was cooled further itwould condense,this would cause dew, fog, and clouds
AbsoluteHumidity: the total amountofwater vapor presentin a given volume ofair.
Instrument UsedTo Measure Humidity:
Hygrometer: is an instrumentused for measuring the moisture contentin the atmosphere.
Types of Hygrometer:
• Metal Paper CoilType Hygrometer: The metal-paper coil hygrometer is very useful for giving a dial indication
of humidity changes
• Hair TensionHygrometer:These devicesuse a human or animal hair under tension.
• Pyschrometer: consistsoftwo thermometers,one which is dry and one which is keptmoistwith distilled water
on a sock or wick
• Sling Psychrometer: where the thermometersare attached to a handle or length ofrope and spun around in
the air for a few minutes, is sometimesused for field measurements, butis being replaced by more convenient
electronic sensors.
• ChilledMirror DewPoint Hygrometers: Dew pointis the temperature atwhich a sample ofmoistair (or any
other water vapor) atconstantpressure reacheswater vaporsaturation.
• Gravimetric Hygrometer: measuresthe massofan air sample comparedto an equal volume ofdry air.
V. GEOGRAPHIC DISTRIBUTIONOF TEMPERATURE
Geographic Distributionof Temperature
In general, surface air temperature tends to be highestatlow latitudes and to decrease pole-ward.
GeographicalDistributionof Surface Temperature andSalinity
The distribution oftemperature atthe sea surface tends to be zonal, thatis ittends to be independentoflongitude
This trend is greatly distortedby the influence of:
Landmasses- Land heats and cools aboutfour times faster than water.
Topography-Climates over land may vary radically within very
shortdistances becauseofthe elevation and variationsin landforms.
Vegetation- refersto assemblagesofplantspeciesand the ground cover they provide.
Term of vegetationlike:
o Coastal mangrove stands
o Primeval redwood forests
o Sphagnum bogs
o Desertsoil crusts
o Roadside weed patches
o Wheat fields
o Cultivated gardens and lawns
The Variationof Temperature
In continental regions the warmestand coldestpointofthe annual temperature cycle lag behind the solsticesby about1
month.
Temperature Variations: The amountofsolar energy received by any region varieswith time ofday,with
seasons, and with latitude.
DiurnalVariation: Is the change in temperature from day to nightbroughtaboutby the daily rotation ofthe Earth.
5. Seasonal Variation: In addition to its daily rotation, the Earth revolvesin a complete orbitaround the sun once
each year.
VariationwithLatitude:The shape ofthe Earth causes a geographical variation in the angle ofincidentsolar
radiation.
Variations withTopography: Notrelated to movementor shape ofthe earth are temperature variationsinduced
by water and terrain.
VariationwithAltitude: We learned thattemperature normally decreaseswith increasing altitude throughoutthe
troposphere.
VI. WINDS
Winds are caused by differencesin air pressure.They move from areasofhigh pressureto low pressure.
Differences in air pressure are caused by unequal heating ofthe atmosphere. Cool air has higher air pressure so itflows
underneath the warm, lessdenseair.
Parameters of Wind:
Wind speed: speed is measured usingan anemometer; Wind speed is given in milesper hour, metres per second
or knots(1 knot= 1.151 miles/hr).
Wind run
Wind direction: is measured with a wind vane.
Instruments Usedto Measure WindParameters:
Anemometer: is the cup anemometer made up of3 or 4 cups arranged in a circular form rotating around a
vertical axis.
The wind speed is the speedofrotation ofthe cups whilethe windrun, which is the distance a particular parcel of
air is moving through in a given time, isgiven by the total revolutions around the axis ofthe cups.
Wind Vane: A wind vane measures wind direction. The name tells where the wind is coming from. i.e.– north
wind blows from the north to the south.
Types of Wind:
Local Winds:Winds thatblow over shortdistancesand are caused by unequal heating ofEarth’s surface within a
small area.
Sea Breeze – a wind thatblows from an ocean or lake onto land.
Land Breeze – the flow ofair from land to a body ofwater.
GROUP 3: Precipitation
I. Introduction to Precipitation
II. Occurrence ofPrecipitation
III. MeasurementofPrecipitation
IV. Interpretation of Precipitation Data
V. Variations in Precipitation
PRECIPITATION
I.INTRODUCTIONTO PRECIPITATION
Precipitation: is any productofthe condensation ofatmospheric water vapor thatfalls under gravity.
Forms ofPrecipitation:
1. Rain : liquid deposits falling from the atmosphere to the surface with a diameter 5mmto 7 mm
2. Drizzle: are rainfall which islessthan 5mm in diameter
3. Freezingrain: when falling liquid water droplets reachesa surface with a temperature below freezing point so,
the rain droplets quickly turn into ice.
6. 4. Sleet / ice pellets:transparent/ translucentspheresoffrozen water with a diameter > 5 mm; develop firstas
raindrops in relatively warm atmosphere then raindrops descend into a colder layer ofthe atmosphere
(Temp:<0oC) causing the freezing into ice pellets while reaching the ground surface
5. Snow: commonly found in the mid- and high- latitudes; itdevelops when water vapor depositsitselfdirectly to a
six-sided (hexagon) deposition nuclei as a solidcrystal, attemperature below freezing.
-Snow is usually associated with frontal uplifting with mid-latitude cyclones
-Snow occursfrom the Bergeron process,riming,and aggregation
-The nature ofsnowflakes depends on temperature and moisture content
6. Hail: a frozen form ofprecipitation with a diameter > 5 mm;hailstones: concentric shells ofice with alternating.
They are white cloudy appearance & those thatare clear cloudy white:contain partially melted. Snowflakesthat
freeze on to the to the surface ofthe growing hailstone clear shell:developswhen liquid water freezesonto the
hailstone
Shape of Raindrops:
II. OCCURRENCEOF PRECIPITATION
Cause of Occurrence of Precipitation:
1. Cyclonicor Frontal Activity: Stratiform or dynamicprecipitation occursas a consequence ofslow ascentofair
in synoptic systems(on the order ofcm/s),such as oversurface cold fronts, and over and ahead of warm fronts.
It is the resultfrom the lifting of air converging into a low pressureor cyclone.Cyclonic precipitation
may be either:
• Frontal Precipitation: itresults from the lifting ofwarm and moistair on one side ofa frontal surface over
colder, denser air on the other side
• Non-Frontal Precipitation:air will flow horizontally from the surrounding area,causing the air in the low-
pressure area to lift. When the lifted warm-air coolsdown athigher attitude, non-frontal cyclonic
precipitation will occur
2. Convection: Convective rain, or showery precipitation, occursfrom convective clouds,Itfalls as showerswith
rapidly changing intensity.
Convective precipitation falls over a certain area for a relatively shorttime, asconvective clouds have
limited horizontal extent. Mostprecipitation in the tropics appears to be convective; however, it has been
suggested thatstratiform precipitation also occurs.
It is caused by the rising ofwarmer, lighter air in colder,denser surroundings. The difference in
temperature may resultfrom unequal heating atthe surface, unequal cooling atthe top ofthe air layer, or
mechanical lifting whenthe air is forced to pass over a denser, colder air mass or over a mountain barrier.
3. Orographic Effects: Orographicprecipitation occurson the windwardside ofmountainsand is caused by the
rising air motion ofa large-scale flow ofmoistair acrossthe mountain ridge, resulting in adiabatic cooling and
condensation.
In mountainous parts ofthe world subjected to relatively consistentwinds (for example,the trade
winds), a moremoistclimate usually prevailson the windward side ofa mountain than on the leeward or
downwind side
It is the resultfrom the mechanical lifting over mountain.In rugged terrain the orographic influence is
so marked thatstorm precipitation patterns tends to resemble thatofmean annual precipitation.
Purpose of Precipitation:
1. As air rises itcools
2. As air cools clouds form and precipitation occurs
Necessary Conditions forPrecipitationto Occur:
1. cooling ofair (e.g. convectional / orographic/ cyclonic(frontal) uplifting)
2. condensation and cloud formation
3. an accumulation ofmoisture
4. the growth ofcloud droplets
Kinds of Clouds Subject to Precipitation:
Warm Clouds: cloudswith only liquidwater above0oC
Causes of Warm Cloud Precipitation:
1. Collision:whencloud dropletscollide with each other. Collision efficiency dependson relative size ofa
collector drop and droplets below:
- Low efficiency for very small drops
- Low efficiency for same-size drops
- High efficiency for drops in between these size
2. Coalescence: – when colliding cloud droplets sticktogether. Coalescence efficiency is assumed to be near
100% (all drops stick together ifthey collide)
Cold Cloud: a cloud entirely below 0oC thatmay contain supercooled water, ice, or both
Cool Cloud: a cloud with regionsboth above and below 0oC
Mechanism of Precipitation Development:
1. Collision- Coalescence theory
- A dropletmay continue to grow by diffusion beyond 20 micrometers in diameter, however, once a dropletattains
this size, growth is slow and inefficient.
- Droplets this large begin to collide and coalesce with other droplets as they fall through the cloud, meaningthey
will bump into and bond to one another and form larger drops.
2. Bergeron-Findeisen Process
- Also known as the cold rain or ice crystal process
- As the formation ofprecipitation in the cold clouds ofthe mid and upper latitudes by ice crystal growth.
- The equilibrium vaporpressure overwater is greater than the saturation vaporpressure over ice,atthe same
temperature.
- Therefore in a mixed phase cloud, the liquid water will be outofvapor pressure equilibrium and will evaporate to
reach equilibrium.
- The water droplets will move toward the lower pressure over the ice and diffuse onto the ice crystals.
- The vapor will be condensed and freeze onto the ice crystal,causing itto grow larger.
For air withboth supercooledwaterandice:
1) Amountofwater vapor isin equilibriumwith water (saturated)
2) Amountofwater vapor isnotin equilibrium with ice (supersaturated)
7. 3) Water vapor deposits onto ice, lowering the amountofwater vapor,causing
evaporation ofwater
4) The cycle continues– ice grows and water vanishes
Effects of Precipitation:
1. Effects on Agriculture: a regular rain pattern is usually vital to healthy plants,too muchor too little rainfall
can be harmful, even devastating to crops. Droughtcan kill cropsand increase erosion,whileoverly wet
weather can causeharmful fungus growth.
Soil nutrients diminish and erosion increasesduring the wetseason. Animalshave adaptation and
survival strategies for the wetter regime.
III. MEASUREMENTOF PRECIPITATION
Instruments forMeasuringPrecipitation:
Cylindrical RainGauges: Asthis type ofrain gauge can also be usedto measure snow, itis alternatively known
as a cylindrical rain/snow gauge.Itconsists ofa cylindrical vessel with a uniform diameter from top to bottom and
an orifice at the top.
OrdinaryRainGauges: Ordinary rain gaugesare the type used atnon-automated observatories. With such
devices,the observer takes measurements using a rain-measuring glassatregular intervals.
Siphon RainGauges: Thistypeofrain gauge consists ofa receptacle to collectprecipitation and a measuring
part to measure and record its amount. The measuring partconsists ofa floatwith a recording pen attached, a
storage tank with a siphon to drain a fixed amountofwater,and a clock-driven drum.
Tipping Bucket Rain Gauges: Thistype ofrain gauge generates an electricsignal for each unitofprecipitation
collected, and allows automatic or remote observation with a recorder or a counter. The only requirementfor the
instrumentconnected to the rain gauge is thatit mustbe able to countpulses. Thus,a wide selection of
configurations and applications is possiblefor this measuringsystem.Solid precipitation can also be measured if
a heater is setatthe receptacle.
Windshields:Wind exerts a significantinfluence on the observation ofprecipitation with snow and rain gauges,
and there is no way to avoid its effects. However,accurate collection ofprecipitation in a rain gauge is possible
when the wind around the receptacle is horizontal and its speed isequal to thatatground level or whenno
vortices develop near the gauge.
IV. INTERPRETATIONOF PRECIPITATION DATA
Interpretationof missing precipitation data includes:
1. Estimating Missing PrecipitationData at a Station
Arithmetic MeanMethod:is used when normal annualprecipitation is within 10% ofthe gauge for which
data are being reconstructed. This method is leastaccurate however.
NormalRatioMethod (NRM): is used when the normal annual precipitation atany ofthe index station
differs from that of the interpolation station by more than 10%. In this method, the precipitation amountsat
the index stations are weighted by the ratios oftheir normal annual precipitation data.
2. CheckingInconsistency inParticularData at a Station: by a techniquecalled Double Mass Analysis.Itis
used to check the consistency ofmany kindsof hydrologicdata by comparing date for a single station with thatof
a pattern composed ofthe data from several other stations in the area. Thedouble-masscan also be used to
adjustinconsistentprecipitation data
3. Averaging Precipitationoveran Area: Itis the amountofprecipitation which can be assumed uniformover an
area. If the average precipitation over an area is known than total rain volume ofwater can be computed for that
area.
There are some widely used methodsto compute average precipitation over an area,butthe most
common ofthese used are:
Arithmetic MeanMethod
Theissen PolygonMethod: (otherwise known as Voronoi polygons or Voronoi diagrams),are an essential
method for the analysisofproximity and neighborhood.
Isohytal Method
Depth-Area-DurationCurve Analysis: DADcurves exhibitthe depth and the area covered by the rainfall
with a particular duration.
There is a definite relation among depth, area and duration ofrainfall. The longer duration rainfall
covers a widerarea. Shorttime rainfalls normally cover small areas. Rainfall rarely occurs uniformly over a
large area.
IV. VARIATIONS INTEMPERATURE
1. Geographic Variations: In general, precipitation is heaviestnear the equator and decreaseswith increasing
latitude. There are four recognized climate typesin the Philippines,and they are based on the distribution of
rainfall
2. Time Variations: The seasonal distribution ofprecipitation varieswidely which shows typical seasonal
distributions. Distribution vary with storm type,intensity and duration.Thereis no typical distribution thatis
applicable to all situations. The time distribution ofrainfall within storms is importantfor estimating flood
hydrographs.
3. Record Rainfalls: rainfalls amountare notmetby existing data from pastrainfalls therefore setting up a new
record for rainfall
GROUP 4 – 5: Stream Flow
I. Introduction to Stream Flow
II. MeasurementofStream Flow
III. Ice, Snow Packand Snow Fall on Streams
IV. Stream Flow Discharge
V. Water Years
VI. Presentation ofStream Flow Data
a. Hydrographs
b. Mean Annual Run-Off
c. Mean Daily Flows
VII. AdjustmentOfStream Flow Data
a. Factors thataffectStream Flow data
b. Factors thatCauses Inaccuracy to Stream Flow Data
VIII. Variation Of Stream Flow
IX. Precipitation- Run OffRelation
STREAM FLOW
I. INTRODUCTION
Stream flow or Channel runoff: is the flow ofwater in streams, rivers, and other channels,and is a majorelementof
the water cycle. Streamflow is the main mechanismby which water movesfrom the land to the oceans or to basins ofinterior
drainage
Purpose of documentingandmonitoringstream flow:
1. Developing water budgets
2. Conducting loading calculations
3. Evaluating the relationship between groundwater and surfacewater
4. Critical in evaluating impacts from urban runoff
5. Essential partin the hydrologic cycle
II. MEASUREMENTOF STREAMFLOW
8. Stream flow measurement methods:
1. Non recording stream gauge:
a. Staff
b. Wire or String
c. CrestStaff
2. Recordingstream gauge:
a. Floattype
b. Digital Gauge
Two Type of Gauges usedin Measurement of Stream Flow:
1. Manual Gauges
a. Staff gauges are used for a quick visual indication ofthe surface level In reservoirs,rivers streams,
irrigation channels, retention ponds, and wherever accuracy and readability are important.
b. Crest-Stage Gageis a device for obtaining the elevation ofthe flood crestofstreams. The gage is
widely used because itis simple,economical,reliable and easily installed
2. RecordingGauges: They have advantages over the manual ones
a. Float Gauge:Floatmovementfluctuates with change in stage and this is recorded by a chart. In
hydrologic measurements, both the big and low flows are measured within the chart
b. Digital Recorders: they have clocks and used when for examplehourly measurements are desired
usually where stages do notincrease and decreasesteeply.The recorder should be placed ata
heightmore than the expected peak stage. To know the maximumstage expected, an ordinary
gauge can be used for some time
Locationof the Gauge:
1. Gauges should notbe located in riverswith scouring characteristics.
2. The locations should stir clear ofriver bendsbecause the water surface is inclined and there is turbulence making
the stage measurementinconsistent.
3. The upstream ofa natural control eg. a rapid should be used, notdownstream.
4. A uniform channel helps good stage measurement. Irregular cross sectionsshould be avoided.
III. ICE,SNOWPACKANDSNOWFALLONSTREAMS
Snow Hydrology: is a scientific study in the field ofhydrology which focuseson the composition, dispersion,and movement
of snow and ice.
Snow Pack: Itforms from layersofsnow thataccumulate in geographicregionsand high altitudes where the climate includes
cold weather for extended periods during the year.Snowpackare an importantwater resourcethatfeed streams and riversas
they melt. Therefore snow packsare both the drinking water source for many communitiesand a potential source offlooding
(in case ofsudden melting). Snow packsalso contribute mass to glaciersin their accumulation zone.
The freezing ofwater also temporarily affects stream flow by suddenly increasing friction and thus causing the flow to
decrease. When Ice conditions exist, itis necessary to make periodicmeasurementthrough holesin the ice.
Types of Ice Formation onStreams:
1. Frazil Ice: is a collection ofloose, randomly oriented needle-shaped ice crystalsin water. Itresemblesslush and
has the appearance ofbeing slightly oily when seenon the surface ofwater.
2. Anchor Ice: formsin large quantities on the beds ofriversor on obstaclesunder the water surface
3. Ice Sheet: forms due to insufficientturbulence in the stream.
Measurement of SnowonStreams:
• Terrestrial Measurements
• Remote Sensing
• The Landsat-MSS
IV. STREAM FLOWDISCHARGE
Measurementof Stream Flow Discharge:
1. Current meter: is oceanographicdevice for flow measurement. For measurementin deep water, the meter is
suspended from a cable. For measurementin shallow water,the meter is mounted on a rod, and the observer
wade the stream.
Current MeterMeasurement:
A. Divide channel section into numeroussub sections.
B. Determine the area of each sub sections by directly measuring the width and depth
C. Determine the water velocity ofeach sub section using currentmeter.
D. Average Velocity = (Velocity @2/10th ) + (Velocity @8/10th ) for Deep water
2
Ave. Velocity for shallow water = Velocity @6/10th depth
E. Discharge (n) = Ave. Velocity in a vertical x Area
F. Total Discharge = Σ Discharge in each vertical
2. Price Meter: is the mostcommon currentmeter consistsofsix conical cups rotating abouta v ertical axis.
3. Acoustic DopplerCurrentProfiler (ADCP):a device mounted on a small watercraft. Itis used for measuring the
discharge ofa river thatrelease acoustic beams to probe the riverbed and its geometric feature and span ofthe
river to determine the discharge.
V. WATER YEARS
Water Years is a term commonly used in hydrology to describe a time period of12 months for which precipitation totals are
measured. A 24-hour counterpartto this is called water-day
Purpose:
• To compare precipitation one year to another
• To be used in the determination ofsurface-water supply
Purpose inRelationto Engineering:
• Projection ofwater supply for domesticand industrial uses
• Used in the design ofbridges
• Used in the design ofwater systems
• Used in the design offlood prevention and alleviation systems
• Projection ofFoundation Plans ofStructures
Definitionof Terms:
• Flood – whenthe capacity ofa river to transportwater is exceeded and water flowsoverits banks.
• Base flow - The base flow ofthe river represents the normalday to day discharge ofthe riverand is the
consequence ofgroundwater seeping into the river channel.
• Storm flow - storm runoffresulting from stormprecipitation involving both surface and through flow.
• Bank full discharge - the maximumdischargethata particular river channel iscapable ofcarrying without
flooding.
• Peak discharge – the pointon a flood hydrograph whenriver discharge is atits greatest.
• Peak rainfall - the pointon a flood hydrograph when rainfall is at its greatest.
• Lag time – period oftime between the peak rainfall and peak discharge
VI. PRESENTATION OFSTREAM FLOWDATA:
A. HYDROGRAPHS
Hydrograph isa graph showing the rate offlow (discharge) versustime pasta specific pointin a river called station,or other
channel or conduitcarrying flow. The rate offlow is typically expressedin cubic meters or cubic feetper second (cmsor cfs).
It can also refer to a graph showing the volume ofwater reaching a particular outfall, or location in a sewerage network.
These are commonly used in the design ofsewerage, more specifically,and the design ofsurface water sewerage systems
and combined sewers.
9. A.1. TYPES OF HYDROGRAPHS:
There are different methods ofplottinghydrographs,dependingonthe purpose of the chart:
• Storm Hydrographs - These can be usedto show annual discharge patterns offlow in relation to climate.
• Direct Run-off or Unit HydrographRun-off- are a type ofstorm hydrographs.They cover a relatively shorttime
period, usually hours or daysrather than weeksor months. They are used to measure the run-offor rate of
discharge ofa certain storm or rainfall.
• Flood hydrographs – These are used to show the rate atwhich normally dry areasare infiltrated by water
because ofthe overflow ofnearby bodies ofwater
• Annual Hydrographs aka Regimes– are used for reservoir studies and power-generation studiesifever a
power plantis situated in a certain body ofwater. Showsthe dischargerate and the changes in discharge a body
of water produces over a period of1 year.
• Other hydrographs – used to determine storage opportunities in the drainage network.
A.2. FLOODSCALES
Flood Stage: term used to describe a pointatwhich water level as read by gauge for a particular body ofwater
threatens live, property commerce or travel.
Five Levels of Flooding:
1. Action Stage: atthis point, there are no man-made structures flooded butwater level passesslightly
beyond its normal levels.
2. Minor FloodStage: minor flooding isexpected atthis level.
3. Moderate FloodStage: flooding reacheshigher than minor level.Roadsand some areasmay be cut
off. Buildings are expected to be flooded.
4. Major Flood Stage: this stage issignificantto catastrophic.
5. Record FloodStage: this isthe highestor the peak water level thatit’s been since records began
B. MEAN ANNUALRUNOFF
Mean AnnualRunoff is the total quantity ofwater thatis discharged ("runs off") from a drainage basin in a year.Data
reports may presentannual runoffdata as volumes in acre-feet, as discharges per unitofdrainage area in cubic feetper
second per square mile,or as depths ofwater on the drainage basin in inches.
C. MEAN DAILY FLOW
Mean Daily Flow is the stream flow date published from midnightto midnight. Itresultin a mean daily flow isexpressed
in cumecs/water-day or volume ofdischarge in cubicmeter per secondsofa time span ofmidnightto midnight.
VII. ADJUSTMENTOF STREAMFLOWDATA
a. Factors Affecting Stream flow Data
• Physical factors:
a. Shape and Size of Drainage Basins
b. DrainageBasin Gradient - Drainage basinswith steep sides tend to haveshorter lag times
than shallower basins.
c. Stream Network - Basins thathave many streams (highdrainage density) drain more quickly
so have a shorter lag time.
d. Degree of Saturation - Ifthe drainage basin is already saturated then surface runoffincreases
due to the reduction in infiltration.
e. Permeability of Rock TypeWithin the Basin – the permeability or the porosity ofthe bed of
the body ofwater.
f. Amount of Vegetation- Ifa drainage basin has a significantamountofvegetation this will
have a significanteffecton a storm hydrograph.
g. Amount of Precipitation – increasethe rateof discharge.
• Human Factors:
a. Existing Man-made Drainage Systems - Drainage systemsthathave been created by
humans lead to a shortlag time and high peak discharge as water cannotevaporate or infiltrate
into the soil
b. Urbanization- Area thathave been urbanizedresultin an increase in the use ofimpermeable
building materials. This meansinfiltration levelsdecrease and surface runoffincreases. This
leads to a shortlag time and an increase in peak discharge.
b. Factors That Causes Inaccuracyin Stream Flow Data
1. Changes inthe location of the station- changes in the location ofthe station affects volumeand rate ofdischarge
readings.
2. UnaccountedDiversion – causesofwater diversion which decreases run-offor flow rate.
3. DeforestationandReforestationof Area – certain areasmay have changesin the vegetation thatcauses shifts in
the flow record.
VIII. VARIATIONS OF STREAMFLOW
These are the variations or the changesthatoccur in the rate ofdischarge and amountofrun-offin a body ofwater caused by
natural phenomena.
1. Variations in Total Run-off – changesobserved every year from the annual total run offpublished.
2. Seasonal Variations inRun-off – changes in run-offcaused by changes in climate or seasons.
3. Variations of Daily Rate - day-to day changesin the stream flow.
IX. PRECIPITATION-RUN OFF RELATION
Phenomena of Run-Off:
1. Surface Retention:is the state whenthe water comesfrom the rain, hail, snow or any kind ofprecipitation is
being retained in or above the ground surface and actlike a basin in the ground surface.
Includes the ff.:
a. InterceptionStorage Capacity: refers to precipitation thatdoes notreach the soil, butis instead
intercepted by the leavesand branches ofplants and the forestfloor. Itoccurs in the canopy and in the
forestfloor or litter layer.
Interceptometer: A rain gage which is placed under trees or in foliage to determine the rainfall in that
location; by comparing this catch with thatfrom a rain gage setin the open, the amountofrainfall which has
been intercepted by foliage is found.
b. Depression Storage Capacity is the ability ofa particular area ofland to retain water in its pits and
depressions, thus preventing itfrom flowing. The study ofland'sdepression storage capacity is importantin
the fields ofgeology, ecology,and especially hydrology.
Roughness Clinometer: measure surface roughness,slopeand depression storage in the field. Designed
for digitizing the surface ofthe landscape at3.8 cm intervals,itis capable ofestimating depression storage
up to 1 meter in length.
2. Runoff Mechanisms: includes the ff.:
a. Infiltration: isthe processby which water on the ground surface enters the soil.
b. SaturationOverland Flow: occursprimarily atthe base ofslopes marginal to stream channels.
c. Subsurface Storm Flow: isa runoffproducing mechanism operating in mostupland terrains. In a humid
environmentand steep terrain with conductive soils, subsurface stormflow may be the main mechanismof
storm runoffgeneration.
3. The Runoff Cycle:The partofthe hydrologiccycleinvolving water between the time itreaches the land as
precipitation and its subsequentevapotranspiration or runoff.
10. GROUP 5-6: EvaporationandTranspiration
I. Evapotranspiration
II. Factors Controlling Evaporation
III. Instruments Used In Evaporation Rate Determination
IV. Transpiration
EVAPORATION & TRANSPIRATION
I. EVAPORATIONANDTRANSPIRATION(EVAPOTRANSPIRATION)
Evaporation isthe continuous exchange ofwater moleculesto and from the atmosphere.
Transpirationis the processofwater movementthrough a plantand its evaporation from aerial parts, suchas from leaves but
also from stems and flowers.
II. FACTORS CONTROLLING EVAPORATION
A. MeteorologicalFactors
A.1. Solar Evaporation:itis the evaporation caused by the radiation from the sun.
A.2. WindSpeed: higher wind speeds tends to extractheatfrom the water ata more rapid rate.
A.3. Vapor Pressure:Ifthe air already has a high concentration ofthe substance evaporating,then
the given substance will evaporate more slowly.
A.4. Temperature: temperature is directly proportional to evaporation.
A.5. Surface Area of Basin: Large surface areashave faster evaporation rates.
B. Nature of Evaporating Surface
The rate of evaporation ofwater dependson the surface in which itis suspended,or the kind ofsubstance thatis
subjectto evaporation.
C. Effects of Water Quality
The water quality or any foreign material which tends to seal the water surface or change its vaporpressure or
albedo will affectthe evaporation.
III. INSTRUMENTS USEDIN EVAPORATIONRATE DETERMINATION
1. Atmometers orEvaporimeter:is an instrumentthatmeasuresthe loss ofwater from a wetted, porous
surface.
2. Pan and Tank Evapotranspirometer: a kind ofAtmometer thatuses pan and tanks.
3. Lysimeteror Evapotranspirometer: is a measuring device which can be used to measure the amountof
actual evapotranspiration which isreleased by plants,usually crops or trees.
IV. METHODS INMEASURING EVAPORATION RATE:
A. Water-Budget Determination: the mostobviousapproach in evaporation determination which involves the
maintenance ofwater budget. Water-budgetdetermination includes the amountofprecipitation, seepage,
inflow and outflow in the computation ofevaporation.
*Note: Ifquantity ofwater is large in comparison with evaporation losses, water-budgetresultsare of
questionable accuracy.
B. Energy-Budget Determination: This includesthe amountofradiation absorbed by the water body,amount
of heat-transfer to the atmosphere or conduction, the energy stored in the water body, and the adverted
energy or energy contentofinflow and outflow elements to compute for the rate of evaporation.
C. AerodynamicDetermination: This approach includesthe determination ofvapor pressure,windsspeed,
and heightat which data wastaken from the water surface to compute the netevaporation. This approach
yields the mostsatisfactory results ofall the approaches butitis consideredas seasonally biased which
means this approach also depends on atmosphericstability like the energy-budgetdetermination approach.
IV. TRANSPIRATION
Definitionof Terms:
1. Transpiration:is the process by which moisture is carried through plants from roots to small pores on the
underside ofleaves,where itchangesto vapor and is released to the atmosphere.
2. Senesce: Premature ageing, which can resultin leafloss
3. Hydrophytes: Aquatic plants such asreeds or cattails
4. Phytometer: is a large vessel filled with soil in which one or more plants are rooted.
5. Xerophytes: a plantevolved to withstand very dry environmental conditions
6. Phreatophytes: Deep rooted plants thatobtain significantportion ofwater thatitneeds from the phreatic zone.
7. Mesophytes:terrestrial plants which are adapted to neither a particularly dry nor particularly wetenvironment
Factors AffectingAtmospheric Transpiration;
1. Temperature: An increase in temperature increasesthe rate oftranspiration.
2. Relative Humidity: High humidity surrounding the leavesreduces the rate oftranspiration. The higher the
humidity ofthe surrounding atmosphere, the lower isthe rate oftranspiration.
3. Wind-airMovement: An increase in air movementincreases the rate oftranspiration.
4. Soil Moisture Availability: When moisture is lacking, plantscan begin to senesce and transpire lesswater.
5. Type of Plant
6. Light Intensity: An increase in lightintensity increases the rate oftranspiration.
IV.a. COMPUATIONOF EVAPOTRANSPIRATION
Determination of Evaporation:
1. Water-Budget Determination of MeanBasinEvapotranspiration:Assuming thatstorage and all items ofinflow
and outflow exceptevapotranspiration can be measured, the volume ofwater (usually expressed in units ofdepth)
required to balance the continuity equation for a basin represents evapotranspiration. Thereliability ofa water-
budgetcomputation hinges largely on the time increments considered.
Formula: E = P – R + ΔS
Where:
P = Precipitation
ΔS = Change in soil moisture storage
R = Runoff
2. Field-Plot Determinationof Evapotranspiration:
Field Experimental Plots
The different elements ofthe water budget(other than ET) in a known interval oftime are measured in special
experimental plots established in the field. ET is then estimated as:
Formula: ET = (P + I) – R – ΔS – Q
Where:
P = Precipitation
I = Irrigation Input
R = Runoff
Q = Ground water or ΔS = Change in soil moisture storagepercolation losses
3. LysimeterDetermination of Evapotranspiration
4. Estimating PotentialEvapotranspirationfrom MeteorologicalData
Potential evapotranspiration(PET): is the amountofwater thatwould be evaporated and transpired ifthere
were sufficientwater available.Itis higher in the summer, on lesscloudy days,and closer to the equator, because
of the higher levels ofsolar radiation thatprovidesthe energy for evaporation.
It is also higher on windy days because the evaporated moisture can be quickly moved from the ground or plant
surface, allowing more evaporation to fill its place.
11. Equations usedindeterminingevapotranspirationrate:
1. Penman’s Equation: Penman’sequation is based on sound theoretical reasoning and isobtained from a
combination ofthe energy balance and masstransfer approach
Formula:
Where:
m = Slope of the saturation vapor pressure curve(Pa K-1)
Rn = Netirradiance (Wm-2)
ρa = density ofair(kg m-3)
cp = heat capacity ofair (J kg-1 K-1)
ga = momentum surface aerodynamicconductance(ms-1)
δe = vapor pressure deficit(Pa)
λv = latentheat ofvaporization (J kg-1)
γ = psychrometricconstant(Pa K-1)
2. Blaney-Criddle Equation: isa method for estimating reference crop evapotranspiration. Itis recommended thatit
is used to calculate ET for periods ofone month or greater.
Formula: ETo = p (0.46 Tmean +8)
Where:
ETo = Reference crop evapotranspiration (mm/day) asan average for a period of1 month
T mean = mean daily temperature (°C)
p = mean daily percentage ofannual daytime hours
3. Thornthwaite Formula:Uses only mean monthly temperature along with an adjustmentfor day length.
Formula:
Where
PET = is the estimated potential evapotranspiration (mm/month)
= is the average daily temperature (degreesCelsius; ifthis is negative,use ) ofthe month being calculated
N = is the number ofdays in the month being calculated
L = is the average day length (hours)ofthe month being calculated
= is a heatindex which dependson the 12 monthly mean temperatures .
4. Lowry -Johnson Method: found outthatthere was a high correlationsbetween consumptiveuse and
accumulated degree-days duringthe growing season.
Formula: CU=o.00185 HE+10.4
Where:
CU= annual consumptive use,in inches;and
HE =effective heat, in degree-days above 32 °F
IV.b, ESTIMATING ACTUAL FROM POTENTIAL EVPOTRANSPIRATION
Some investigatorscontend thatevapotranspiration from homogeneousplotcontinues atan undiminished rate
until moisture content.
Other cite experimental results to show thatthe rate is approximately proportional to the remaining available later.
The rate is a complex function ofavailablewater butlimited to potential rate.
The assumption thatthe ratio of actual to potential evapotranspiration is promotionalto the remaining available
water.
A key elementin the design ofany irrigation system is the determination ofthe total water requirements.
The mostwidely used techniquesfor estimating consumptive userely largely on the transposition ofdata derived
from tanks, field plots or irrigated valleys.
IV.c. CONTROLLING EVAPOTRANSPIRATION
Mono-MolecularFilm Techniques: experiments were undertaken to reduce transpiration from plantsby mixing fatty alcohols
into the soil
GROUP 6-7: Sub-surface Water,GroundwaterandAquifers
I. Sub-Surface Water
II. Groundwater
III. Aquifers
IV. Equilibrium HydraulicofWells
V. Non-Equilibrium HydraulicofWells
VI. Utilizing Underground Water Reservoirs
VII. Seawater Intrusion
SUB-SURFACE WATER, GROUNDWATER AND AQUIFERS
I. SUB-SURFACE WATER
12. Soil water: 75% precipitation in temperate climatesenters surface ofsoil and becomes,
• Soil moisture – in unsaturated soil, or
• Ground water – in saturated soil and rock
Occurrence of Sub-Surface Water:
The saturated zone extends fromthe upper surface ofsaturation down to underlyingimpermeable rock. In the
absence ofoverlying impermeable strata, the water table or phreatic surface,forms the upper surface ofthe zone of
saturation.
Field Capacity: is defined as the moisture contentofsoil after gravity drainage iscomplete. The volumetricsoil moisture
contentremaining atFC is about15 to 25% for sandy soil, 35 to 45% for loam soils,and 45 to 55% for clay soils.
Colman– field capacity is essentially the water retained in soil ata tension about30 kPa.
For Veihmeyer and Hendrickson – found thatthe moisture equivalent, water retained in a soil sample,9.5mm
deep after being centrifuged, also nearly fine-grained soils.
Specific Yield: Ratio ofthe water which will drain freely from the material to the total volume ofthe formation
WiltingPoint: Represents the soil moisture level when plants cannotextractwater from soil.The water contentofa soil when
mostplants growing in thatsoil wiltand fail to recover their turgor upon rewetting. Volumetric soil moisture contentatthe
wilting pointwill have dropped to around 5 to 10% for sandy soils,10 to 15% in loam soils,and 15 to 20% in clay soils.
AvailableWaterCapacity: The total available water capacity (holding capacity) is the portion ofwater thatcan be absorbed
by plantroots.
Measurementof Soil Moisture: The standarddetermination ofsoil moisture is the loss in weightwhen a soil sample is oven-
dried.
- Tensiometer: Consists ofa porous ceramiccup which isinserted in a soil,filled with water, and connected to a
manometer. Itcan indicate soil-moisture tension from saturation to a tension ofabout100kPa.
Typical Moisture Values for Various Soil Types:
Percent Dry Weight Soil
Soil Type Field Capacity WiltingPoint
Available
Water
Density
Kg/m3 dry
Sand 5 2 3 1520
Sandy Loam 12 5 7 1440
Loam 19 10 9 1360
Silt Loam 22 13 9 1280
Clay Loam 24 15 9 1280
Clay 36 20 16 1200
Peat 140 75 65 400
Porosity: Theratio ofpore volume to the total volume ofthe formation.
OriginalPorosity:Itis the porosity whichexisted when the material wasformed.
Secondary Porosity: Results from fracturesand solution channels.
Permeability: isthe ability to transmitthe water
Permeameters: Itis a Laboratory equipmentused to measure the permeability.
II. GROUNDWATER
Groundwater: is water thatexists in the pore spaces and fracturesin rocks and sediments beneath the Earth’s surface. It
originates as rainfall or snow,and then movesthrough the soil and rockinto the groundwater system,whereits way back to
the surface streams,lakes, or oceans.
Origin ofGroundwater:
1. Meteoric Water: Groundwater derived from rainfall and infiltration w ithin the kind ofwater is calledmeteoric
water. The name impliesrecentcontactwith the atmosphere.
2. Connate Water:Groundwater encountered atgreatdepths in sedimentary rocks as a resultofwater havingbeen
trapped in sediments atthe time of their deposition
3. Fossil water: iffresh may be originated from the factofclimate change phenomenon.
4. Juvenile Water: formed chemically within the earth and broughtto the surface in intrusive rocks,occursin small
quantities. It is the water found in the cracks or crevicesor porousofrocks due to condensation ofsteam
emanating from hotmolten masses or magmasexisting below the surface ofthe earth. Some hotsprings and
geysers are clearly derived from juvenile water.
Water table / Phreatic surface - the level below which the ground is saturated with water.
• Perched water table:the top of a body ofground water separated from the main water table beneath itby a
zone thatis not saturated
Vadose Zone- the position atwhich the groundwater (the water in the soil's pores) is atatmospheric pressure.
Movement of Groundwater:
• Mostground water moves relatively slowly through rockunderground
• Because itmovesin response to differences in water pressure and elevation,water within the upper partofthe
saturated zone tends to move downward following the slope ofthe water table
• The direction ofgroundwater flow normally followsthe general topography ofthe land surface.
• Is described by Darcy’sLaw
Where:
Q= Volume ofwater
A = Cross sectional Area
K= Permeability or the HydraulicConductivity
h= vertical drop
l= flow distance
GroundwaterDischarge:
Effluent steams – Streamsintersecting the water table and receiving groundwater flow.
Spring – any natural occurrencewhere water flowsto the surface ofthe earth from below the surface
Type of springs:
a. Contactspring
b. Sinkhole Spring
c. Faulty Spring
d. Depression Spring
13. Groundwaterissues
• Recharge areas
• Inorganic pollutants
Soil trafficability
• Location ofroads and skid trails
• Operating seasons
GroundwaterProblems:
• Pesticides, Herbicides,Fertilizers: chemicalsthatare applied to agricultural crops thatcan find their way into
ground water whenrain or irrigation water leachesthe poisonsdownward into the soil
• Rain: can also leach pollutants from city dumps into ground-water supplies
• Heavy metals: such asmercury, lead,chromium, copper,and cadmium, together with household chemicalsand
poisons, can all be concentrated in ground-water suppliesbeneath dumps
• LiquidAnd Solid Wastes: fromseptic tanks, sewage plants,and animal feedlots and slaughterhousesmay
contain bacteria, viruses, and parasites thatcan contaminate ground water
• Acid Mine Drainage: from coal and metal minescan contaminate both surfaceand ground water
• Radioactive Waste: can cause the pollution ofground water due to the shallow burial oflow-level solidand liquid
radioactive wastes from the nuclear power industry
• PumpingWells:can causeor aggravate ground-water pollution
III. AQUIFERS
Aquifer: a body ofsaturated rock or sedimentthrough which water can move easily.Good aquifers include sandstone,
conglomerate, well-joined limestone, bodies ofsand and gravel, and some fragmental or fractured volcanic rockssuch as
columnar basalt
Aquiclude: A formation which containswater butcannottransmitrapidly enough to furnish a significantsupply to a well or
spring.
Auifuge:A formation thathas no interconnected openingsand cannothold or transmitwater.
Aquitards: when the porosity ofa rock is 1% or less and therefore retards the flow ofground water
Types of Aquifers:
1. UnconfinedAquifers – is one w/c a water table variesundulating form and in slope. Itis a partially filed aquifer
exposed to the land surface and marked by a rising and falling water table
2. Confine Aquifers– where groundwater is confined under pressure greater than atmospheric. They are also
called artesian aquifer. Itis an aquifer completely filled with pressurized water and separated from the land
surface by a relatively impermeable confining bed, such asshale
3. Leaky Aquifers – where a permeablestratum is overlain by semi-previousaquitard or semi- confining layer.
Characteristics of Aquifers:
Transmissivity (T) is the rate offlow through a vertical strip ofaquifer (thickness b) ofunitwidth under a unit
hydraulic gradient
Storage Coefficient (S) is storage change per unitvolume ofaquifer per unitchange in head
Radius of Influence (R) for a well is the maximumhorizontal extentofthe cone ofdepression when the well is in
equilibrium with inflows
Pump Wells/Observation Wells : are used to determine the properties ofan aquifer
• The number ofwells depends on testobjectives and available resources for testprogram.
– Single well can give aquifer characteristics(T and S). Reliability ofestimatesincreaseswith additional
observation points.
– Three wells atdifferentdistances are needed for time-distance analysis
– No maximum number because anisotropy,homogeneity,and boundariescan be deduced from
response
IV. EQUILIBRIUMHYDRUALICOF WELLS
Well - a hydraulicstructure thatis designed and constructed to permiteconomicwithdrawal ofwater from an aquifer
Cone of depression - occursin an aquifer when groundwater is pumped from a well.
Drawdown- depressed water level (or potentiometric surface)
Formation ofa cone of depressionin the water table:
Equilibrium flow to well: Occurs when aquifer is pumped for a very long time.Water level (or potentiometricsurface) does
not change with time. We can use darcy’s law to calculate “K” OR“T” ifweknow Q and hydraulicheadsattwo locations(i.e.
called “pumping test”)
Theim Equation:
14. V. NON- EQUILIBRIUMHYDRAULICOF WELLS
Well Hydruialics: A water well is a hydraulic structure thatis designed and constructed to permiteconomicwithdrawal of
water from an aquifer
Water well construction includes:
Selection ofappropriate drilling methods
Selection ofappropriate completion materials
Analysis and interpretation ofwell and aquifer performance
Theis Solution: The Theis (1935) solution (or Theis non-equilibriummethod) isuseful for determining the hydraulicproperties
(transmissivity and storativity) ofconfined aquifers.
Formula:
where:
s = drawdown [L]
Q = pumping rate [L³/T]
T = transmissivity [L²/T]
R = radial distance from pumping well to observation well [L]
S = storativity [-]
t = elapsed time since startofpumping [T]
V. UTILIZINGUNDERGROUNDWATERRESERVOIR
Safe yield (or optimal yield): Amountofwater thatcan be withdrawnfrom a groundwater basin annually withoutproducing
an “undesired” result
- withdrawal in excessofsafe yieldis known as overdraft
- undesired results
- mainly depletion ofreserves
- also intrusion ofwater ofundesirable quality
- contravention ofwater rights
- deterioration of economic advantagesofpumping
- excessivedepletion ofstream flow by induced infiltration and subsidence
Overdraft: removal ofwater beyond safe or normal suggested amounts from reservoirs
- Safe yield has to be balanced againstsocioeconomicdemand for the water
- At sometimes itmay be necessary to “mine” groundwater to depletion
- Other cases may call for complete conservation
- Some have suggested thatsafe yield is the annual extraction ofgroundwater thatdoes notexceed annual recharge
- Removal ofwater changesregime/recharge
GroundwaterExtraction:
Groundwater is the main source of
- Drinking water in many coastal areas, and extraction has increased over time.
- Groundwater extraction can also lead to well contamination by causingupwelling, or upcoming, ofsaltwater from
the depths ofthe aquifer.
Time effects in Groundwater:
Flow rates in the groundwater are normally extremely slow, and considerable time may be involved in
groundwater phenomena. A critical lowering ofthe water table adjacentto a coastmay notbring immediate saltwater intrusion
because ofthe time required for the saltwater to move inland.
RetainingthePotential of UndergroundReservoirs:
ArtificialRecharge: Iftransmissibility is nota problem,the yield ofan aquifer may be increased artificially by introducing
water into it. In mostcases this is equivalentto reducing the surface runofffrom the area.
The methodsemployed for artificial recharge are controlled by the geologic situationof anarea and byeconomic
considerations. Some possible methods include:
1. Storing floodwaters in reservoirsconstructed over permeable areas.
2. Storing floodwaters in reservoirsfor later release into the stream channel atrates approximating the percolation
capacity ofthe channel.
3. Diverting stream flow to spreading areas located in a highly permeable formation.
4. Excavating recharge basins to reach permeable formations.
5. Pumping water through rechargewellsinto the aquifer.
6. Over irrigating in areas ofhigh permeability.
7. Construction ofwells adjacentto a stream to induce percolation from stream flow.
VI. SEAWATERINTRUSION INAQUIFERS/UNDERGROUNDWATER RESERVOIRS
Saltwater intrusion is the movementofsaline water into freshwater aquifers,which canlead to contamination ofdrinking
water sourcesand other consequences.
15. Ghyben-HerzbergRelation:
Causes of SaltwaterIntrusion:
1. Canals: The construction ofcanalsand drainage networkscan lead to saltwater intrusion. Canals provide
conduits for saltwater to be carried inland, as doesthe deepening ofexisting channelsfor navigation purposes.
2. Drainagenetworks: Drainage networks constructed to drain flatcoastal areas can lead to intrusion by lowering
the freshwater table, reducing the water pressure exerted by the freshwater column.
Effects of Saltwater IntrusiononWaterSupply:
• Many coastal communitiesare experiencing saltwater contamination ofwater supply wells,and this problemhas
been seen for decades.
• The consequencesofsaltwater intrusion for supply wellsvary widely,dependingon extentofthe intrusion, the
intended use ofthe water, and whether the salinity exceedsstandardsfor the intended use.
GROUP 8: Run-Off
I. Surface Run-Off
II. Storm and Storm Run-Off
III. SnowmeltRun-Off
RUN-OFF
I. SURFACE RUN-OFF
Surface runoff (also known as overland flow) isthe flow ofwater thatoccurs when excess water from rain, or other sources
flows over the earth's surface.Thismightoccur because soil issaturated to full capacity.
Pollutants thatare carried to streams and lakes by surface runoffare a major contribution to water pollution.
Wash off materials include sediment,mineral salts,heavymetals, nutrients,Pesticides,biodegradable organics, and microbial
pollution.
Transport of Materials throughthe SoilProfile
A. Fine-TexturedSoils withHighClay Content
- Do notdrain well
- Retain large amounts ofwater for long periods
- Aeration in these soils is limited
- Processes such asorganic decomposition, ammonia, volatilization,and nitrification are retarded
B. Coarse-Textured Soils
- Conductlarge quantities ofair and water, and oxidative processesare
- encouraged
- At the same time the rates ofevaporation, lateral transmissibility
- Percolation are higher.
As a rule, passage throughthe soilprofile results inpurificationof waterbecauseof:
- Adsorption: process entailsthe removal ofchemicals atsolution and retention on the surface of soil particles by
chemical or physical bonding. The quantity ofa chemical thatcan be adsorbed by soil dependson concentration
of adsorbate and soil temperature. Adsorption usually assuresthatchemicals remain in the soil long enough for
processes such asdecomposition and plantuptake to occur.
- Volatilization: Thelossofa chemical from the soil-water system by vaporization into the atmosphere.Certain
chemicals move to the soil surface by diffusion or massflow.Volatilization can remove large quantities of
chemicals such as ammonia and pesticidesfrom the soil, particularly during the initial period after application.
- Decompositionordegradation: Organicmaterials in the soil break down to form carbon dioxide,water,
inorganic elements suchas nitrogen and chloride. Degradation rates depend on soil temperature, moisture,
strength of binding by soil, soil type, and soil microorganisms. In many soilsthe combinedprocesses of
adsorption and degradation can remove 99 percentor more ofthe organic contentofheavily polluted water.
- Nitrification:The two-step processin which ammonia (NH₂) or ammonium (NH₄) is oxidized to Nitrite (NO₂) and
then to nitrate (NO₃). This is an importantreaction in the soil-water system becausea largely immobileform of
nitrogen (ammonia) is converted to a highly mobile form (nitrate) whichmay be absorbedby plants or lostby
leaching and denitrification.
- Denitrification: involves the conversion ofnitrate to gaseous nitrogen speciessuch as element nitrogen gas,
nitrous oxide, or nitric acid
- Plant uptake: In soils with heavyvegetal cover,the major mechanismfor removal ofinorganicNitrogen and
phosphorous is uptake by plants.Flow of water toward roots in response to transpiration results in the transportof
non-adsorbed nutrients with high solubilities,such as nitrate. Diffusion is the mostactive mechanismsfor
transporting adsorbed species (e.g. phosphorous,potassium, iron) to plantroots
II. STORM AND STORM RUN-OFF
Storm water iswater originates during precipitation.
16. Characteristics of Storm:
1. Rainfall amount
2. Rainfall intensity
3. Rainfall duration
Storm Analysis:
In any statistical correlation, itis extremely importantthatthe basic data be as consistentand reliable as possible.
The consistency testfor precipitation data should be applied whenever the normal annual precipitation varies appreciably over
the catchment.
Runoffalso depends upon rainfall amount, intensity,and duration, butfor basins of250km² or more,an average
intensity as reflected by amountand duration is usually adequate.
Estimating the Volume Of Storm Runoff
Despite the complex nature ofthe rainfall-runoffprocess, the practice ofestimating runoffas a fixed percentage of
rainfall is the mostcommonly used method in design ofurban storm-drainage facilities,highway culverts, and many small
water-control structures.
Computer simulation techniquesoffer the mostreliable method ofcomputing runofffrom rainfall because they
permita relatively detailed analysis using shorttime intervals.
1. Infiltration ApproachTo Runoff Estimates:The infiltration approach thatthe surface runofffrom a given storm
is equal to that portion which is notdisposed ofthrough:
- interception and depression storage
- evaporation during storm
- infiltration
If the rainfall intensity is alwaysabovethe infiltration-capacity curve the problemis merely one ofdefining the
infiltration curve which is a function ofthe antecedentmoisture conditions.
2. Infiltration Index: Difficulties with the theoretical approach to infiltration led to the use ofinfiltration indexes. The
simplestofthese is the ф index, defined as thatrate ofrainfall above which rainfall volume equalsthe runoff
volume.
Formula:
Where:
W = average infiltration rate during the time rainfall intensity exceedsthe capacity rate
P = total precipitation corresponding to t
t = time during which rainfall intensity exceedsinfiltration capacity
F = total infiltration
Qs = surface runoff
S = effective surface retention
Initial Moisture Conditions
The quantity ofrunofffrom a storm depends on the moisture conditions ofthe catchmentatthe onsetofthe storm.
In humid areas, where streamsflow continuously, groundwater discharge atthe beginning ofthe storm has been found to be a
good index to initial moisture conditions.
The rate at which moisture is depleted from a particular basin under specified meteorological conditions is roughly
proportional to the amountin storage. In other words, the soil moisture should decrease logarithmically with time during
periods ofno precipitation.
It = I0kt
Where I0 is the initial value ofantecendent-precitationindex, It isthe reduced value t days later,and k is a
recession factor ranging normally between0.85 and 0.98. letting t is equal one gives…
I1=kI0
The index for any day is equal to thatofthe previous day multiplied by the factor k. ifrain occur on any day,the
amountofrain is added to the index.
III. SNOWMELTRUN-OFF
Estimating Snowmelt Run-off:
The storage and melting ofsnow plays an importantrole in the hydrology ofsome areas. In such areas, reliable
predictions ofthe rate ofmeltand release ofliquid water from a snowpackare requisite to the efficientdesign and operation of
water resourcesprojectsand the issuance ofriver forecasts and warnings
Physics of Snowmelt
Snowmeltand evaporation (including sublimation) are both thermodynamicprocesses, and both are amenable to
the energy-balance approach in applying the energy balance to a snowpack, the rate meltand release ofliquid water are
primary concern.Heatexchangewith the soil is more importantwhen treating snowmeltthan in the case oflake evaporation,
but the exchange atthe snow-air interface dominates the meltprocess.
Heat exchange betweena snowpackand the atmosphere is also affected by conduction, convection,
condensation and evaporation. Although itis readily shown thatconduction in air is very small,convective exchange can be an
importantfactor.
The transfer rates by both processes are proportional to windvelocity v.Since the latentheatofvaporization is
about7.5 times the latent heatof fusion, condensation ofunitdepth ofwater vapor on the snow surfaceproduces8.5 unitsof
liquid water, including condensate.
The two processescanbe described by similar equations for melt:
Mh = kh (Ta- T0) v
Me=ke (ea - e0 ) v
Raindrop temperatures correspond closely to the surface wet-bulb temperature. As the drops enter a snowpack,
their temperature is reduced to 00C and an equivalentamountofheatis imparted to the snow.
Melt (millimeters) from rainis givenby
Mr = 4.19
Where:
P= is the rainfall in millimeters,
Tw =is the wet-bulb temperature in degrees Celsius,
334 =is the latentheat of fusion in joules per gram,
4.19= is the specific heatofwater in joules per gram per degree Celsius.
Estimating Snowmelt Rates and Consequence Runoff
Air temperature is the single mostreliable index to snowmelt. Itis completely reflects radiation,wind,and humidity
that residual errors are usually notmaterially correlated with these factors. Since snowmeltdoes notoccur with temperatures
appreciably below freezing the temperature data are commonly converted to degree-daysor degree-hoursabove some base.
A variety ofdifferentrelationships have been mean temperature of100C and a minimumtemperature below
freezing suggested for forecasting snowmelt. Mostcommonly, however, a degree-day factor or the ratio ofsnowmeltto
concurrentdegree-daysis utilized.Ifthe actual rate of snowmeltwere known,the degree-day factor mightwell be substantially
17. constant. Actually, the rate ofrunoffmustbe used in lieu ofrate ofmelt, and a plot ofaccumulated snowmeltrunoffversus
accumulated degree-days tends toward an olive shape.
Snow Survey
The application ofsnow-survey data to the preparation ofwater-supply forecasts is appealing because ofthe
rather simple relation envisioned.Ifthe seasonal flow results primarily from melting a mountain snowpack, measurements of
the water in the snowpackbefore meltbegins should indicate the volume ofrunoffto be expected.
Although there is good correlation between snow-survey data and seasonal runoff, itis now recognizedthat
reliable water-supply forecasts cannotbe made from snow surveys alone.
Runoff subsequent tothe surveysis alsodependent upon:
1. Groundwater storage
2. Antecedentsoil- moisture deficiency
3. Precipitation during the runoff period.
It has been found that snow-survey data can bestbe treated as an independentmeasure ofwinter precipitation in a
multiple, or as a check on simulated snow cover.
GROUP 9: Erosion, Weathering and Sedimentation
I. Erosion, Weathering and Sedimentation and its Effects ofthe River Basin
II. Streams and Stream Patterns
III. Flood Plains
IV. Erosion Process
V. Sedimentation
EROSION, WEATHERING AND SEDIMENTATION
I. EROSION,WEATHERING AND SEDIMENTATION ANDITS EFFECTS OF THE RIVERBASIN
Definitionof Terms:
1. Sediment:settled matter atbottom ofliquid.
2. Catchment: rainwater receptacle. A structure, reservoir, or container for collecting rainwater.
3. Reservoir: lake or tank for storing water.
4. Erosion isa process ofdetachmentand transportofsoil particles by erosive agents
Factors That Affect Productionof Sediments:
1. Climate
2. Soil Type
3. Land Use
4. Topograpy
5. Presence ofReservoir
The rate at which the capacity of a reservoiris reduced by sedimentationdependson:
1. The quantity ofsedimentinflow.
2. The percentage ofthis inflow trapped in the reservoir
3. The density ofthe deposited sediment.
Physical Descriptors of Catchment Form:
- Stream Order
- Drainage density
- Length of overland flow
- Area relations
- Basin shape
Stream Order:
Horton suggested a classification ofstream order as a measure ofthe amountbranching within a basin.
Law of Stream Numbers: relates number ofstreamsoforder to the number in the nextlowestorder.
Law of Stream Lengths
Law of Stream Areas
Law of Stream Slopes
DrainageDensity: the total length ofstreams within a catchmentdivided by the drainage area defines drainagedensity,the
length of channels per unitarea.
D = total L/A
Characteristics of high and low-densitydrainage basins:
1. High density:(+2kmper km2)Impermeable land surface,steep slopes,limited vegetation cover,limited rainfall,
gentle slopes, large channel frequency (tributaries).
2. Low density (-2kmper km)Permeable rock, for example,chalk, much vegetation cover,limited rainfall, gentle
slopes, lower channel frequency.
Length of OverlandFlow: The average ofoverland flow may be approximated by,
18. Area Relations: Data for a number ofthe larger rivers ofthe world seem to conformto the equation
Basin Shape:the shape ofa catchmentaffects the stream flow hydrograph and peak-flow rates.
Descriptors of Catchment Release:
• Channel slope:the slope ofthe channel affects velocity offlow and mustplay a role in hydrographshape.
• Land slope: The slope ofthe ground surface is a factor in the overland flow processand hence a parameter of
hydrologic interest,especially on small basinswhere the overland flow processmay be a dominantfactor in
determining hydrographshape.
• Area-elevationdata: an area-elevation ( or hypsometric ) curve can be constructed by planimetering the area
between contours on a topographic map and plotting the cumulative area above (or below) a given elevation
versus thatelevation
• Aspect: The aspectofa slope is the direction toward which the slope faces.
II. STREAMS ANDSTREAMPATTERNS
Stream: is body ofwater confined within a bed and streambanks. Branch,beck,burn, gill,lick, rivulet, streamage,wash or
run. Streams are vital geologicagents.Streamscarry mostofthe water thatgoes from land to sea (essential partofthe
hydrologic cycle). Streams transportbillions oftons ofsedimentto the oceans each year.
Load: is the sedimentand dissolved matter the stream transports. Load is expressed in kilogramsper cubicmeter. Itis
dissolvedmatter generally doesnotaffectstream behavior.
Types of Stream:
1. Brook: Stream smallerthan creek, shallow and it’s bed composed ofprimarily rocks
2. Creek: small to mediumsized natural stream, a small inletor bay narrower than a cove
3. River: A large natural stream which may be a waterway,usually freshwater flowing towardsthe sea, lakes or
ocean.
4. Tributary: Contributory streamwhich doesnotreach the sea butjoins another river(parentriver) also called a
branch
Patterns of Stream:
1. MeanderingStream: characterized as an irregularwaveform. Flows in large,moreor less symmetrical loops, or
bends. Usually occur in a region ofa river channel with shallow gradients, a well-developed floodplain & cohesive
floodplain material.
Median length-about1.5 timesthe valley length
Wavelength- rangesfrom 7-11 timesthe channel width
Radius of Curvature- 2-3 timesthe channel width
2. Braided Stream: Consistofmany intertwined channels(anabranches) separated by islands. Tendto be very
wide and relatively shallow with coarse bed material. Occur whenbed material is coarse and heterogeneous,
banks are easily erodible and hasa high stream gradient.
Total width of Branches- 1.5 to2 times thatof an unbraided
3. Straight Stream: defined as one with a sinuosity oflessthan1.25 are found in the mosttectonically incised /
active areas atalluvial fans.
III. FLOOD PLAINS
Flood Plains: An area ofland adjacentto a stream or river thatstretches from the banksofits channel to the base ofthe
enclosing valley walls.
Formation-made by meander eroding sidewaysas they travel downstream.When a river breaksits banksand floods,it
leaves behind layers ofalluvium(silt).these gradually build up to create the floor ofthe floodplain
IV. EROSIONPROCESS
The Erosion Process:
1. Splash Erosion: starting with the detachmentofsoil particles by impactofraindrops
2. Sheet Erosion: relatively uniformdegradation ofthe soil
3. Gully Erosion: Dislodge soil is carried by the flowing water
4. Mass Movement: Breakdown and transportofweathered materials
5. Landslide: Groundmovementsuch asrockfallsdeep failure ofslopes & shallow debrisflow
The Mechanism of Erosion:
1. Detachment
2. Transport
3. Deposition
Erosion by RunningWater
Erosion by water before a distinct channelhas formed occurs intwo ways:
– By impactas raindropshitthe ground.
– By overland flow during heavy rains, a processknown assheeterosion.
The effectiveness ofraindropsand overland flows in eroding the land is greatly diminished by a protective cover ofvegetation.
Factors Controlling Erosion:
1. Rainfall Regime
2. Vegetal Cover
3. Soil Type
4. Land Slope
Erosive Agents:
1. Raindrop impact
2. Overland flow surface runofffrom rainfall
3. Bed and bank turbulence in streams
Effects of Erosion:
1. Degrades soil resource
a. Reduces soil productivity
b. Reduces soil organicmatter
c. Removesplantnutrients
2. Causes downstream sedimentation
3. Produces sedimentwhich isa pollutant
4. Produces sedimentthatcarries pollutants
V. SEDIMENTATION
Sediment Transport: mechanics ofsedimenterosion,transport,and deposition by water.
Sediment is transportedinrivers and streams by two components:
1) Suspendedload:sedimentmovesthrough the fluid
2) Bed load: sliding,rolling,saltating
Effects of Scarce/Abudance ofSediments:
19. A. Problems with toomuch sediment
– Raised flood profiles
– Reduced underwater light
– Decreased capacity ofhydraulicstructures
B. Problems with toolittle sediment
– Incision (channel lowering)
– Delta loss
– Scour athydraulic structures
Sediment Size:
Clay < 0.004 mm - Clay and siltare considered fine sediments
Silt 0.004 - 0.0625 mm
Sand 0.0625 - 2 mm - Sand and gravel are considered coarse sediment
Gravel > 2mm
GROUP 10: Hydrology andWater Quality
I. Water Quality
HYDROLOGY AND WATER QUALITY
I. WATER QUALITY
Falling precipitation carries gasesand particulate matter from the atmosphere. Asitstrikes the ground itmay
dislodge sedimentwhich overland flow transports to a stream together with material dissolved from the land surface.Infiltrating
water undergoes chemical exchange with the soil, givingup somematerialsand dissolving others.Thussurfacerunoff,
interflow, and groundwater have chemistriescharacteristic ofthe rocks and soils encountered along their paths offlow.
Hydrologic factors play a major role in determining the concentration, rate ofmovement, and final disposition of
pollutants. Prediction ofwater quality and ofthe changeswhich mightresultfrom control measuresrequiresan understanding
of the hydrologic, physical,chemical and biological processesin water bodies.
Unique Property of Water:
- SolventAction
- Dissociation
- Transparency
1. Solvent Actionof Water:
The polarity ofcharge in the water molecule favorsthe disruption ofionic crystalsby reducing the interionic
attractive forces. Sodiumchlorideand salts ofpotassiumare readily dissolved in water. Water can alsosolvate separated
ions.
- Solvationentails the surroundingofcharged solute particlesby solventmolecules in response to attractive
forces.
- Cations, positively charged ions, are effectively solvated by compounds ofelementsin the firstrow ofthe periodic
table that have unshared electron pairs.
- Anions,negatively charged ions, are easily solvated by a solventin which a strongly electronegative element
such as oxygen is bonded to hydrogen.
- Water molecules are capable offorming hydrogen bondsto molecules containing oxygen atoms
2. Disassociation: Water is notonly a solventfor other substances butis itselfcapableofdissociating into two
charged ions. Hence water acts asboth a base and an acid
.
3. Transparency: Solar radiation arriving atthe earth’s surface is characterized by wavelengths between0.3 and
1.3 µm. Nearly all radiation outside the range ofvisible wavelengths (0.4 to 0.8 µm) isabsorbed in the firstmeter
of water. Radiation with wavelengths greater than 0.8 µm (infrared) results in significantheattransfer to water.
The various spectral bandsofvisible radiation are absorbed differentially.The red componentpenetrates no more
than 4m of water while someofthe blue componentpenetrate 70m or more.
Beer’s Law:
Fomula: qz = q0e ^ nz
Where:
qz – lightintensity atdepth z
q0 – intensity oflightat the water surface
n – various wavelengths
Quality of Precipitation:
Precipitation contains dissolved substances largely determined by the air quality and wind patterns ofthe region.
In areas where there is heavy air pollution the atmosphere is a complex chemical systemcontrolled by dozensofchemical
and photochemical transformations
Atmospheric water in such areasaccumulates carbon dioxide,nitrates, and inorganic formsofphosphorusand
sulfur. This moisture becomes chemical-laden precipitation hundreds ofkilometers from the original pollution source.
Reported annual deposition rates ofnitrogen and phosphorus from precipitation range from 5 to 10 kg/hectare
and 0.5 to 0.6 kg/hectare, respectively.
Data from areas relatively unaffected by human activity indicate thatmuch ofthe in-stream burden ofnitrogen
comes from precipitation, while only a small portion ofthe in-stream burden ofphosphorus is precipitation-borne
Water Temperature:
The density and viscosity ofwater, and the solubility and diffusivity ofgas in water are dependentupon water
temperature. Both water density and viscosity decrease as temperature increase.Even the slightchanges in density can result
in stratification of lakes and impoundments, resulting in the water quality problemsoutlined in the preceding section. As
temperature increase, the ability ofwater to carry suspended materialsdecrease according to stokes’ law.
The velocity ofwater below which particlessettle outofsuspension,the settling velocity,is directly related to
water density and inversely proportional to viscosity. The netresultofan increase in tem (above 4°C is an increasein settling
velocity and increased sedimentation in sludge deposits.
All biochemical reactionsare sensitive to variations in temperature. Organisms consistofheat-sensitiveproteins
and enzymeswhich control the growth,respiration, reproduction, and death rate ofeach species.Within the range oftolerance
for a species. An increase on temperature increase metabolicreaction rates. A generalized expressionfor the variation ofa
reaction-rate constantwith temperature has been derived from the van’thoff-arrhenius law.
Biochemistryof Natural Water:
20. The discussionofnonliving material isdivided categorically into inorganicand organicchemicals.Organicchemicals are
further divided into biodegradable and non-biodegradable substances.
- Inorganicchemicals: the inorganic chemicalsofmostimportance to the aquatic environmentinclude dissolved
oxygen, free hydrogen ions,and compounds ofcarbon,nitrogen and phosphorus. The survival ofmany aquatic
organisms and the aerobic decomposition ofwaste materialsdepend on the maintenance ofadequate dissolved
oxygen in water.
- Organic chemicals: Organic materials - found in the aquatic environmentinclude natural compounds suchas
sugar, starch, fat, and oil and synthetic compounds suchas surfactants, phenols,and pesticides.
o Biodegradable - is the decay or breakdownofmaterials thatoccurswhen microorganisms usean
organic substance as a source ofcarbon and energy.
o Non-biodegradable
Ph of Water: The availability offree hydrogen ions in water is measured by the рH, defined in terms ofhydrogen-ion
concentration.
- Pure water has ph of7
- Lower than 7 acidic water
- Higher then 7 alkaline water
Acid in Natural Water: Acid in natural waters combineswith the basic carbonate ion to form bicarbonate. Ifexcess acidity
remains after neutralization ofall carbonate, bicarbonate is drivenbackinto the carbonic acid formand, and finally carbonic
acid breaks down into water and free carbon dioxide.