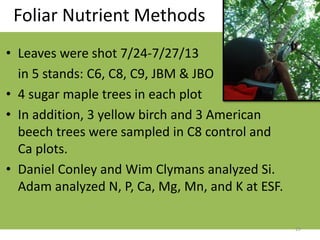
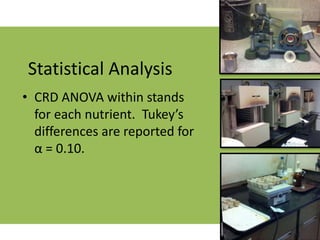
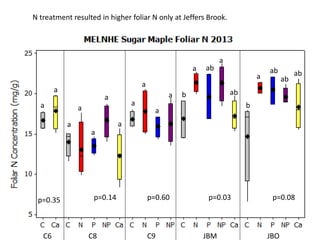
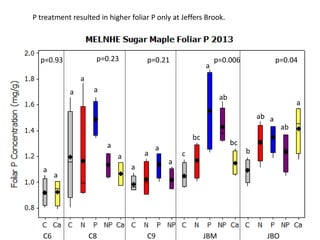
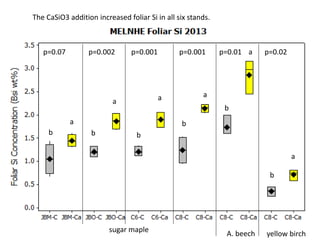
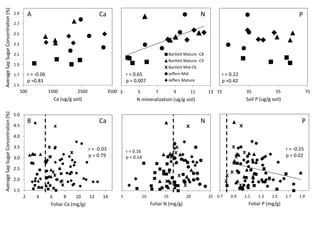
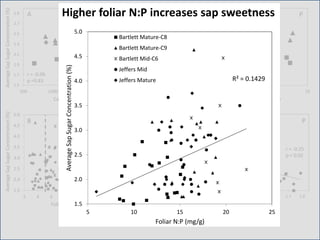
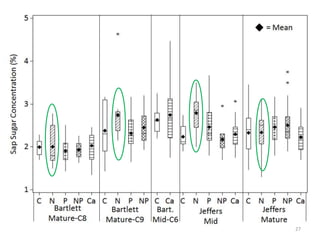
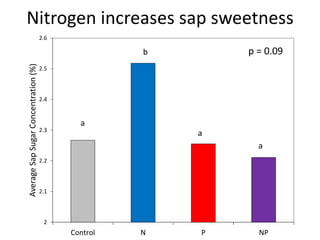
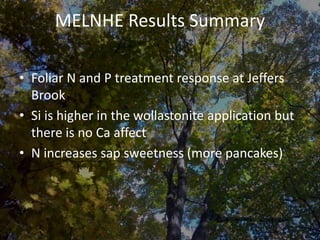
Four years in: Finally a treatment response in
the MELNHE stands
Adam Wild
Research Assistant, SUNY ESF
Lisa Carper
Student, A. Crosby Kennett High School
Multiple Element Limitation in
Northern Hardwood Ecosystems
Multiple Element Limitation in Northern
Hardwood Ecosystems (MELNHE) sites
Map by: Matt Vadeboncoeur
9 Stands (C1-C9)
24-131 years
since harvest
2 Stands (HBM & HBO)
44 & 104 years since harvest
Separate CaSiO3 & control plot
2 Stands (JBM & JBM)
29 & 114 years since
harvest
Map by: Matt Vadeboncoeur
4-5, 50m x 50m plots per stand
3
• 5 treatments –
- N as NH4NO3 – 30 kg N/ha/yr
- P as NaH2PO4 – 10 kg P/ha/yr
- N & P as above
- Ca as CaSiO3 – 1150 kg Ca/ha
- Control
• Application began 2011
Fertilization
4
Soil pH after a wollastonite Addition
Soils were tested in 1998 (pre-treatment) and in 2000
and 2002 (post-treatment)
pH results from Watershed 1 (Cho et al. 2010)
Hypothesis
pH will increase in
organic soil
Methods
• Soils collected in 2012 from
C1, C6, C8 by Adam
• Re-sampling in 2014 from C1,
C6, C8, HBCa, JBM, JBO
Collection Methods
• 2 soil pits in the Ca plot buffer
• 2 soil pits outside the Ca plot for controls
• Depths
 Oe
 0 cm
 5 cm
 10 cm
 15 cm
 20 cm
 25 cm
 30 cm
Soil pH
Sampling
2012
C6 C1
C8
2014
C6
C8
2014C6
C8
pH is higher at
0 cm in C6
pH is higher in
the Oe at C8
Foliar Results
Foliar Nutrient Methods
• Leaves were shot 7/24-7/27/13
in 5 stands: C6, C8, C9, JBM & JBO
• 4 sugar maple trees in each plot
• In addition, 3 yellow birch and 3 American
beech trees were sampled in C8 control and
Ca plots.
• Daniel Conley and Wim Clymans analyzed Si.
Adam analyzed N, P, Ca, Mg, Mn, and K at ESF.
15
16
• CRD ANOVA within stands
for each nutrient. Tukey’s
differences are reported for
α = 0.10.
Statistical Analysis
C6 C8 C9 JBM JBO
p=0.08p=0.03p=0.60p=0.14p=0.35
b
a ab
ab
ab
a
b
ab
ab
a
a
a
a
a
a
a
a
a
a
a
a
N treatment resulted in higher foliar N only at Jeffers Brook.
C6 C8 C9 JBM JBO
p=0.04p=0.006p=0.21p=0.23p=0.93
b
ab
ab
a
a
a
ab
c
bc
bc
a
a
a
a
a
a
a
a
a
a
a
P treatment resulted in higher foliar P only at Jeffers Brook.
C6 C8 C9 JBM JBO
p=0.06p=0.93p=0.83p=0.01p=0.55
ab
a
ab
ab
b
a
a
a
a
a
a a
a
a
a
ab
cabc bc
a
a
There were some significant treatment effects on foliar K but they were not consistent.
C6 C8 C9 JBM JBO
p=0.18p=0.59p=0.39p=0.12p=0.41
a a
a
a
a
a
a
a
a
a a
a a
a
a
a
a
a
a
a
a
There were no treatment effects on foliar Mg.
C6 C8 C9 JBM JBO
p=0.006p=0.02p=0.21p<0.001p=0.01
a
ab
b
b
b
a
b
ab ab
ab
a
a
a
a
a
ab
bc
c
c
a
b
Ca addition increased foliar Mn in C6, C8, and JBO.
C6 C8 C9 JBM JBO
p=0.07
a
a
a
a
a
p=0.7p=0.63p=0.06p=0.99
a
a
a
a
a
a
a
a
a
a
a
a
aa
a
There were no treatment effects on foliar Ca.
sugar maple
A. beech yellow birch
p=0.001 p=0.001 p=0.01 p=0.02p=0.07 p=0.002
b
a
b
a
b
a
b
a
b
a
b
a
The CaSiO3 addition increased foliar Si in all six stands.
15 35 55 75
Soil P (ug/g soil)
r = 0.22
p =0.42
1.5
1.7
1.9
2.1
2.3
2.5
2.7
2.9
500 1500 2500 3500
Ca (ug/g soil)
r = -0.06
p =0.83
3 5 7 9 11 13
N mineralization (ug/g soil)
Bartlett Mature -C8
Bartlett Mature -C9
Bartlett Mid-C6
Jeffers Mid
Jeffers Mature
r = 0.65
p = 0.007
AverageSapSugarConcentration(%)
Ca N P
1.5
2.0
2.5
3.0
3.5
4.0
4.5
5.0
2 4 6 8 10 12 14
Foliar Ca (mg/g)
r = -0.03
p = 0.79
0.7 0.9 1.1 1.3 1.5 1.7 1.9
Foliar P (mg/g)
r = -0.25
p = 0.02
5 10 15 20 25
Foliar N (mg/g)
r = 0.16
p = 0.14
AverageSapSugarConcentration(%)
Ca N P
A
B
R² = 0.1429
1.5
2.0
2.5
3.0
3.5
4.0
4.5
5.0
5 10 15 20 25
AverageSapSugarConcentration(%)
Foliar N:P (mg/g)
Bartlett Mature-C8
Bartlett Mature-C9
Bartlett Mid-C6
Jeffers Mid
Jeffers Mature
Higher foliar N:P increases sap sweetness
27
2
2.1
2.2
2.3
2.4
2.5
2.6
Control N P NP
AverageSapSugarConcentration(%)
p = 0.09
a
a
a
b
Nitrogen increases sap sweetness
MELNHE Results Summary
• Foliar N and P treatment response at Jeffers
Brook
• Si is higher in the wollastonite application but
there is no Ca affect
• N increases sap sweetness (more pancakes)
• Tree growth?
• Snails?
• Respiration?
• Microbes?
• Seedlings?
• Sapflow?
Will we see a treatment response in…
Acknowledgments
• Daniel Conley
• Wim Clymans
• Matt Vadeboncoeur
• Mark Green
• Ruth Yanai
• Michele Pryun
• Shoestring Crews
Citations
• Choe, Y. Driscoll, C.T. Johnson, C.E. Siccama, T.G. 2010. Chemical
changes in soil and soil solution after calcium silicate addition to a
northern hardwood forest. Biogeochemistry

Shoestring2014 1-4 years in

  • 1.
    Four years in:Finally a treatment response in the MELNHE stands Adam Wild Research Assistant, SUNY ESF Lisa Carper Student, A. Crosby Kennett High School Multiple Element Limitation in Northern Hardwood Ecosystems
  • 2.
    Multiple Element Limitationin Northern Hardwood Ecosystems (MELNHE) sites Map by: Matt Vadeboncoeur 9 Stands (C1-C9) 24-131 years since harvest 2 Stands (HBM & HBO) 44 & 104 years since harvest Separate CaSiO3 & control plot 2 Stands (JBM & JBM) 29 & 114 years since harvest
  • 3.
    Map by: MattVadeboncoeur 4-5, 50m x 50m plots per stand 3
  • 4.
    • 5 treatments– - N as NH4NO3 – 30 kg N/ha/yr - P as NaH2PO4 – 10 kg P/ha/yr - N & P as above - Ca as CaSiO3 – 1150 kg Ca/ha - Control • Application began 2011 Fertilization 4
  • 5.
    Soil pH aftera wollastonite Addition
  • 6.
    Soils were testedin 1998 (pre-treatment) and in 2000 and 2002 (post-treatment) pH results from Watershed 1 (Cho et al. 2010)
  • 7.
  • 8.
    Methods • Soils collectedin 2012 from C1, C6, C8 by Adam • Re-sampling in 2014 from C1, C6, C8, HBCa, JBM, JBO
  • 9.
    Collection Methods • 2soil pits in the Ca plot buffer • 2 soil pits outside the Ca plot for controls • Depths  Oe  0 cm  5 cm  10 cm  15 cm  20 cm  25 cm  30 cm
  • 10.
  • 11.
  • 12.
  • 13.
    2014C6 C8 pH is higherat 0 cm in C6 pH is higher in the Oe at C8
  • 14.
  • 15.
    Foliar Nutrient Methods •Leaves were shot 7/24-7/27/13 in 5 stands: C6, C8, C9, JBM & JBO • 4 sugar maple trees in each plot • In addition, 3 yellow birch and 3 American beech trees were sampled in C8 control and Ca plots. • Daniel Conley and Wim Clymans analyzed Si. Adam analyzed N, P, Ca, Mg, Mn, and K at ESF. 15
  • 16.
    16 • CRD ANOVAwithin stands for each nutrient. Tukey’s differences are reported for α = 0.10. Statistical Analysis
  • 17.
    C6 C8 C9JBM JBO p=0.08p=0.03p=0.60p=0.14p=0.35 b a ab ab ab a b ab ab a a a a a a a a a a a a N treatment resulted in higher foliar N only at Jeffers Brook.
  • 18.
    C6 C8 C9JBM JBO p=0.04p=0.006p=0.21p=0.23p=0.93 b ab ab a a a ab c bc bc a a a a a a a a a a a P treatment resulted in higher foliar P only at Jeffers Brook.
  • 19.
    C6 C8 C9JBM JBO p=0.06p=0.93p=0.83p=0.01p=0.55 ab a ab ab b a a a a a a a a a a ab cabc bc a a There were some significant treatment effects on foliar K but they were not consistent.
  • 20.
    C6 C8 C9JBM JBO p=0.18p=0.59p=0.39p=0.12p=0.41 a a a a a a a a a a a a a a a a a a a a a There were no treatment effects on foliar Mg.
  • 21.
    C6 C8 C9JBM JBO p=0.006p=0.02p=0.21p<0.001p=0.01 a ab b b b a b ab ab ab a a a a a ab bc c c a b Ca addition increased foliar Mn in C6, C8, and JBO.
  • 22.
    C6 C8 C9JBM JBO p=0.07 a a a a a p=0.7p=0.63p=0.06p=0.99 a a a a a a a a a a a a aa a There were no treatment effects on foliar Ca.
  • 23.
    sugar maple A. beechyellow birch p=0.001 p=0.001 p=0.01 p=0.02p=0.07 p=0.002 b a b a b a b a b a b a The CaSiO3 addition increased foliar Si in all six stands.
  • 25.
    15 35 5575 Soil P (ug/g soil) r = 0.22 p =0.42 1.5 1.7 1.9 2.1 2.3 2.5 2.7 2.9 500 1500 2500 3500 Ca (ug/g soil) r = -0.06 p =0.83 3 5 7 9 11 13 N mineralization (ug/g soil) Bartlett Mature -C8 Bartlett Mature -C9 Bartlett Mid-C6 Jeffers Mid Jeffers Mature r = 0.65 p = 0.007 AverageSapSugarConcentration(%) Ca N P 1.5 2.0 2.5 3.0 3.5 4.0 4.5 5.0 2 4 6 8 10 12 14 Foliar Ca (mg/g) r = -0.03 p = 0.79 0.7 0.9 1.1 1.3 1.5 1.7 1.9 Foliar P (mg/g) r = -0.25 p = 0.02 5 10 15 20 25 Foliar N (mg/g) r = 0.16 p = 0.14 AverageSapSugarConcentration(%) Ca N P A B
  • 26.
    15 35 5575 Soil P (ug/g soil) r = 0.22 p =0.42 1.5 1.7 1.9 2.1 2.3 2.5 2.7 2.9 500 1500 2500 3500 Ca (ug/g soil) r = -0.06 p =0.83 3 5 7 9 11 13 N mineralization (ug/g soil) Bartlett Mature -C8 Bartlett Mature -C9 Bartlett Mid-C6 Jeffers Mid Jeffers Mature r = 0.65 p = 0.007 AverageSapSugarConcentration(%) Ca N P 1.5 2.0 2.5 3.0 3.5 4.0 4.5 5.0 2 4 6 8 10 12 14 Foliar Ca (mg/g) r = -0.03 p = 0.79 0.7 0.9 1.1 1.3 1.5 1.7 1.9 Foliar P (mg/g) r = -0.25 p = 0.02 5 10 15 20 25 Foliar N (mg/g) r = 0.16 p = 0.14 AverageSapSugarConcentration(%) Ca N P A B R² = 0.1429 1.5 2.0 2.5 3.0 3.5 4.0 4.5 5.0 5 10 15 20 25 AverageSapSugarConcentration(%) Foliar N:P (mg/g) Bartlett Mature-C8 Bartlett Mature-C9 Bartlett Mid-C6 Jeffers Mid Jeffers Mature Higher foliar N:P increases sap sweetness
  • 27.
  • 28.
    2 2.1 2.2 2.3 2.4 2.5 2.6 Control N PNP AverageSapSugarConcentration(%) p = 0.09 a a a b Nitrogen increases sap sweetness
  • 29.
    MELNHE Results Summary •Foliar N and P treatment response at Jeffers Brook • Si is higher in the wollastonite application but there is no Ca affect • N increases sap sweetness (more pancakes)
  • 30.
    • Tree growth? •Snails? • Respiration? • Microbes? • Seedlings? • Sapflow? Will we see a treatment response in…
  • 31.
    Acknowledgments • Daniel Conley •Wim Clymans • Matt Vadeboncoeur • Mark Green • Ruth Yanai • Michele Pryun • Shoestring Crews Citations • Choe, Y. Driscoll, C.T. Johnson, C.E. Siccama, T.G. 2010. Chemical changes in soil and soil solution after calcium silicate addition to a northern hardwood forest. Biogeochemistry

Editor's Notes