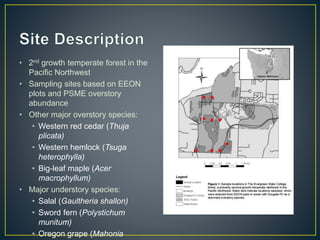
This document summarizes a study analyzing phosphorus levels in an old-growth Douglas fir forest in the Pacific Northwest. Key findings include:
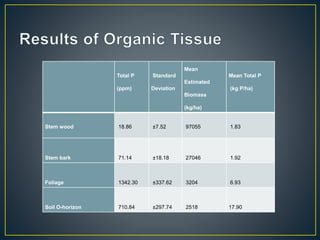
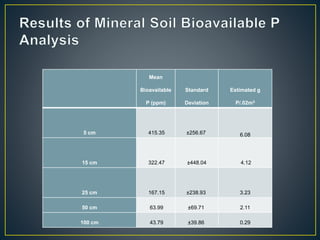
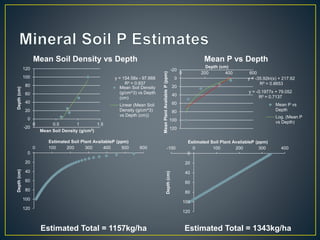
- Phosphorus levels were highest in foliage and lowest in mineral soil below 50cm.
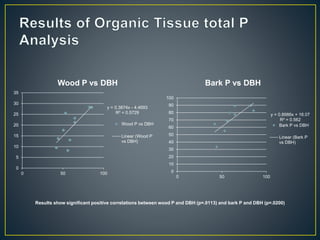
- Wood and bark phosphorus levels correlated positively with tree diameter.
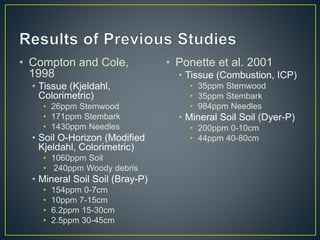
- Phosphorus levels generally decreased with soil depth and were largely consistent with prior studies.
- Clearcutting could remove over 1kg/ha of phosphorus from the ecosystem.
Further analysis of nutrient cycling and a larger sample size were recommended.