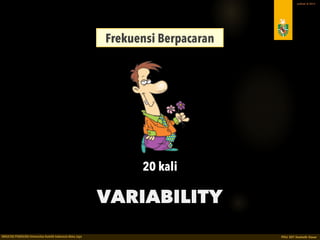
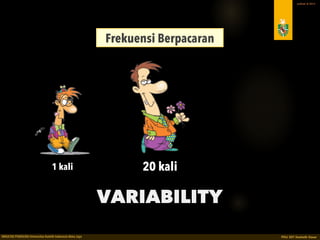
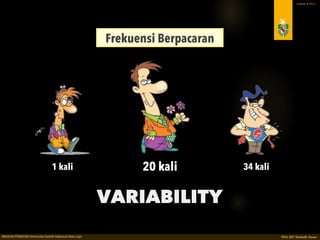
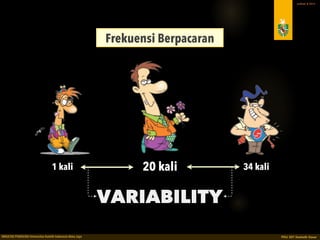
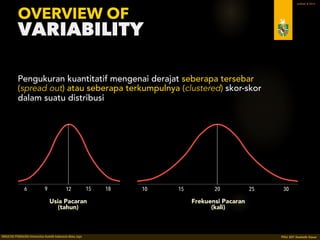
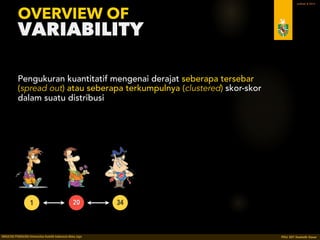
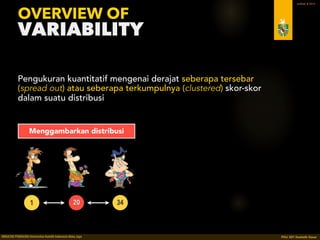
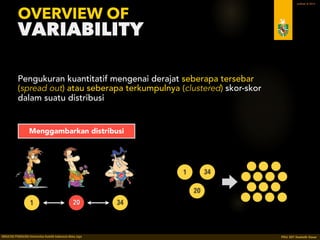
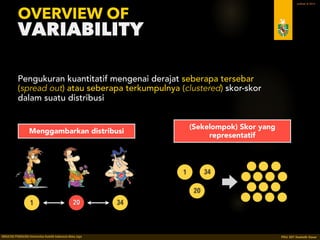
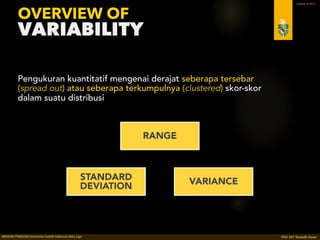
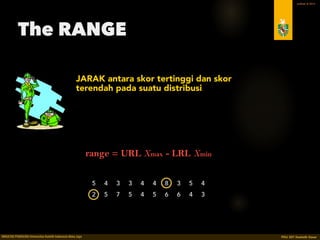
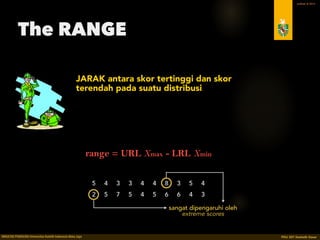
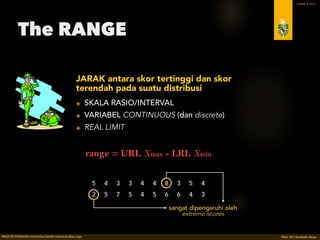
PDU 207 STATISTIK DASAR
SEKSI E
SEMESTER GASAL 2016/2017
FAKULTAS PSIKOLOGI / PROGRAM STUDI S1 PSIKOLOGI
Variability
KULIAH V – 05 SEPTEMBER 2016
Menguasai teknik-teknik statistika deskriptif dan statistika inferensial,

secara khusus terkait dengan:
• Tujuan umum dilakukannya perhitungan variabilitas, serta perbedaan kumpulan skor

berdasarkan derajat variabilitasnya;
• Konsep dan perhitungan berbagai teknik variabilitas.
Memiliki kemampuan menyampaikan argumentasi dan penalaran

dengan bahasa yang tepat, khususnya berkaitan dengan:
• Pemilihan teknik perhitungan variabilitas yang paling tepat sesuai dengan jenis data

dan tujuan pengukurannya.
One-Day Objectives
Introduction to

Variability
PDU 207 STATISTIK DASAR 2016 © Ardhiati 4
Usia Saat Pertama Kali

Jatuh Cinta
15 tahun
CENTRAL

TENDENCY
PDU 207 STATISTIK DASAR 2016 © Ardhiati 5
Usia Saat Pertama Kali

Jatuh Cinta
15 tahun
VARIABILITY
8 tahun 23 tahun
PDU 207 STATISTIK DASAR 2016 © Ardhiati
Variability
6
Variability provides a quantitative measure of

the differences between scores in a distribution

and describes the degree to which the scores

are spread out or clustered together.
THE DEFINITION
(Gravetter & Wallnau, 2012: 104)
15 16 171413
Usia Saat Pertama Kali Berpacaran
(tahun)
15 19 23118
Usia Saat Pertama Kali Jatuh Cinta
(tahun)
PDU 207 STATISTIK DASAR 2016 © Ardhiati
Variability
7
SERVES TWO PURPOSES
(Gravetter & Wallnau, 2012: 105)
1 Describes the
distribution
2 Measures how well

an individual score (or
group of scores) represents
the entire distribution
158 231713
15
8
23
PDU 207 STATISTIK DASAR 2016 © Ardhiati
Variability
8
THE MEASURES
VARIABILITY
THE RANGE
STANDARD

DEVIATION VARIANCE
PDU 207 STATISTIK DASAR 2016 © Ardhiati
Variability
9
THE MEASURES
VARIABILITY
THE

INTERQUARTILE

RANGE
THE RANGE
STANDARD

DEVIATION VARIANCE
Measurement of
Variability
PDU 207 STATISTIK DASAR 2016 © Ardhiati
The Range
11
The distance covered by the scores in a distribution,

from the smallest score to the largest score.
(Gravetter & Wallnau, 2012: 106)
range = Xmax - Xmin + 1
= URL for Xmax - LRL for Xmin
11 14 13 13 14 14 23 13 15 14
8 15 17 15 14 15 16 16 14 13
Usia Saat

Pertama Kali

Jatuh Cinta
it is completely
determined by the two
extreme values
TYPES OF VARIABLES ☐ DISCRETE ☐ CONTINUOUS
COUNT vs MEASURE ☐ COUNT ☐ MEASURE
MEASUREMENT SCALE ☐ NOMINAL ☐ ORDINAL ☐ INTERVAL ☐ RATIO
ACCURACY ☐ LOW ☐ MODERATE ☐ HIGH
✓
✓
✓
✓ ✓ ✓
✓
PDU 207 STATISTIK DASAR 2016 © Ardhiati
The Interquartile Range
12
The distance covered by the middle 50% of the distribution

(Q3 - Q1).
14 15 16 17 18 19 20 21 22 231312111098
1
2
3
4
5
6
Usia Saat

Pertama Kali

Jatuh Cinta
TYPES OF VARIABLES ☐ DISCRETE ☐ CONTINUOUS
COUNT vs MEASURE ☐ COUNT ☐ MEASURE
MEASUREMENT SCALE ☐ NOMINAL ☐ ORDINAL ☐ INTERVAL ☐ RATIO
ACCURACY ☐ LOW ☐ MODERATE ☐ HIGH
PDU 207 STATISTIK DASAR 2016 © Ardhiati
The Interquartile Range
13
The distance covered by the middle 50% of the distribution

(Q3 - Q1).
14 15 16 17 18 19 20 21 22 231312111098
1
2
3
4
5
6
Bottom 25% Top 25%
Q1 = 13,25 Q3 = 15,25
Interquartile Range
= Q3 - Q1
= 2
TYPES OF VARIABLES ☐ DISCRETE ☐ CONTINUOUS
COUNT vs MEASURE ☐ COUNT ☐ MEASURE
MEASUREMENT SCALE ☐ NOMINAL ☐ ORDINAL ☐ INTERVAL ☐ RATIO
ACCURACY ☐ LOW ☐ MODERATE ☐ HIGH
✓
✓
✓
✓ ✓ ✓
✓
Usia Saat

Pertama Kali

Jatuh Cinta
PDU 207 STATISTIK DASAR 2016 © Ardhiati
Standard Deviation & Variance
14
The average distance from the mean.
(Gravetter & Wallnau, 2012: 106-114)
FOR POPULATION
X X - μ (X - μ)2
8 -6,35 40,32
11 -3,35 11,22
13 -1,35 1,82
13 -1,35 1,82
13 -1,35 1,82
13 -1,35 1,82
14 -0,35 0,12
14 -0,35 0,12
14 -0,35 0,12
14 -0,35 0,12
14 -0,35 0,12
14 -0,35 0,12
15 0,65 0,42
15 0,65 0,42
15 0,65 0,42
15 0,65 0,42
16 1,65 2,72
16 1,65 2,72
17 2,65 7,02
23 8,65 74,82
find the deviation

(distance from the mean)

for each score
square each deviation
find the average

of the squared deviations
take the square root

of the variance
STANDARD

DEVIATION
VARIANCE 7,43
2,73
μ = 14,35 SS = 148,55μ = 0,00
PDU 207 STATISTIK DASAR 2016 © Ardhiati
Standard Deviation & Variance
15
The average distance from the mean.
(Gravetter & Wallnau, 2012: 113)
FOR POPULATION
find the deviation

(distance from the mean)

for each score
square each deviation
find the average

of the squared deviations
take the square root

of the variance
STANDARD

DEVIATION
VARIANCE
PDU 207 STATISTIK DASAR 2016 © Ardhiati
Standard Deviation & Variance
16
The average distance from the mean.
(Gravetter & Wallnau, 2012: 114)
FOR SAMPLES
11 14 13 13 14 14 23 13 15 14
8 15 17 15 14 15 16 16 14 13
11 16 13 15 16
POPULATION
SAMPLES
PDU 207 STATISTIK DASAR 2016 © Ardhiati
Standard Deviation & Variance
17
The average distance from the mean.
(Gravetter & Wallnau, 2012: 114)
FOR SAMPLES
X X - M (X - M)2
11 -3,20 10,24
13 -1,20 1,44
15 0,80 0,64
16 1,80 3,24
16 1,80 3,24
find the deviation

(distance from the mean)

for each score
square each deviation
find the average

of the squared deviations
take the square root

of the variance
3,76
1,96
M = 14,20 SS = 18,80M = 0,00
PDU 207 STATISTIK DASAR 2016 © Ardhiati
Standard Deviation & Variance
18
The average distance from the mean.
(Gravetter & Wallnau, 2012: 114)
FOR SAMPLES
11 14 13 13 14 14 23 13 15 14
8 15 17 15 14 15 16 16 14 13
11 16 13 15 16
POPULATION
SAMPLES
lessvariability
POPULATION

VARIABILITY
SAMPLES

VARIABILITY
biasedestimate
PDU 207 STATISTIK DASAR 2016 © Ardhiati
Standard Deviation & Variance
19
The average distance from the mean.
(Gravetter & Wallnau, 2012: 117-118)
FOR SAMPLES
μ = 14,35
?
M ≈ 14,35
n = 5
11
16
13
15
No restrictions
Restricted
DEGREES OF

FREEDOM
PDU 207 STATISTIK DASAR 2016 © Ardhiati
Standard Deviation & Variance
20
The average distance from the mean.
(Gravetter & Wallnau, 2012: 114)
FOR SAMPLES
X X - M (X - M)2
11 -3,20 10,24
13 -1,20 1,44
15 0,80 0,64
16 1,80 3,24
16 1,80 3,24
find the deviation

(distance from the mean)

for each score
square each deviation
find the average

of the squared deviations
take the square root

of the variance
STANDARD

DEVIATION
VARIANCE 4,70
2,17
M = 14,20 SS = 18,80M = 0,00
PDU 207 STATISTIK DASAR 2016 © Ardhiati
Standard Deviation & Variance
21
The average distance from the mean.
(Gravetter & Wallnau, 2012: 117-118)
find the deviation

(distance from the mean)

for each score
square each deviation
find the average

of the squared deviations
take the square root

of the variance
STANDARD

DEVIATION
VARIANCE
FOR SAMPLES
PDU 207 STATISTIK DASAR 2016 © Ardhiati
Standard Deviation & Variance
22
The average distance from the mean.
TYPES OF VARIABLES ☐ DISCRETE ☐ CONTINUOUS
COUNT vs MEASURE ☐ COUNT ☐ MEASURE
MEASUREMENT SCALE ☐ NOMINAL ☐ ORDINAL ☐ INTERVAL ☐ RATIO
ACCURACY ☐ LOW ☐ MODERATE ☐ HIGH
✓
✓ ✓
✓
✓
Selecting a Measure
PDU 207 STATISTIK DASAR 2016 © Ardhiati
Selecting a Measure
24
OF CENTRAL TENDENCY & VARIABILITY
TYPE OF VARIABLES
MEASUREMENT SCALE
CENTRAL TENDENCY THE MODE
THE

MEDIAN
THE

MEAN
VARIABILITY
COUNT OF

VARIATIONS
THE

RANGE
THE

INTERQUARTILE

RANGE
STANDARD

DEVIATION
VARIANCE
DISCRETE
CONTINUOUS
NOMINAL
ORDINAL
INTERVAL
RATIO
PDU 207 STATISTIK DASAR 2016 © Ardhiati 25
WANT TO KNOW MORE?
Gravetter, F.J. & Wallnau, L.B. (2012).

Statistics for the behavioral sciences (9th ed.).

Australia: WADSWORTH CENGAGE Learning.

PDU 207 Basic Statistics: Variability

  • 1.
    PDU 207 STATISTIKDASAR SEKSI E SEMESTER GASAL 2016/2017 FAKULTAS PSIKOLOGI / PROGRAM STUDI S1 PSIKOLOGI Variability KULIAH V – 05 SEPTEMBER 2016
  • 2.
    Menguasai teknik-teknik statistikadeskriptif dan statistika inferensial,
 secara khusus terkait dengan: • Tujuan umum dilakukannya perhitungan variabilitas, serta perbedaan kumpulan skor
 berdasarkan derajat variabilitasnya; • Konsep dan perhitungan berbagai teknik variabilitas. Memiliki kemampuan menyampaikan argumentasi dan penalaran
 dengan bahasa yang tepat, khususnya berkaitan dengan: • Pemilihan teknik perhitungan variabilitas yang paling tepat sesuai dengan jenis data
 dan tujuan pengukurannya. One-Day Objectives
  • 3.
  • 4.
    PDU 207 STATISTIKDASAR 2016 © Ardhiati 4 Usia Saat Pertama Kali
 Jatuh Cinta 15 tahun CENTRAL
 TENDENCY
  • 5.
    PDU 207 STATISTIKDASAR 2016 © Ardhiati 5 Usia Saat Pertama Kali
 Jatuh Cinta 15 tahun VARIABILITY 8 tahun 23 tahun
  • 6.
    PDU 207 STATISTIKDASAR 2016 © Ardhiati Variability 6 Variability provides a quantitative measure of
 the differences between scores in a distribution
 and describes the degree to which the scores
 are spread out or clustered together. THE DEFINITION (Gravetter & Wallnau, 2012: 104) 15 16 171413 Usia Saat Pertama Kali Berpacaran (tahun) 15 19 23118 Usia Saat Pertama Kali Jatuh Cinta (tahun)
  • 7.
    PDU 207 STATISTIKDASAR 2016 © Ardhiati Variability 7 SERVES TWO PURPOSES (Gravetter & Wallnau, 2012: 105) 1 Describes the distribution 2 Measures how well
 an individual score (or group of scores) represents the entire distribution 158 231713 15 8 23
  • 8.
    PDU 207 STATISTIKDASAR 2016 © Ardhiati Variability 8 THE MEASURES VARIABILITY THE RANGE STANDARD
 DEVIATION VARIANCE
  • 9.
    PDU 207 STATISTIKDASAR 2016 © Ardhiati Variability 9 THE MEASURES VARIABILITY THE
 INTERQUARTILE
 RANGE THE RANGE STANDARD
 DEVIATION VARIANCE
  • 10.
  • 11.
    PDU 207 STATISTIKDASAR 2016 © Ardhiati The Range 11 The distance covered by the scores in a distribution,
 from the smallest score to the largest score. (Gravetter & Wallnau, 2012: 106) range = Xmax - Xmin + 1 = URL for Xmax - LRL for Xmin 11 14 13 13 14 14 23 13 15 14 8 15 17 15 14 15 16 16 14 13 Usia Saat
 Pertama Kali
 Jatuh Cinta it is completely determined by the two extreme values TYPES OF VARIABLES ☐ DISCRETE ☐ CONTINUOUS COUNT vs MEASURE ☐ COUNT ☐ MEASURE MEASUREMENT SCALE ☐ NOMINAL ☐ ORDINAL ☐ INTERVAL ☐ RATIO ACCURACY ☐ LOW ☐ MODERATE ☐ HIGH ✓ ✓ ✓ ✓ ✓ ✓ ✓
  • 12.
    PDU 207 STATISTIKDASAR 2016 © Ardhiati The Interquartile Range 12 The distance covered by the middle 50% of the distribution
 (Q3 - Q1). 14 15 16 17 18 19 20 21 22 231312111098 1 2 3 4 5 6 Usia Saat
 Pertama Kali
 Jatuh Cinta TYPES OF VARIABLES ☐ DISCRETE ☐ CONTINUOUS COUNT vs MEASURE ☐ COUNT ☐ MEASURE MEASUREMENT SCALE ☐ NOMINAL ☐ ORDINAL ☐ INTERVAL ☐ RATIO ACCURACY ☐ LOW ☐ MODERATE ☐ HIGH
  • 13.
    PDU 207 STATISTIKDASAR 2016 © Ardhiati The Interquartile Range 13 The distance covered by the middle 50% of the distribution
 (Q3 - Q1). 14 15 16 17 18 19 20 21 22 231312111098 1 2 3 4 5 6 Bottom 25% Top 25% Q1 = 13,25 Q3 = 15,25 Interquartile Range = Q3 - Q1 = 2 TYPES OF VARIABLES ☐ DISCRETE ☐ CONTINUOUS COUNT vs MEASURE ☐ COUNT ☐ MEASURE MEASUREMENT SCALE ☐ NOMINAL ☐ ORDINAL ☐ INTERVAL ☐ RATIO ACCURACY ☐ LOW ☐ MODERATE ☐ HIGH ✓ ✓ ✓ ✓ ✓ ✓ ✓ Usia Saat
 Pertama Kali
 Jatuh Cinta
  • 14.
    PDU 207 STATISTIKDASAR 2016 © Ardhiati Standard Deviation & Variance 14 The average distance from the mean. (Gravetter & Wallnau, 2012: 106-114) FOR POPULATION X X - μ (X - μ)2 8 -6,35 40,32 11 -3,35 11,22 13 -1,35 1,82 13 -1,35 1,82 13 -1,35 1,82 13 -1,35 1,82 14 -0,35 0,12 14 -0,35 0,12 14 -0,35 0,12 14 -0,35 0,12 14 -0,35 0,12 14 -0,35 0,12 15 0,65 0,42 15 0,65 0,42 15 0,65 0,42 15 0,65 0,42 16 1,65 2,72 16 1,65 2,72 17 2,65 7,02 23 8,65 74,82 find the deviation
 (distance from the mean)
 for each score square each deviation find the average
 of the squared deviations take the square root
 of the variance STANDARD
 DEVIATION VARIANCE 7,43 2,73 μ = 14,35 SS = 148,55μ = 0,00
  • 15.
    PDU 207 STATISTIKDASAR 2016 © Ardhiati Standard Deviation & Variance 15 The average distance from the mean. (Gravetter & Wallnau, 2012: 113) FOR POPULATION find the deviation
 (distance from the mean)
 for each score square each deviation find the average
 of the squared deviations take the square root
 of the variance STANDARD
 DEVIATION VARIANCE
  • 16.
    PDU 207 STATISTIKDASAR 2016 © Ardhiati Standard Deviation & Variance 16 The average distance from the mean. (Gravetter & Wallnau, 2012: 114) FOR SAMPLES 11 14 13 13 14 14 23 13 15 14 8 15 17 15 14 15 16 16 14 13 11 16 13 15 16 POPULATION SAMPLES
  • 17.
    PDU 207 STATISTIKDASAR 2016 © Ardhiati Standard Deviation & Variance 17 The average distance from the mean. (Gravetter & Wallnau, 2012: 114) FOR SAMPLES X X - M (X - M)2 11 -3,20 10,24 13 -1,20 1,44 15 0,80 0,64 16 1,80 3,24 16 1,80 3,24 find the deviation
 (distance from the mean)
 for each score square each deviation find the average
 of the squared deviations take the square root
 of the variance 3,76 1,96 M = 14,20 SS = 18,80M = 0,00
  • 18.
    PDU 207 STATISTIKDASAR 2016 © Ardhiati Standard Deviation & Variance 18 The average distance from the mean. (Gravetter & Wallnau, 2012: 114) FOR SAMPLES 11 14 13 13 14 14 23 13 15 14 8 15 17 15 14 15 16 16 14 13 11 16 13 15 16 POPULATION SAMPLES lessvariability POPULATION
 VARIABILITY SAMPLES
 VARIABILITY biasedestimate
  • 19.
    PDU 207 STATISTIKDASAR 2016 © Ardhiati Standard Deviation & Variance 19 The average distance from the mean. (Gravetter & Wallnau, 2012: 117-118) FOR SAMPLES μ = 14,35 ? M ≈ 14,35 n = 5 11 16 13 15 No restrictions Restricted DEGREES OF
 FREEDOM
  • 20.
    PDU 207 STATISTIKDASAR 2016 © Ardhiati Standard Deviation & Variance 20 The average distance from the mean. (Gravetter & Wallnau, 2012: 114) FOR SAMPLES X X - M (X - M)2 11 -3,20 10,24 13 -1,20 1,44 15 0,80 0,64 16 1,80 3,24 16 1,80 3,24 find the deviation
 (distance from the mean)
 for each score square each deviation find the average
 of the squared deviations take the square root
 of the variance STANDARD
 DEVIATION VARIANCE 4,70 2,17 M = 14,20 SS = 18,80M = 0,00
  • 21.
    PDU 207 STATISTIKDASAR 2016 © Ardhiati Standard Deviation & Variance 21 The average distance from the mean. (Gravetter & Wallnau, 2012: 117-118) find the deviation
 (distance from the mean)
 for each score square each deviation find the average
 of the squared deviations take the square root
 of the variance STANDARD
 DEVIATION VARIANCE FOR SAMPLES
  • 22.
    PDU 207 STATISTIKDASAR 2016 © Ardhiati Standard Deviation & Variance 22 The average distance from the mean. TYPES OF VARIABLES ☐ DISCRETE ☐ CONTINUOUS COUNT vs MEASURE ☐ COUNT ☐ MEASURE MEASUREMENT SCALE ☐ NOMINAL ☐ ORDINAL ☐ INTERVAL ☐ RATIO ACCURACY ☐ LOW ☐ MODERATE ☐ HIGH ✓ ✓ ✓ ✓ ✓
  • 23.
  • 24.
    PDU 207 STATISTIKDASAR 2016 © Ardhiati Selecting a Measure 24 OF CENTRAL TENDENCY & VARIABILITY TYPE OF VARIABLES MEASUREMENT SCALE CENTRAL TENDENCY THE MODE THE
 MEDIAN THE
 MEAN VARIABILITY COUNT OF
 VARIATIONS THE
 RANGE THE
 INTERQUARTILE
 RANGE STANDARD
 DEVIATION VARIANCE DISCRETE CONTINUOUS NOMINAL ORDINAL INTERVAL RATIO
  • 25.
    PDU 207 STATISTIKDASAR 2016 © Ardhiati 25 WANT TO KNOW MORE? Gravetter, F.J. & Wallnau, L.B. (2012).
 Statistics for the behavioral sciences (9th ed.).
 Australia: WADSWORTH CENGAGE Learning.