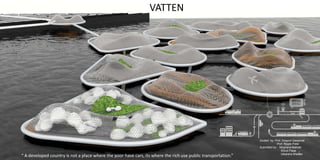
The design proposal of the urban sprawl that runs wholly on mass transportation and without any private vehicles to lower the pollution. Sprawl that is on water and runs very efficiently.
1. “ A developed country is not a place where the poor have cars, its where the rich use public transportation.”
1
Guided by- Prof. Swapnil Gawande
Prof. Ripple Patel
Submitted by - Meghana Mahale
Shruti Pitale
Utkarsha Shetkar
VATTEN
2. Why we need transportation?
Source :
Transportation
2
4. CO2 emission
Airplane Car 2 seater car Scooter/Bike Bu
s
Train Tram
88 1561.5 1.5 1127 140 11.2
285
158
104
72 68
14 15 0 0
Grams CO2 per passenger km
People
4
Source :
Cycle WalkWater
ways
50
5. Water
ways
Space occupancy
Airplane Car 2 seater car Scooter/Bike Bu
s
Train Tram
Space in sq. m per occupant
0.7
9.1
3.9
1.9
0.5 0.5 0.6
1.5
0.5
5
Source :
Cycle Walk
8
6. Fuel consumption
Airplane Car 2 seater car Scooter/Bike Bu
s
Train Tram
Fuel for kmpl
12
20
14
6
∞
45
∞
6
Source :
Cycle WalkWater
ways
7. No. of people can cater
Source :
Airplane Car 2 seater car Scooter/Bike Bu
s
Train Tram
Numbers of people 3.5m wide lane can convey with
different mod of transport in an a minute
33
260
150
366
233
316
33N
a
N
a
7
Cycle WalkWater
ways
8. Fare
Airplane Car 2 seater car Scooter/Bike Bu
s
Train Tram
Fare per km
6
22
18
2
5
2
4
N
a
8
Source :
Cycle WalkWater
ways
4.6
9. Airplane Car 2 seater car Scooter/Bike Bu
s
Train Tram
N
a
N
a
N
a
9
Source :
WalkWater
ways
Cycle
N
a
N
a
12. Case study
12
Source :
Development happens along the water body
Developing and developed infrastructure
Water body
Developed
infrastructure
Developing
infrastructure
13. Urban development
2001-2017
A-2009 - BRTS (janmarg)
starts its function in city.
13
Source :
1851-1900
A-1863 – Construction of
Railway Station.
H-1888 – Founding of Peak
Tram.
1901-1950
A-1937 – Opening of SVP
Airport
1947 – Bus Transport Service
under Municipal control
H-1924 – Land alloctaion for
Kai Tak airport.
1933 – Founding of Kowloon
motor bus .
1951-2000
H-1979 – Establishment of
mass transit Railway.
1997 – Hong Kong transfered
to People's Republic of China.
1998 – Kai Tak international
airport transfered to Hong
Kong international airport.
18. Landmark (famous places where people visit everyday)
South side
1- Hong Kong Maritime
Museum
2-Hong Kong observation
wheel
3- Hong Kong Art Centre
4- Hong Kong Convention and
exhibition Centre
5- Wan Chai sports ground
6- Times square
7- World Trade Centre
Ahmedabad Hong-Kong
East side
1- Ram gate and
heritage park
2- Sunday gurjari market
3- Victoria garden
4- Ahmedshah masjid
5- Lal darwaja park
6- Sidi saeed mosque
7- Bhadra fort
8- Premabhai hall
9- CNI church
10- Teen darwaja
11- MG house
12- Rani rupmatis
mosque
13- Jama masjid
14- Manek chowk
Ahmedabad
Hong-Kong
1
2
3
4
5
6
7
18
Source :
0 m 200 m
19. Soure :
Landmark (famous places where people visit everyday)
Ahmedabad Hong-Kong Ahmedabad
West side
1- BJ park
2- SAFQ headquarter
3- patang hotel
4- performing art
Centre
5- Swaminarayan
temple
6- ATMA
7- Gandhigram railway
station
8- Contemporary art
gallery
9- Town hall
10- National institute
of design
11- Cultural mile
Hong-Kong
1- Hong Kong Cultural
Centre
2 – Avenue of Stars
3- Kowloon Park
1 2
3
19
0 m 200 m
20. Proximity
Ahmedabad Hong-Kong
(Building proximity to the site)
500 m radius
1 km. radius
Building proximity to the site
v
500 m radius
1 k.m. radius
v
500 m radius
1 k.m. radius1 2
3
1
2
3
4
5
6
7
20
Source :
0 m 200 m
21. Land use
Source : city on a bridge
Ahmedabad Hong-Kong
Mixed use 20%
Parks and gardens
8%
Commercial 14%
Residential 10%
Public and semi
public 4%
parking 1%
Hong-Kong
Mixed use 40%
Public and Semi
Public 6%
Commercial 20%
Residential 8 %
Parks and
Garden 4%
Dense zone 3%
Parking 3%
Water 15%
water body 40%
Ahmedabad
Institutions 1%
Institutions 3%
0 m 200 m
22. Density
Source : city on a bridge
(major dense zone is in east side of Ahmedabad and central part in hong-kong)
Ahmedabad Hong-Kong
>50000
<50000
<10000
<10000
Not build
85456 sq.km10032 sq.km
Ahmedabad
Hong-Kong
50000
40000
30000
20000
10000
Density people km2
Density people km2
0 m 200 m
24. Road network(------)
Ahmedabad Hong-Kong
Ellise bridge
Neharu bridge
Node with 5 intersection
9 m wide road
34 m wide road
24 m wide road
Node with 4 intersection
Node with 3 intersection
Heading towards
ashram road
24
Source :
0 m 200 m
25. Traffic movement and intensity
Ahmedabad Hong-Kong
Traffic intensity
Traffic movement
% of vehicle distribution
25
Source :
0 m 200 m
31. Study Area
Topography
Density
Ahmadabad Hong Kong London San Francisco New York Mumbai
12,000/km2 (31,00
0/sq mi)
6,777/km2(17,552.
3/sq mi)
5,590/km2(14,500/
sq mi)
7,282/km2
(18,860/sq mi )
11,000/km2
(28,491/sq mi )
21,000/km2 (53,00
0/sq mi)
464.16 km2
Elevation: 53m
2,754 km2
Elevation: m
2.9km²
Elevation: 11 m
121.4 km2
Elevation: 16m
784 km2
Elevation: 10m
603.4 km²
Elevation: 14 m
1-Flat Land
2- Rivers
3- Lakes
2- Reclaimed land 2- Reclaimed land
1-Hilly and mountains with steep
slopes
2- Reclaimed land
1- River1- River
1- Lakes
1- Rocky
2- Reclaimed land
1- Rivers
Vertical
density
32. Motorcycle
0.1%
Other
0.8%`
Walking
10.5%
Bicycle
0.7%
Metro
40.8%
Railroad
2%
Bus
13.7%
Taxi
1.4%
Car
30%
Ahmadabad
1- BRT
2- AMT
3- METO
1- BUSES
2- TRAMS
3- METRO
1- CABLE CAR
2- TRAMS
3- LOCAL TRAINS
1- CABLE CAR
2- BUSES AND
TROLLEY
BUSES3- FERRIES
1- BUS
2- SUBWAY
3- RAIL
1- TRAINS
2- BUSES
3- METRO
4- FEERIES 4- RIVER BUSES
5- LIGHT RAILWAY 4- CALTRAINS
4- FERRY
5- PEDICAB
6-
HELICOPTER7- AERIAL TRAM
4- MONO RAIL
5- FERRY
Mumbai
Other
1%
Train
1%
Bus
16%
4 wheeler
5%
2 Wheeler
34%
Walking 22% Other 1.2Taxi 3.8%
Private bus
4.9%
Bus or
trams
25.7%
Walking
44.7%
Private vehicle 6%
7%
60%
22%
45%48%
Network
pattern
Type of
transportations
Hong Kong London San Francisco New York
Bicycle
0.8%
Car
1.6%Rickshaw
2.4%
Taxi
0.3%
Walking
55.5%
Two wheeler
3.1%
5%
56%
39%
Bus
14.4%
Train
21.9%
Bus
20.1%
Metro
10.6%
Bicycle
1.8%
Walking
20%
22%
41%
37%
Car
36.3%
Taxi
1.4%
DLR
0.7%
Rail
8.4%
Motorcycle
0.7%
11%
58%
31%
Metro
25%
Walking
23%
Bicycle
4%
Motor cycle
27%
Car
21%
Public vehicle
Private vehicle
walking
Reclaimed
land
34. Area distribution
Type of transportation
1- Hyperloop
2- water taxy
3- Bicycle
4 - metro
NETWORK
Primary network Secondary network Tertiary network
1- Air taxy
2- Bicycle
1- pedestrians
Area Requirement 0.55 sq.m
(comfortable seating space)
0.58
0.96
3.44 sq.m
(Average area of air taxy)
Network width
0.55 sq.m
(comfortable walking space)
1
1
2.5 - 3 m 2.25 m6 – 7.5 m
2.35 width
Standingarea
Land distribution
Mixed use 20%
Parks and gardens
8%
Commercial 15%
Residential 30%
Public and semi
public 4%
Transport hub 10%
Institutions 3%
Gov.parcel 5%
- Number of people live in
5 sq. km area - 2 lakh
- 38 inhab. per sq.m
34
35. The Ocean !
Find solution not fighting against water but living with water.
36. Vision
Constructing floating city is a promising solution. (The degree of
urbanization is expected to rise further towards 70% in 2100.And
increasing land scarcity.)
Design objectives :
1-dynamic geography
2-Water experience
3-growth development
4-safety
5-seakeeping comfort
37. Options for Dynamic Geography
Islands Composite
structure
Single large
structure
Ship Raised platform Breakwater Submerged
Options for seakeeping
Source : – WATERBASED
URBAN DEVELOPMENT-
Deltasync
Branch
Hard soil Soft soil Water
Safety
Sustainable
Scar less development
`
37
44. 2
10
4
3
9
11
8
12
7
5
6
13
1
Site Plan and Zoning
1 : Tourism hub – 0.69
sq.km
2 : Public and semi public
area – 0.45 sq.km
3 : Parks and Gardens –
0.36 sq.km
4 : Mixed use – 0.55 sq.km
6 : Parks an d gardens –
0.45 sq.km
5 : Residential area - 0.80
sq.km
7 : commercial spaces –
0.77 sq.km
8 : Mixed use – 0.64 sq.km
9 : parks and gardens –
0.62 sq.km
10 : tourism and
entertainment hub – 0.65
sq.km
11 : mixed use – 0.91
sq.km
12 : mixed use – 0.85
sq.km
13 : residential area – 0.86
sq.km
6 m clear height of
building
110 m height of shell
Zoning type 1-
Zoning type 2-
Zoning type 3-
area distribution from the
Centre of site boundary
area distribution from the
Centre of each cell/island
area distribution with
respect to proximity in between
Each zone .
Wave direction
Site plan
Section A-A’
A’
A
Land Sea
City transit hub
44
46. Plan
Island entry
Plan
Transportation hub
section
Walkways
603m
823m
Peripheral walkway
Open spaces
110m
Peripheral
walkway
Building bridges
Outer shell
Outer shell
Services
Each building block
Is 10-12 story high
Floor to floor height is 3m
Each building floor plate
Size is 40-80 m diameter
2
1
0
4
3
9
1
1
8
1
2 7
5
6
1
3
1
Key Plan 46