1. Learning Analytics in a Teachers' Social Network
Manh Cuong Pham, Yiwei Cao, Zinayida Petrushyna, Ralf Klamma
Information Systems and Databases, RWTH Aachen University, Germany
{pham|cao|zina|klamma}@dbis.rwth-aachen.de
Abstract
What is the social capital of a European teacher? We cannot give an answer for every teacher in
Europe; but we have developed some measures for teachers participating in the eTwinning portal run
by European Schoolnet as a case study. Driven by the idea that teachers collaborate across the
borders with the support of an electronic platform, we were able to find correlations between social
network analysis measures like degree and betweenness centrality as well as the local clustering
coefficient, activity statistics about usage of eTwinning and the quality management of European
Schoolnet. Only the combination of the three measures gives us indicators for the social capital
gathered by a teacher. This learning analytics combines structural properties of the lifelong learning
network of European teachers with the concrete usage statistics of a large-scale pedagogical social
networking site using wall messages and blogs for communication among teachers and an established
decentralized quality management framework which is unbiased by central policies. All work is
implemented in a series of analysis and visualization prototypes working on anonymous data set
extracted from the eTwinning network at certain time points. From this we can draw also on the
evolution of the collaboration network as whole as well as on the development of the social capital of
single teachers and their communities. As we have extracted different network structures mirroring
the project and contact network of teachers and the online activities, we can compare the different
factors contributing to the social capital of teachers.
Keywords
Social network analysis, learning analytics, information visualization, data mining, lifelong learning,
professional development, learning networks.
Introduction
Internet enables people to learn in a network without meeting in physical environments. Blogs, Wikis, Twitter
messages and other Web 2.0 media forms bring learners many new learning experiences. People are fond of
learning with other people and make competitions. Learning networks make it possible for learners to learn
together and to show their achievements. Certain monitoring tools are required to monitor the learning activities.
However, it is challenging to measure the performance of learning or to tell who make better progresses in
learning some soft skills. The reasons are that it is difficult to find those "indicators".
In this paper, we are concerned with performance indicators regarding to a sociological concept of "social
capital" in a large-scale network data set, the eTwinning data set. eTwinning is a professional development
network for European school teachers and has been aimed to promote European teachers' collaboration through
the use of Information and Communication Technologies (ICT). As of November of 2010, 163,330 teachers
from 35 countries have registered in eTwinning and involved in 19,128 projects. However, alone from the
statistics we cannot say that a teacher is active or develops his/her project cooperation skills well according to
the project number he/she has. Every eTwinner in eTwinning Portal is a school teacher and is a learner at the
same time, because they want to develop their professional skills.
At promoting eTwinning Portal to more European teachers, eTwinning management staffs at European
Schoolnet are highly interested in teachers' progress with the help of eTwinning Portal. In order to recognize
teachers' performance in project cooperation, additional values such as "Quality Label" and "European
eTwinning Prizes" are applied to assess teachers' achievements within eTwinning. That additional information
may help teachers and management staffs learn about teachers' learning performance or professional
development path. We are interested in whether the social capital recognized by social network analysis is in
line with these awards and what positions in the network are star teachers located.
Proceedings of the 8th International Conference ISBN 978-1-86220-283-2
on Networked Learning 2012 , Edited by: 1
Hodgson V, Jones C, de Laat M, McConnell D,
Ryberg T & Sloep P
2. We assume that there is a correlation between the underlying network structure and the performance of
eTwinners. Specifically, the position of a teacher in the network would be an indicator or predictor for the
performance. In our research, we explore learning network properties with selected centrality measures of social
network analysis methods. We collect and observe the large network data set about project cooperation network,
teachers' wall messaging network, teachers' contacts network, and teachers' blogs network. Based on the
network properties of different cooperation networks among teachers, we recognize the achievements of
teachers in their eTwinning projects and identify teachers' social capital.
The rest of the paper is organized as follows. Section 2 presents related work. Section 3 discusses the
methodological background and methods we use in our study. Section 4 presents the results and some
discussions. Section 5 concludes the paper with an outlook at the future research.
Related Work
Learning networks have been paid attention with community of practice and social capital. SNA methods
contribute to learning analytics. The research is continuously conducted on some previous related work on the
eTwinning network data set, which will be introduced in this section.
Development of Learning Networks
Informal learning (Cheetham & Chivers, 2005) has promoted the development of informal professional
development/training as well. People get together to learn some knowledge or skills. This get-together has help
learners gain knowledge and skills in many formal learning settings. The relationships among learners build up
learning networks, e.g. a teacher with many pupils in a formal class room learning setting. However, learning
networks come up with informal learning and informal professional training.
Learning networks out of informal learning are interested and discussed in this research. Web 2.0 media such as
microblogging provides people informal learning and training possibility, if people subscribe to some
professional microblogging hosts. For example, in Twitter (twitter.com) "followers" and "following" build up
two learning networks. Followers are those who follow the twitter messages of one person, while one is
following the others and are followers of the others again. This represents the hub and authority relationships in
Web. The eTwinning portal is considered as an "informal dialogue to improve teaching" (Vuorikari, 2010).
Consequently, informal assessment methods of learners' learning performance or achievements are required for
informal learning and informal professional development. In some professional social networks, people's
personal contacts number may show how well their social relationships are. For instance, contacts number is a
label for the prominent in the professional social network site LinkedIn (linkedin.com). Research on information
diffusion patterns in people's network may be employed for assess learners in learning networks. Gladwell
(2000) identifies mavens, connectors, and salesmen as a group of information diffusion stars in networks. He
argues those roles have big effects, and changes in network may take place at one dramatic moment like
epidemic, instead of spreading gradually. This viewpoint is interesting to answer the questions addressed by the
eTwinning portal management staff, e.g. "What type of relationships can be found between eTwinning and
teachers' professional development schemes at the local and national level?" (Vuorikari et al., 2011).
Learning Analytics
Learning analytics refers to the interpretation of a wide range of data produced by and gathered on behalf of
students in order to assess academic progress, predict future performance, and spot potential issues (Johnson et
al., 2011). On the methodological level, learning analytics employs advances in data mining, interpretation, and
modelling to improve understandings of teaching and learning, and to tailor education to individual students
more effectively (Johnson et al., 2011). Learning analytics is based on business intelligence, big data, EDM,
statistical methods, intelligent tutors, personalization and adaptive learning (Siemens, 2011). In short, data
mining methods and social network analysis methods are applied in technology enhanced learning research.
Research and prototypes eVa (Breuer et al., 2009), CAfe (Song et al., 2011), and Ad Hoc Transient
Communities (AHTC) services (Fetter et al., 2011) have been developed to conduct some experiments with the
eTwinning network data.
Proceedings of the 8th International Conference ISBN 978-1-86220-283-2
on Networked Learning 2012 , Edited by: 2
Hodgson V, Jones C, de Laat M, McConnell D,
Ryberg T & Sloep P
3. eVa (eTwinning Network Visualization and Analysis) is a network visualization and simple analysis tool. The
data set consists of over 45,000 schools and over 8,000 projects as of July, 2008. It visualizes school network,
project network, teacher network, and country network, based on project cooperation relationship. Results show
that ca. 70% nodes on average across these networks are unconnected. The largest connected school network
component consists of 2783 schools and has a network diameter of 20. The teachers are a little better connected,
since the largest connected teacher network component consists of 4965 teachers and has a network diameter of
19. SNA measures such as degree, closeness centrality, and betweenness centrality are calculated. Simple SNA
is conducted to answer queries such as "Which schools are the most active?". Results are visualized. However, it
is difficult for teachers to understand SNA and networks according to the survey.
CAfe (Competence Analyst for eTwinning) is an SNA-based competence management and teachers' self-
monitoring tool. The data set consists of over 70,000 schools and over 160,000 teachers as of October 2010.
Teachers' teaching/project competence, ICT skills, and communication skills are reflected from the data set of
project network, blog and commenting network, and teachers' wall messaging network respectively. Besides
teachers' attaining various ICT skills, their abilities to read and understand social network analysis and network
visualization are developed and assessed in CAfe as well. Teachers' competence which also builds up their
social capital is calculated on several indicators and factors. Then star teachers are recognized based on this
calculation result. However, network properties may tell the "truth" such as "who the real star teachers are", if
more social network analysis is conducted.
AHTC (Ad Hoc Transient Communities) services involve users into question-answer activities on the
eTwinning Portal. The participant receives an answer from two participants whom were selected by the service.
The results are evaluated in SNA and the goal is to recognize teachers' social capital in eTwinning. However,
teachers' own assessment via their answering the questions may vary from the outcome of the learning network
development.
In summary, these platforms have tried to deliver learning network information and recognize teachers' invest in
their professional development in eTwinning based on social network analysis methods. The lacks lie in an
explicit method convey between social capital and learning network properties, which is dealt with in this paper.
Methodology for the Analysis of eTwinning Networks
The Social Network Analysis (SNA) approaches have been applied in many domains, e.g. knowledge discovery
in digital libraries (Pham & Klamma, 2010; Pham et al., 2011) and analysis of community of practice (Kienle et
al., 2005, 2006; Hoadley M. C., 2005). In this paper, we propose SNA method to study the network of teachers
created from different medium, including project collaboration, blog and blog comment, wall messaging and
contact information. Our goal is to understand the behavior of teachers in collaboration and communication
within eTwinning community. Specifically, we focus on community aspect, i.e. whether teachers collaborate
and communicate with teachers in their community or across different communities. Based on the observation
of global properties, we analyze the performance of teachers regarding to their position in different networks
and identify "star teachers" in term of "social capital", a sociological concept introduced by Coleman (1988).
Different SNA measures are used in the study, including four global measures (clustering coefficient, largest
connected component, diameter and average path length) and three centrality measures (degree, betweenness,
and local clustering coefficient). They are defined as follows (Wasserman & Faust, 1994):
Global measures
Clustering coefficient measures the probability that two nodes are connected if they already have a common
neighbor:
3 number of triangles in the graph
C
number of connected triples of vertices in the graph
Intuitively, clustering coefficient measures the extent to which a network exposes community structure.
When the nodes in the network are groups into dense clusters, clustering coefficient should be very high.
Largest connected component measures the fraction of nodes in largest connected component. It reveals the
connectivity of a network, i.e. whether nodes in a network are connected to each other in a giant component
or separated in many disconnected components.
Diameter is the length of the greatest geodesic distance (shortest path length) between any two nodes.
Average path length is the average of shortest paths between any nodes in the network.
Proceedings of the 8th International Conference ISBN 978-1-86220-283-2
on Networked Learning 2012 , Edited by: 3
Hodgson V, Jones C, de Laat M, McConnell D,
Ryberg T & Sloep P
4. Node centrality measures and social capital
Degree of a node measures the number of connections to it. In a directed network, we define in-degree as
the number of in-coming connections to a particular node and out-degree as the number of out-going
connections from that node.
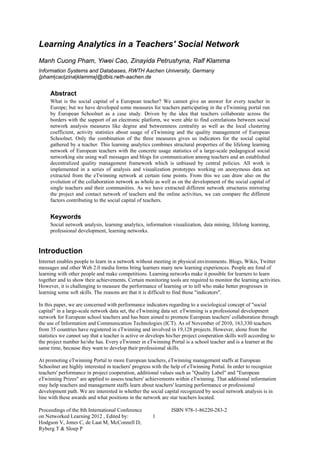
Local clustering coefficient of a node measures the probability that two neighbors of that node are
connected to each other:
| w, u ∈ N v : w, u ∈ E |
C v
| N v N v 1 /2|
where N(v) is the set of neighbors of node v. Local clustering coefficient measures the extent to which a
node is positioned in a dense-connected cluster. If a node is in a dense cluster, its local clustering coefficient
is very high. If it is positioned in the border of a cluster and connects different groups, its local clustering
coefficient is relatively low (e.g. node A in Fig. 1)
Betweenness measures the extent to which a particular node lies between the other nodes in the network:
,
,
where B(u) is the betweenness of node u, , is the number of shortest paths between node i and j that
pass through u and , is the number of shortest paths between node i and j. In contrast to high clustering
coefficient nodes, nodes with high betweenness have more power to control the information flow in the
network and are normally the gate-keepers who connect several dense groups (e.g. node B in Fig. 1).
E
C
B
A
D
F
Figure 1: Structural property of social capital
With node centrality measures, we are able to identify social capital in the networks. Social capital stands for
the ability of actors to derive benefits from the membership in social networks or other social structures. In
social network research, studies are concerned with the identification of network structures that are the most
effective factor for creating social capital. Coleman (1988) emphasizes the benefits of being embedded into
densely-connected groups, regarding to the confident, trust and secured relationship in the community. On the
other hand, Burt (2001) discusses social capital as a tension between being embedded into communities and
brokerage - the benefits arising from the ability to "broker" interactions at the interface between different
groups. In this paper we evaluate these two forms of social capital in eTwinning networks.
Results and Discussions
eTwinning Data Set
The statistics of the eTwinning network data related to our study is given in Table 1, specifically data used to
create networks: project collaboration, contact list, blog post/comment and wall messaging. The data set is
provided by European Schoolnet with anonymous teachers' information for the sake of data privacy.
Table 1: Statistics on eTwinning data (as of 11.11.2011)
Data #data entries Description
Project 23641 Schools from at least two schools from at least two different European
countries create a project and use ICT to carry out their work.
Contact 769578 Teachers are able to explore other teachers' profiles and add them into their
own contact list. It is suggested to use forum and other media to contact the
other teachers before taking them as a contact.
Proceedings of the 8th International Conference ISBN 978-1-86220-283-2
on Networked Learning 2012 , Edited by: 4
Hodgson V, Jones C, de Laat M, McConnell D,
Ryberg T & Sloep P
5. Blog 20963 Teachers' blog hosted in TwinSpace
Blog post 49604 Each blog entry in blogs
Blog comment 7442 Comments added to blog entries
Wall message 38496 Message posted on teachers' wall which is part of teachers' profile
Teacher 222525 Registered teachers working in European schools and, namely "eTwinner"
Quality label 8044 Awarded first to projects. Then the project-involved schools and teachers are
awarded accordingly. They are assigned by each country or on the European
level: National Quality Label and European Quality Label
Prize 1385 eTwinning Prizes are awarded to schools. They are of European level and are
called European eTwinning Prizes
Institution 91077 Various European schools: pre-school, primary, secondary and upper schools
Teachers' performance is recognized in eTwinning in formal ways. Formal recognition consists of "Quality
Label" and "European eTwinning Prizes" as specified above. In addition, eTwinning Reach is a new measure
concept for country assessment and specified as the registered users of a country / teacher population of this
country (Vuorikari et al., 2011). Again, this assessment has its limitations and needs statistical support from
SNA-based learning analytics.
Global Properties of eTwinning Networks
We create four networks using project collaboration between teachers, contact information, blog and blog post,
and wall messaging. These networks are defined as follows
Project network: nodes are teachers (eTwinners) and there is a connection (edge) between two teachers if
they collaborated in at least one project. Edges in the network are undirected and weighted by the number
of projects in which the two teachers collaborate.
Contact network: nodes are teachers and there is an edge between two teachers if at least one teacher is in
the contact list of the other. Edges are undirected and unweighted.
Blog network: nodes are teachers and there is an edge between two teachers if one teacher has commented
on at least one blog post created by the other. Edges are directed and weighted by the number of comments.
Wall network: nodes are teachers and there is an edge between two teachers if one teacher has sent at least
one message to the other. Edges are directed and weighted by the number of messages.
Table 2: Statistics on eTwinning networks
Network #nodes #edges Clustering Average Diameter #compo- Largest
coefficient path length nents component size
Project 37907 804856 0.4016247 3.519308 12 622 25616 (91%)
network (17%)
Contact 109331 573602 0.01694971 4.319833 13 506 108140 (99%)
network (49%)
Blog network 3264 3436 0.009402538 6.830471 22 552 2036 (62%)
(1.4%)
Wall message 23919 30048 0.004086266 9.257115 28 2760 19275 (80%)
network (11%)
We compute global measures as defined in Section 3 for the above networks. The results are presented in Table
2. Several observations can be made here. First, teachers are more active in project, contact and wall message
networks (17%, 49% and 11% of registered teachers, accordingly) than in blog network (only 1.4% of registered
teachers) network. Project and contact networks are densely and well connected, while blog and wall message
networks are quite sparse. This can be seen by the number of edges, average path length, diameter, the number
of components, and the size of giant component in these networks. The giant component exists in all four
networks, but it is bigger in project and contact networks (91% and 99%). Second, project network exposes a
strong community structure with the clustering coefficient of 0.401, while other networks do not (clustering
coefficient are 0.017, 0.009, and 0.004 respectively). Communication between teachers in contact, blog and wall
messaging networks are clustered in disconnected groups, but these groups are not well-connected. These results
raise our special interest in exploring the community structure of the eTwinning project collaboration network.
Specifically, we would like to see whether project collaboration of eTwinners depends on a core community.
Proceedings of the 8th International Conference ISBN 978-1-86220-283-2
on Networked Learning 2012 , Edited by: 5
Hodgson V, Jones C, de Laat M, McConnell D,
Ryberg T & Sloep P
6. We detect the communities in project network using a clustering algorithm proposed by Newman (2004) and get
3070 clusters (including disconnected components) with their sizes as listed in Table 3. The modularity
calculated by the algorithm indicates the quality of clusters. It is the fraction of any node's connections within its
cluster and its connections to other clusters. Empirical observation indicates that the modularity greater than 0.3
corresponds to significant community structures. With the algorithm eTwinning project network receives the
modularity equals 0.486, corresponding to a significant clustering of the project network. This result shows that
eTwinning collaboration depends on a main core of five large communities (LC1-LC5). These clusters are
formed by eTwinners who have collaborated with each other in a high number of projects over a long period of
time. Large number of small communities connects to the core via many gate-keepers.
Table 3: eTwinning project network clusters
Cluster size 8785 7067 4494 2021 1058 100-1000 10- 2-9 Total
(number of eTwinners) (LC1) (LC2) (LC3) (LC4) (LC5) 100
Number of times identified 1 1 1 1 1 11 140 2914 3070
Identification of Social Capital in eTwinning Networks
Now we study the local network structure of nodes (eTwinners) in the networks that make them more effective
in performing tasks, mostly related to projects. We address two questions to identify teachers' social capital in
eTwinning Networks.
First, does this kind of structure exist in eTwinning networks? Fig. 2 depicts the degree distribution of nodes in
four networks. We see that all four networks are complex networks with a power law degree distribution (with a
fat-tail distribution). In complex network theory, the power law degree distribution indicates that super
connectors (or hubs) exist. Super connectors (or hubs) refer to those nodes which connect many nodes or
communities. They play an important role to ensure the connectivity, the information spreading, and behavior
cascading in networks. They also have more power and control over the network than the other nodes which lie
in the tail of the distribution.
Figure 2: Degree distribution of eTwinning networks
Proceedings of the 8th International Conference ISBN 978-1-86220-283-2
on Networked Learning 2012 , Edited by: 6
Hodgson V, Jones C, de Laat M, McConnell D,
Ryberg T & Sloep P
7. Second, how can we identify the network structures that characterize the positions of super connectors in the
networks? As discussed in Section 3, the notion of social capital can be used and there are two forms of social
capital: nodes being embedded in dense groups (identified by high local clustering coefficient) and nodes being
positioned as the interface between different communities (characterized by high betweenness). Furthermore,
which form are eTwinners following? Here we take the aforementioned "quality label" as an indicator for
teachers' performance and reputation. With this indicator, we are able to find the correlation between the
performance and the teachers' positions in the eTwinning network. We compute network properties as well as
number of projects, blogs, massages and contacts as functions of the number of quality labels, as depicted in
Fig. 3. It shows that the properties of local network structure of a node clearly state that being positioned at the
interface between communities has a big advantage, although pure number of projects, blogs, massages and
contacts, and degree of a node somehow are correlated to the quality label. In detail, the nodes (eTwinners) with
a high number of quality labels have very high betweenness and low local clustering coefficient, which indicates
that they connect different communities together. Similarly, the nodes (eTwinners) with a low number of quality
labels have low betweenness and very high local clustering coefficient, which means that they are clustered and
located within the communities.
(a) Quality labels and number of projects/blogs+blog posts/contacts/wall posts (b) Quality labels and degree
1 1
Blog Blog
Contact Contact
0.8 Project 0.8 Project
Wall Wall
Frequency
0.6 0.6
Degree
0.4 0.4
0.2 0.2
0 0
0 10 20 30 40 50 60 70 0 10 20 30 40 50 60 70
Number of quality labels Number of quality labels
(c) Quality labels and betweenness (d) Quality labels and clustering
1 1
Blog Blog
Contact Contact
0.8 Project 0.8 Project
Wall Wall
Betweenness
Clustering
0.6 0.6
0.4 0.4
0.2 0.2
0 0
0 10 20 30 40 50 60 70 0 10 20 30 40 50 60 70
Number of quality labels Number of quality labels
Figure 3: Performance of teachers as functions of the number of project, blog, contacts and wall posts,
degree, betweenness and local clustering coefficient in eTwinning networks
Conclusions and Future Work
Our research results reveal two significant aspects of learning analytics for professional development networks.
First, that the degree distributions follow the power law, which indicates the existence of complex network and
its underlying community structures in the eTwinning professional development network. In this regard, the
project cooperation network is more interesting, because it has a better connectivity than blog contact, and wall
posts networks. The existence of complex networks assures the effective employment of social network analysis
methods to assess roles and positions of single nodes. Second, those teachers who have more quality labels are
indeed more active in project cooperation, blogging, and other activities in eTwinning Portal than the other
teachers. More importantly, the position of teacher in the network can be an indicator or a predictor for their
performance. Lying at the border of different communities has an advantage, since teachers in this position have
more control and power over the network as well as more sources for new information. This form of social
capital is approved through calculation of node and network properties.
So far, we have explored learning analytics for social capital recognition. More analysis approaches with
different learning network data set can be conducted. First, those network properties can also be applied to find
Proceedings of the 8th International Conference ISBN 978-1-86220-283-2
on Networked Learning 2012 , Edited by: 7
Hodgson V, Jones C, de Laat M, McConnell D,
Ryberg T & Sloep P
8. out learners' learning activities based on different learning networks. Do people like to communicate through
new Web 2.0 media such as blogging or the traditional emails? This could help design and development of
learning networks. Second, overlapping community detection can be applied on different networks such as
teachers' wall messaging network, project cooperation network, and contact network. The explored network
properties of those networks in combination can help eTwinning Portal identify "star eTwinners". The research
enlightens us some new thoughts about SNA-based learning analytics for learning networks.
References
Burt, R. S. (2001). Structural Holes versus Network Closure as Social Capital. In N. Lin, K. Cook and R. S.
Burt: Social Capital: Theory and Research. Sociology and Economics: Controversy and Integration series.
New York: Aldine de Gruyter, 2001, pp. 31-56
Breuer, R., Klamma, R, Cao, Y. & Vuorikari, R. (2009). Social Network Analysis of 45,000 Schools: A Case
Study of Technology Enhanced Learning in Europe. Cress, U., Dimitrova, V. and Specht, M. (Eds.)
Learning in the Synergy of Multiple Disciplines, Proceedings of 4th European Conference on Technology
Enhanced Learning, EC-TEL 2009, Nice, France, Sept./Oct. 2009, LNCS 5794, Springer, pp. 166-180.
Cheetham, G. & Chivers, G. (2005). Professions, Competence and Informal Learning. Northampton: Edward
Elgar Publishing.
Coleman, James S. (1988). Social Capital in the Creation of Human Capital. American Journal of Sociology
Vol. 94, pp. 95-125, the University of Chicago Press.
Fetter, S., Rajagopal, K., Berlanga, A.J., & Sloep, P.B. (2011). Ad hoc transient groups: Instruments for
Awareness in Learning Networks. In Workshop on Awareness and Reflection in Learning Networks.
European Conference on Technology Enhanced Learning, (ECTEL, 2011), Palermo, Italy, September, 2011.
Gladwell, M. (2000). The tipping point: how little things can make a big difference, Little, Brown.
Hoadley, M. C. 2005. The shape of the elephant: scope and membership of the CSCL community. In
Proceedings of th 2005 conference on Computer support for collaborative learning: learning 2005: the next
10 years! (CSCL '05). International Society of the Learning Sciences 205-210.
Johnson, L., Smith, R., Willis, H., Levine, A. & Haywood, K. (2011). The 2011 Horizon Report. Austin, Texas:
The New Media Consortium.
Kienle, A., & Wessner, M. (2005). Our way to Taipei: an analysis of the first ten years of the CSCL community.
In Proceedings of th 2005 conference on Computer support for collaborative learning: learning 2005: the
next 10 years! (CSCL '05). International Society of the Learning Sciences 262-271.
Kienle, A., & Wessner, M. (2006). Analysing and cultivating scientific communities of practice. Int J Web
Based Communities 2:377–393.
Newman, M. E. J. (2004). Fast algorithm for detecting community structure in networks. Physics, 69(2), 1-5.
APS. Retrieved from http://arxiv.org/abs/cond-mat/0309508
Pham, M. C. & Klamma, R. (2010). The structure of the computer science knowledge network. Proceedings of
the 2010 IEEE International Conference on Advances in Social Network Analysis and Mining (ASONAM
2010), Aug. 9-11, 2010, Odense, Denmark.
Pham, M., Klamma, R., & Jarke, M. (2011). Development of computer science disciplines: a social network
analysis approach. Social Network Analysis and Mining, Springer Wien, ISSN: 1869-5450
Siemens, G. (2011). EDUCAUSE: Learning Analytics. Nov. 3, 2011, http://www.learninganalytics.net/?p=146.
Song, E., Petrushyna, Z., Cao, Y. & Klamma, R. (2011). Learning Analytics at Large: The Lifelong Learning
Network of 160,000 European Teachers, Towards Ubiquitous Learning - Proceedings of 6th European
Conference on Technology Enhanced Learning, EC-TEL 2011, Palermo, Italy, September 20-13, 2011,
LNCS Vol. 6964, pp. 398-411, Springer.
Vuorikari, R. (2010). Teachers' professional development - An overview of current practice. Central Support
Service for eTwinning (CSS), December, 2010.
Vuorikari, R. et al. (2011). ICT-based School Collaboration, Teachers’ Networks and their Opportunities for
Teachers’ Professional Development - a Case Study on eTwinning. Advanced Web-based Learning -
Proceedings of 10th International Conference on Web-based Learning, ICWL 2011, Hong Kong, December
8-9, 2011, LNCS Vol. 7848, pp.111-120, Springer.
Wasserman, S. & Faust, K. (1994). Social Network Analysis: Methods and Applications. Cambridge University
Press, New York, NY, USA.
Acknowledgments
This research work is supported by the EC Lifelong Learning Programme (LLL) project TeLLNet.
Proceedings of the 8th International Conference ISBN 978-1-86220-283-2
on Networked Learning 2012 , Edited by: 8
Hodgson V, Jones C, de Laat M, McConnell D,
Ryberg T & Sloep P