SlideShare a Scribd company logo
1 of 4
Download to read offline
local market trends
The Real Estate Report
Sඉඖ Fකඉඖඋඑඛඋ඗
The sales price to list price ratio stayed over 100%
for the fourteenth month in a row. At 105.2%, the
ratio hasn't been higher since October 2005.
This is an extraordinarily tough market for buyers.
It’s important to be calm and realistic. If you don’t
know what to do or where to begin,
give me a call and let’s discuss your
situation and your options.
Prices Hit All-Time Highs
Well, that didn't take long. The median price for
single-family, re-sale homes in San Francisco hit
$1,000,000 for the first time ever. The median price
for condos/lofts reached $855,000, also an all-time
high.
Using a 3-month moving average, the median price
for condos/lofts is now up 4% over the last peak in
the market: July 2008. For single-family homes, the
3-month moving average is down 3% from the
peak: June 2007.
With the continued expansion of Silicon Valley into
the Market Street, we can expect demand to
continue to be strong.
The combination of high demand and low inventory
will push prices even higher. As of the 8th of the
month, there were only 506 homes, condos and
lofts for sale in San Francisco. At current rates of
sale, that's three weeks supply. In a normal market
we would see six month's supply!
We are seeing multiple offers on most homes being
sold.
Since January 2012, the 3-month moving average
median price for homes has increased 41%.
APRIL MARKET STATISTICS
Sales of single-family, re-sale homes more than
doubled from March: up 113.3%. Year-over-year,
sales were up 89.1%.
The sales price to list price ratio was 108.2% last
month. That's the highest it has been since
August 2005.
SALES MOMENTUM…
for single-family, re-sale homes in San Francisco
jumped 5.8 points to +7.7. Sales momentum for
condos/lofts dropped 1.9 points to +15.2.
PRICING MOMENTUM…
gained 1.5 points to +14.9. Pricing momentum for
condos/lofts rose 0.9 of a point to +16.1.
WE CALCULATE…
momentum by using a 12-month moving average
to eliminate seasonality. By comparing this year’s
12-month moving average to last year’s, we get a
percentage showing market momentum.
CONDO/LOFT STATISTICS…
Sales were up in April by 5.2% from March. Year-
over-year, sales fell 3.4%.
Hill & Company
1880 Lombard Street
San Francisco 94123
Fax: (415) 202-1686
Cell: (415) 819-2663
AnnieWilliamsSF@gmail.com
http://www.anniewilliamshomes.com
DRE #01393923
Annie Williams
Annie Williams | AnnieWilliamsSF@gmail.com | Fax: (415) 202-1686
JUNE/JULY 2013
Inside This Issue
> LOCAL MARKET TRENDS.....................1
> MORTGAGE RATE OUTLOOK ...............2
> HOME STATISTICS ..............................2
> FORECLOSURE STATS ........................3
> CONDO STATISTICS ............................3
> MOMENTUM CHARTS ..........................4
May 13 Apr 13 May 12
Home Sales: 231 418 235
Median Price: 1,060,000$ 1,000,000$ 781,000$
Average Price: 1,549,607$ 1,365,340$ 1,130,156$
Sale/List Price Ratio: 108.0% 108.2% 103.7%
Days on Market: 31 32 46
May 13 Apr 13 May 12
Condo Sales: 364 285 299
Median Price: 832,500$ 855,000$ 700,000$
Average Price: 988,099$ 992,316$ 807,697$
Sale/List Price Ratio: 104.7% 105.2% 101.9%
Days on Market: 37 38 56
(Lofts/Tow nhomes/TIC)
Trends at a Glance
(Single-family Homes)
Homes: detached
YTD Peak % Trough % Peak Trough
3-month 55% 6% 59% Jun-07 Feb-12
12-month 21% -7% 22% Apr-08 Mar-12
Homes: attached
3-month 36% 7% 40% Jul-08 Jan-12
12-month 23% 3% 23% Aug-08 Jan-12
San Francisco Price Differences
from January 2012 & Peak & Trough
-40.0%
-30.0%
-20.0%
-10.0%
0.0%
10.0%
20.0%
30.0%
40.0%
50.0%
0
8
FMAMJ JASOND0
9
FMAMJ JASOND1
0
FMAMJ JASOND1
1
FMAMJ JASOND1
2
FMAMJ JASOND1
3
FMAM
San Francisco Homes: Year-Over-Year Median Sales Price Change
© 2013 rereport.com
Page 2
The Real Estate Report
The chart above shows the
National monthly average for
30-year fixed rate mortgages
as compiled by HSH.com. The
average includes mortgages of
all sizes, including conforming,
"expanded conforming," and
jumbo.
MORTGAGE RATE OUTLOOK
June 7, 2013 -- If anything, the waters became even
more muddied this week as it pertains to any change
in the Fed's QE policies. The latest data didn't
suggest enough strength to tilt the scale toward a
hastened exit, nor was there enough weakness to
swell hopes that the Fed's process of buying
mortgage-backed securities and Treasuries will
continue for a longer stretch yet.
While not exactly limbo, it does make it more difficult
to know what to expect. The Fed next meets to
discuss policy on June 18 and 19, and will release
updates to their own economic projections at that
time. Until then, the markets will continue to ruminate
over where we go from here,.
This will occur in the context of the highest mortgage
rates in a years' time. Despite remaining well below
historic norms and "natural" record lows (those
achieved pre-Fed market manipulations of the last
five years), at least a few folks have expressed
concerns about rates reaching 4%.
HSH.com's broad-market mortgage tracker -- our
weekly Fixed-Rate Mortgage Indicator (FRMI) --
found that the overall average rate for 30-year fixed-
rate mortgages powered ahead by another nine basis
points (0.09%) to 4.10%, a rise of nearly a half-
percentage point in five weeks' time. At the same
tme, the FRMI's 15-year companion bounded upward
by another seven basis points (0.07%) rise to 3.28%
for the week. FHA-backed 30-year FRMs added
another ten basis points to jump to an average rate of
3.74%, while the most popular ARM -- the 5/1 Hybrid
-- moved the least amount of the bunch, with just a
seven hundredths of a percentage point (0.07%)
upward bump to 2.77% for the week.
So here we are, with mortgage rates no longer
hanging very near record lows, but instead holding in
former-record-low territory. The fact is that the
economic news out this week wasn't poor enough to
help rates decline, not was it strong enough to
suggest that the Fed will go away quickly, or even
soon. With the June Federal Open Market Committee
meeting little more than a week away, there doesn't
seem anything new to suggest that they will begin the
process of tapering when it concludes. At the same
time, there was nothing to suggest that there is any
reason to wait until late this year to begin the
process, either.
3.0% 4.0% 5.0% 6.0% 7.0% 8.0%
01-06
04-06
07-06
10-06
01-07
04-07
07-07
10-07
01-08
04-08
07-08
10-08
01-09
04-09
07-09
10-09
01-10
04-10
07-10
10-10
01-11
04-11
07-11
10-11
01-12
04-12
07-12
10-12
01-13
30-Year Fixed Mortgage Rates
0
50
100
150
200
250
300
$300
$500
$700
$900
$1,100
$1,300
$1,500
0
8
FMAMJ JASOND0
9
FMAMJ JASOND1
0
FMAMJ JASOND1
1
FMAMJ JASOND1
2
FMAMJ JASOND1
3
FMAM
San Francisco Homes: Sold Prices & Unit Sales
(3-month moving average — $000's)
Ave Med Units © 2013 rereport.com
Unit
Median Average Sales DOM SP/LP Median Average Sales Median Average Sales
San Francisco 1,060,000$ 1,549,607$ 231 31 108.0% 35.7% 37.1% -1.7% 6.0% 13.5% -44.7%
D1: Northwest 1,445,000$ 1,760,119$ 21 36 109.3% 20.4% 15.4% 0.0% -10.0% -15.8% -50.0%
D2: Central West 850,000$ 893,096$ 41 21 114.4% 22.3% 21.8% 24.2% -0.6% -4.8% -37.9%
D3: Southwest 850,000$ 920,769$ 13 32 115.2% 58.4% 63.2% 8.3% 27.2% 27.4% -61.8%
D4: Twin Peaks 1,210,000$ 1,362,000$ 31 27 110.8% 31.8% 31.5% -16.2% 8.2% 15.4% -29.5%
D5: Central 1,575,000$ 1,766,645$ 35 31 110.5% 12.5% 9.1% 0.0% -3.4% -4.0% -45.3%
D6: Central North 2,725,000$ 2,728,775$ 4 21 112.1% 83.1% 86.2% 33.3% 147.7% 93.1% -60.0%
D7: North 3,590,000$ 4,422,083$ 24 28 101.7% 24.9% 15.5% 118.2% 21.7% 32.8% 9.1%
D8: Northeast 2,187,500$ 2,187,500$ 2 8 108.2% -29.4% -31.1% -33.3% -71.1% -71.1% -50.0%
D9: Central East 988,000$ 1,048,677$ 26 38 110.5% 31.4% 36.2% 44.4% -2.9% -9.4% -56.7%
D10: Southeast 580,000$ 577,261$ 33 39 107.6% 16.0% 19.3% -32.7% 4.4% 4.6% -54.2%
May Sales Statistics
(Single-family Homes)
Prices Yearly Change Monthly Change
Table Definitions
_______________
Median Price
The price at which 50% of
prices were higher and
50%were lower.
Average Price
Add all prices and divide by the
number of sales.
SP/LP
Sales price to list price ratio or
the price paid for the property
divided by the asking price.
DOI
Days of Inventory, or how many
days it would take to sell all the
property for sale at the current
rate of sales.
Pend
Property under contract to sell
that hasn’t closed escrow.
Inven
Number of properties actively
for sale as of the last day of the
month.
There were no notices of default filed in San Francisco
in May!!!!
There were only four notices of sale filed last month.
After the filing of a Notice of Trustee Sale, there are
only three possible outcomes. First, the sale can be
cancelled for reasons that include a successful loan
modification or short sale, a filing error, or a legal
requirement to re-file the notice after extended
postponements.
Alternatively, if the property is taken to sale, the bank
will place the opening bid. If a third party, typically an
investor, bids more than the bank's opening bid, the
property will be sold to the third party; if not, it will go
back to the bank.
FORECLOSURE STATISTICS
Only one home went back to the bank last month.
There are currently 189 properties scheduled for sale.
With the recent surge in prices, many of them will
probably be cancelled.
The total number of properties owned by the banks was
down 39.6% year-over-year. The banks now own
approximately 351 properties in the city.
For further details and a city-by-city breakdown of
foreclosure statistics, go to http://foreclosureradar.com.
0
50
100
150
200
250
300
350
$300
$400
$500
$600
$700
$800
$900
$1,000
$1,100
0
8
FMAMJ JASOND0
9
FMAMJ JASOND1
0
FMAMJ JASOND1
1
FMAMJ JASOND1
2
FMAMJ JASOND1
3
FMAM
San Francisco Condos: Sold Prices & Unit Sales
(3-month moving average — $000's)
Ave Med Units © 2013 rereport.com
-30.0%
-20.0%
-10.0%
0.0%
10.0%
20.0%
30.0%
40.0%
0
8
FMAMJ JASOND0
9
FMAMJ JASOND1
0
FMAMJ JASOND1
1
FMAMJ JASOND1
2
FMAMJ JASOND1
3
FMAM
San Francisco Condos/Lofts: Year-Over-Year Median Sales Price Change
© 2013 rereport.com
Unit
Median Average Sales DOM SP/LP Median Average Sales Median Average Sales
San Francisco 832,500$ 988,099$ 364 37 104.7% 18.9% 22.3% 21.7% -2.6% -0.4% 27.7%
D1: Northwest 800,000$ 859,515$ 15 36 108.0% 11.5% 5.6% 25.0% -4.2% 6.7% 36.4%
D2: Central West 889,000$ 787,000$ 4 17 112.9% 27.6% 15.3% 0.0% 123.6% 98.0% 100.0%
D3: Southwest 485,000$ 435,667$ 3 20 103.0% 108.8% 92.8% 0.0% 31.1% 14.6% 0.0%
D4: Twin Peaks 465,000$ 529,556$ 9 34 111.5% 82.2% 68.5% 80.0% 41.3% 10.1% 80.0%
D5: Central 950,000$ 998,136$ 59 30 111.4% 29.9% 18.9% 25.5% 2.7% 0.9% 31.1%
D6: Central North 858,500$ 890,396$ 36 31 108.4% 29.6% 17.8% 63.6% 1.8% 0.2% 12.5%
D7: North 1,150,000$ 1,307,488$ 40 75 103.1% 11.7% 3.2% 17.6% 0.0% 11.3% -2.4%
D8: Northeast 787,500$ 1,071,177$ 62 37 101.9% 7.2% 20.9% 21.6% -15.0% -16.9% 26.5%
D9: Central East 803,500$ 983,318$ 126 32 102.4% 25.5% 36.1% 44.8% 5.0% 9.6% 34.0%
D10: Southeast 430,000$ 405,511$ 9 38 102.9% 17.8% 10.1% 125.0% 38.7% 22.7% 200.0%
May Sales Statistics
(Condos/TICs/Co-ops/Lofts)
Prices Yearly Change Monthly Change
The Real Estate Market Trends Report is published and copyrighted by http://rereport.com.
THE REAL ESTATE REPORT
San Francisco
Annie Williams
Hill & Company
1880 Lombard Street
San Francisco 94123
Go online to see the full report
with the district by district breakdown:
HTTP://WWW.ANNIEWILLIAMSHOMES.COM
-25.0
-20.0
-15.0
-10.0
-5.0
0.0
5.0
10.0
15.0
20.0
25.0
0
8
FMAMJ JASOND0
9
FMAMJ JASOND1
0
FMAMJ JASOND1
1
FMAMJ JASOND1
2
FMAMJ JASOND1
3
FMAM
San Francisco Homes: Sales Momentum
Sales Pricing © 2013 rereport.com
-50.0
-40.0
-30.0
-20.0
-10.0
0.0
10.0
20.0
30.0
40.0
0
8
FMAMJ JASOND0
9
FMAMJ JASOND1
0
FMAMJ JASOND1
1
FMAMJ JASOND1
2
FMAMJ JASOND1
3
FMAM
San Francisco Condos/Lofts: Sales Momentum
Sales Pricing © 2013 rereport.com

More Related Content

What's hot

Inventory and Sales Down - Real Estate Report February
Inventory and Sales Down - Real Estate Report FebruaryInventory and Sales Down - Real Estate Report February
Inventory and Sales Down - Real Estate Report FebruaryAMSI, San Francisco
 
Home Sales Pop in March - Real Estate Report April/May
Home Sales Pop in March - Real Estate Report April/MayHome Sales Pop in March - Real Estate Report April/May
Home Sales Pop in March - Real Estate Report April/MayAMSI, San Francisco
 
Lack of Inventory Plagues Market - Real Estate Report August/September
Lack of Inventory Plagues Market - Real Estate Report August/SeptemberLack of Inventory Plagues Market - Real Estate Report August/September
Lack of Inventory Plagues Market - Real Estate Report August/SeptemberAMSI, San Francisco
 
Annie Williams Market Report April-May 2016
Annie Williams Market Report April-May 2016Annie Williams Market Report April-May 2016
Annie Williams Market Report April-May 2016Jon Weaver
 
Prices Down Again in San Francisco - February/March Real Estate Report
Prices Down Again in San Francisco  - February/March Real Estate ReportPrices Down Again in San Francisco  - February/March Real Estate Report
Prices Down Again in San Francisco - February/March Real Estate ReportAMSI, San Francisco
 
Annie Williams Market Trends July-Aug 2014
Annie Williams Market Trends July-Aug 2014Annie Williams Market Trends July-Aug 2014
Annie Williams Market Trends July-Aug 2014Jon Weaver
 
Prices Reach All-Time Highs, Again - Real Estate Report July/August
Prices Reach All-Time Highs, Again - Real Estate Report July/AugustPrices Reach All-Time Highs, Again - Real Estate Report July/August
Prices Reach All-Time Highs, Again - Real Estate Report July/AugustAMSI, San Francisco
 
Home Prices Resume Upward Trend - May/June Real Estate Report
Home Prices Resume Upward Trend - May/June Real Estate ReportHome Prices Resume Upward Trend - May/June Real Estate Report
Home Prices Resume Upward Trend - May/June Real Estate ReportAMSI, San Francisco
 
Real Estate’s New Normal - April/May Real Estate Report
Real Estate’s New Normal  - April/May Real Estate ReportReal Estate’s New Normal  - April/May Real Estate Report
Real Estate’s New Normal - April/May Real Estate ReportAMSI, San Francisco
 
Market Trends May/June 2013
Market Trends May/June 2013Market Trends May/June 2013
Market Trends May/June 2013Jon Weaver
 
AnnieWilliams Market Trends Oct-Nov 2014
AnnieWilliams Market Trends Oct-Nov 2014AnnieWilliams Market Trends Oct-Nov 2014
AnnieWilliams Market Trends Oct-Nov 2014Jon Weaver
 
Jumbo Loans Cheaper Than Conforming Loans - The Real Estate Report September/...
Jumbo Loans Cheaper Than Conforming Loans - The Real Estate Report September/...Jumbo Loans Cheaper Than Conforming Loans - The Real Estate Report September/...
Jumbo Loans Cheaper Than Conforming Loans - The Real Estate Report September/...AMSI, San Francisco
 
Annie Williams: Real Estate Market Trends Sep/Oct 2013
Annie Williams: Real Estate Market Trends Sep/Oct 2013Annie Williams: Real Estate Market Trends Sep/Oct 2013
Annie Williams: Real Estate Market Trends Sep/Oct 2013Jon Weaver
 
Annie Williams Market Trends Aug-Sept 2014
Annie Williams Market Trends Aug-Sept 2014Annie Williams Market Trends Aug-Sept 2014
Annie Williams Market Trends Aug-Sept 2014Jon Weaver
 
Annie Williams Real Estate Report Sept-Oct 2016
Annie Williams Real Estate Report Sept-Oct 2016Annie Williams Real Estate Report Sept-Oct 2016
Annie Williams Real Estate Report Sept-Oct 2016Annie Williams
 
The Real Estate Report May/June - Prices Hit All-Time Highs
The Real Estate Report May/June - Prices Hit All-Time HighsThe Real Estate Report May/June - Prices Hit All-Time Highs
The Real Estate Report May/June - Prices Hit All-Time HighsAMSI, San Francisco
 
Annie Williams Market Trends June-July 2016
Annie Williams Market Trends June-July 2016Annie Williams Market Trends June-July 2016
Annie Williams Market Trends June-July 2016Jon Weaver
 
Annie Williams Market Trends Sept-Oct 2014
Annie Williams Market Trends Sept-Oct 2014Annie Williams Market Trends Sept-Oct 2014
Annie Williams Market Trends Sept-Oct 2014Jon Weaver
 
Annie Williams Real Estate Report - June 2020
Annie Williams Real Estate Report - June 2020Annie Williams Real Estate Report - June 2020
Annie Williams Real Estate Report - June 2020Jon Weaver
 
Annie Williams Market Trends June-July 2015
Annie Williams Market Trends June-July 2015Annie Williams Market Trends June-July 2015
Annie Williams Market Trends June-July 2015Jon Weaver
 

What's hot (20)

Inventory and Sales Down - Real Estate Report February
Inventory and Sales Down - Real Estate Report FebruaryInventory and Sales Down - Real Estate Report February
Inventory and Sales Down - Real Estate Report February
 
Home Sales Pop in March - Real Estate Report April/May
Home Sales Pop in March - Real Estate Report April/MayHome Sales Pop in March - Real Estate Report April/May
Home Sales Pop in March - Real Estate Report April/May
 
Lack of Inventory Plagues Market - Real Estate Report August/September
Lack of Inventory Plagues Market - Real Estate Report August/SeptemberLack of Inventory Plagues Market - Real Estate Report August/September
Lack of Inventory Plagues Market - Real Estate Report August/September
 
Annie Williams Market Report April-May 2016
Annie Williams Market Report April-May 2016Annie Williams Market Report April-May 2016
Annie Williams Market Report April-May 2016
 
Prices Down Again in San Francisco - February/March Real Estate Report
Prices Down Again in San Francisco  - February/March Real Estate ReportPrices Down Again in San Francisco  - February/March Real Estate Report
Prices Down Again in San Francisco - February/March Real Estate Report
 
Annie Williams Market Trends July-Aug 2014
Annie Williams Market Trends July-Aug 2014Annie Williams Market Trends July-Aug 2014
Annie Williams Market Trends July-Aug 2014
 
Prices Reach All-Time Highs, Again - Real Estate Report July/August
Prices Reach All-Time Highs, Again - Real Estate Report July/AugustPrices Reach All-Time Highs, Again - Real Estate Report July/August
Prices Reach All-Time Highs, Again - Real Estate Report July/August
 
Home Prices Resume Upward Trend - May/June Real Estate Report
Home Prices Resume Upward Trend - May/June Real Estate ReportHome Prices Resume Upward Trend - May/June Real Estate Report
Home Prices Resume Upward Trend - May/June Real Estate Report
 
Real Estate’s New Normal - April/May Real Estate Report
Real Estate’s New Normal  - April/May Real Estate ReportReal Estate’s New Normal  - April/May Real Estate Report
Real Estate’s New Normal - April/May Real Estate Report
 
Market Trends May/June 2013
Market Trends May/June 2013Market Trends May/June 2013
Market Trends May/June 2013
 
AnnieWilliams Market Trends Oct-Nov 2014
AnnieWilliams Market Trends Oct-Nov 2014AnnieWilliams Market Trends Oct-Nov 2014
AnnieWilliams Market Trends Oct-Nov 2014
 
Jumbo Loans Cheaper Than Conforming Loans - The Real Estate Report September/...
Jumbo Loans Cheaper Than Conforming Loans - The Real Estate Report September/...Jumbo Loans Cheaper Than Conforming Loans - The Real Estate Report September/...
Jumbo Loans Cheaper Than Conforming Loans - The Real Estate Report September/...
 
Annie Williams: Real Estate Market Trends Sep/Oct 2013
Annie Williams: Real Estate Market Trends Sep/Oct 2013Annie Williams: Real Estate Market Trends Sep/Oct 2013
Annie Williams: Real Estate Market Trends Sep/Oct 2013
 
Annie Williams Market Trends Aug-Sept 2014
Annie Williams Market Trends Aug-Sept 2014Annie Williams Market Trends Aug-Sept 2014
Annie Williams Market Trends Aug-Sept 2014
 
Annie Williams Real Estate Report Sept-Oct 2016
Annie Williams Real Estate Report Sept-Oct 2016Annie Williams Real Estate Report Sept-Oct 2016
Annie Williams Real Estate Report Sept-Oct 2016
 
The Real Estate Report May/June - Prices Hit All-Time Highs
The Real Estate Report May/June - Prices Hit All-Time HighsThe Real Estate Report May/June - Prices Hit All-Time Highs
The Real Estate Report May/June - Prices Hit All-Time Highs
 
Annie Williams Market Trends June-July 2016
Annie Williams Market Trends June-July 2016Annie Williams Market Trends June-July 2016
Annie Williams Market Trends June-July 2016
 
Annie Williams Market Trends Sept-Oct 2014
Annie Williams Market Trends Sept-Oct 2014Annie Williams Market Trends Sept-Oct 2014
Annie Williams Market Trends Sept-Oct 2014
 
Annie Williams Real Estate Report - June 2020
Annie Williams Real Estate Report - June 2020Annie Williams Real Estate Report - June 2020
Annie Williams Real Estate Report - June 2020
 
Annie Williams Market Trends June-July 2015
Annie Williams Market Trends June-July 2015Annie Williams Market Trends June-July 2015
Annie Williams Market Trends June-July 2015
 

Viewers also liked

Annie Williams Market Trends Jan-Feb 2014
Annie Williams Market Trends Jan-Feb 2014Annie Williams Market Trends Jan-Feb 2014
Annie Williams Market Trends Jan-Feb 2014Jon Weaver
 
Annie WilliamsMarket Trends Apr-May 2014
Annie WilliamsMarket Trends Apr-May 2014Annie WilliamsMarket Trends Apr-May 2014
Annie WilliamsMarket Trends Apr-May 2014Jon Weaver
 
Annie Williams: Real Estate Report July/Aug 2013
Annie Williams: Real Estate Report July/Aug 2013Annie Williams: Real Estate Report July/Aug 2013
Annie Williams: Real Estate Report July/Aug 2013Jon Weaver
 
Annie Williams Real Estate Market Trends Aug/Sep 2013
Annie Williams Real Estate Market Trends Aug/Sep 2013Annie Williams Real Estate Market Trends Aug/Sep 2013
Annie Williams Real Estate Market Trends Aug/Sep 2013Jon Weaver
 
Annie Williams - Real Estate Market Trends - Oct/Nov 2013
Annie Williams - Real Estate Market Trends - Oct/Nov 2013Annie Williams - Real Estate Market Trends - Oct/Nov 2013
Annie Williams - Real Estate Market Trends - Oct/Nov 2013Jon Weaver
 
Annie Williams Market Trends Nov-Dec 2014
Annie Williams Market Trends Nov-Dec 2014Annie Williams Market Trends Nov-Dec 2014
Annie Williams Market Trends Nov-Dec 2014Jon Weaver
 
Annie Williams Market Trends Mar & Apr 2014
Annie Williams Market Trends Mar & Apr 2014Annie Williams Market Trends Mar & Apr 2014
Annie Williams Market Trends Mar & Apr 2014Jon Weaver
 
Laporan akhir
Laporan akhirLaporan akhir
Laporan akhiryudhigcgc
 
Annie Williams Market Trends Nov-Dec 2013
Annie Williams Market Trends Nov-Dec 2013Annie Williams Market Trends Nov-Dec 2013
Annie Williams Market Trends Nov-Dec 2013Jon Weaver
 
Melissotarsus data
Melissotarsus dataMelissotarsus data
Melissotarsus dataRoderic Page
 

Viewers also liked (19)

Annie Williams Market Trends Jan-Feb 2014
Annie Williams Market Trends Jan-Feb 2014Annie Williams Market Trends Jan-Feb 2014
Annie Williams Market Trends Jan-Feb 2014
 
Annie WilliamsMarket Trends Apr-May 2014
Annie WilliamsMarket Trends Apr-May 2014Annie WilliamsMarket Trends Apr-May 2014
Annie WilliamsMarket Trends Apr-May 2014
 
Annie Williams: Real Estate Report July/Aug 2013
Annie Williams: Real Estate Report July/Aug 2013Annie Williams: Real Estate Report July/Aug 2013
Annie Williams: Real Estate Report July/Aug 2013
 
Annie Williams Real Estate Market Trends Aug/Sep 2013
Annie Williams Real Estate Market Trends Aug/Sep 2013Annie Williams Real Estate Market Trends Aug/Sep 2013
Annie Williams Real Estate Market Trends Aug/Sep 2013
 
Annie Williams - Real Estate Market Trends - Oct/Nov 2013
Annie Williams - Real Estate Market Trends - Oct/Nov 2013Annie Williams - Real Estate Market Trends - Oct/Nov 2013
Annie Williams - Real Estate Market Trends - Oct/Nov 2013
 
Annie Williams Market Trends Nov-Dec 2014
Annie Williams Market Trends Nov-Dec 2014Annie Williams Market Trends Nov-Dec 2014
Annie Williams Market Trends Nov-Dec 2014
 
Annie Williams Market Trends Mar & Apr 2014
Annie Williams Market Trends Mar & Apr 2014Annie Williams Market Trends Mar & Apr 2014
Annie Williams Market Trends Mar & Apr 2014
 
Laporan akhir
Laporan akhirLaporan akhir
Laporan akhir
 
Kinot
KinotKinot
Kinot
 
Annie Williams Market Trends Nov-Dec 2013
Annie Williams Market Trends Nov-Dec 2013Annie Williams Market Trends Nov-Dec 2013
Annie Williams Market Trends Nov-Dec 2013
 
Dr. Sharratt Olympia WSU
Dr. Sharratt Olympia WSU Dr. Sharratt Olympia WSU
Dr. Sharratt Olympia WSU
 
manifest'09
manifest'09manifest'09
manifest'09
 
Melissotarsus data
Melissotarsus dataMelissotarsus data
Melissotarsus data
 
Jav
JavJav
Jav
 
Financial Express August 12, 2009
Financial Express August 12, 2009Financial Express August 12, 2009
Financial Express August 12, 2009
 
Ed psy 510 7th class 2014
Ed psy 510 7th class 2014Ed psy 510 7th class 2014
Ed psy 510 7th class 2014
 
numaticos
numaticosnumaticos
numaticos
 
Alexander Sanchez
Alexander SanchezAlexander Sanchez
Alexander Sanchez
 
CAR Email 6.7.02 (j)
CAR Email 6.7.02 (j)CAR Email 6.7.02 (j)
CAR Email 6.7.02 (j)
 

Similar to Market Trends - June/July 2013

Annie Williams Market Trends July-Aug 2015
Annie Williams Market Trends July-Aug 2015Annie Williams Market Trends July-Aug 2015
Annie Williams Market Trends July-Aug 2015Jon Weaver
 
Annie Williams Market Trends March-April 2015
Annie Williams Market Trends March-April 2015Annie Williams Market Trends March-April 2015
Annie Williams Market Trends March-April 2015Jon Weaver
 
Annie Williams Market Trends April-May 2015
Annie Williams Market Trends April-May 2015Annie Williams Market Trends April-May 2015
Annie Williams Market Trends April-May 2015Jon Weaver
 
Spring Surge Continues - The Real Estate Report May/June
Spring Surge Continues - The Real Estate Report May/JuneSpring Surge Continues - The Real Estate Report May/June
Spring Surge Continues - The Real Estate Report May/JuneAMSI, San Francisco
 
Recovery Continues - The Real Estate Report April/May
Recovery Continues - The Real Estate Report April/MayRecovery Continues - The Real Estate Report April/May
Recovery Continues - The Real Estate Report April/MayAMSI, San Francisco
 
Market Takes a Breather - The Real Estate Report July/August
Market Takes a Breather -  The Real Estate Report July/AugustMarket Takes a Breather -  The Real Estate Report July/August
Market Takes a Breather - The Real Estate Report July/AugustAMSI, San Francisco
 
Inventory Dominates Market - The Real Estate Report April/Mai
Inventory Dominates Market -  The Real Estate Report April/MaiInventory Dominates Market -  The Real Estate Report April/Mai
Inventory Dominates Market - The Real Estate Report April/MaiAMSI, San Francisco
 
Mortgage Closing Costs Rising - The Real Estate Report August/September
Mortgage Closing Costs Rising - The Real Estate Report August/SeptemberMortgage Closing Costs Rising - The Real Estate Report August/September
Mortgage Closing Costs Rising - The Real Estate Report August/SeptemberAMSI, San Francisco
 
Annie Williams Real Estate Report - November 2020
Annie Williams Real Estate Report - November 2020Annie Williams Real Estate Report - November 2020
Annie Williams Real Estate Report - November 2020Jon Weaver
 
Annie Williams Real Estate Report May-June 2017
Annie Williams Real Estate Report May-June 2017Annie Williams Real Estate Report May-June 2017
Annie Williams Real Estate Report May-June 2017Jon Weaver
 
Annie Williams Real Estate Report - November 2019
Annie Williams Real Estate Report - November 2019Annie Williams Real Estate Report - November 2019
Annie Williams Real Estate Report - November 2019Jon Weaver
 

Similar to Market Trends - June/July 2013 (11)

Annie Williams Market Trends July-Aug 2015
Annie Williams Market Trends July-Aug 2015Annie Williams Market Trends July-Aug 2015
Annie Williams Market Trends July-Aug 2015
 
Annie Williams Market Trends March-April 2015
Annie Williams Market Trends March-April 2015Annie Williams Market Trends March-April 2015
Annie Williams Market Trends March-April 2015
 
Annie Williams Market Trends April-May 2015
Annie Williams Market Trends April-May 2015Annie Williams Market Trends April-May 2015
Annie Williams Market Trends April-May 2015
 
Spring Surge Continues - The Real Estate Report May/June
Spring Surge Continues - The Real Estate Report May/JuneSpring Surge Continues - The Real Estate Report May/June
Spring Surge Continues - The Real Estate Report May/June
 
Recovery Continues - The Real Estate Report April/May
Recovery Continues - The Real Estate Report April/MayRecovery Continues - The Real Estate Report April/May
Recovery Continues - The Real Estate Report April/May
 
Market Takes a Breather - The Real Estate Report July/August
Market Takes a Breather -  The Real Estate Report July/AugustMarket Takes a Breather -  The Real Estate Report July/August
Market Takes a Breather - The Real Estate Report July/August
 
Inventory Dominates Market - The Real Estate Report April/Mai
Inventory Dominates Market -  The Real Estate Report April/MaiInventory Dominates Market -  The Real Estate Report April/Mai
Inventory Dominates Market - The Real Estate Report April/Mai
 
Mortgage Closing Costs Rising - The Real Estate Report August/September
Mortgage Closing Costs Rising - The Real Estate Report August/SeptemberMortgage Closing Costs Rising - The Real Estate Report August/September
Mortgage Closing Costs Rising - The Real Estate Report August/September
 
Annie Williams Real Estate Report - November 2020
Annie Williams Real Estate Report - November 2020Annie Williams Real Estate Report - November 2020
Annie Williams Real Estate Report - November 2020
 
Annie Williams Real Estate Report May-June 2017
Annie Williams Real Estate Report May-June 2017Annie Williams Real Estate Report May-June 2017
Annie Williams Real Estate Report May-June 2017
 
Annie Williams Real Estate Report - November 2019
Annie Williams Real Estate Report - November 2019Annie Williams Real Estate Report - November 2019
Annie Williams Real Estate Report - November 2019
 

Recently uploaded

Call Girls in DELHI Cantt, ( Call Me )-8377877756-Female Escort- In Delhi / Ncr
Call Girls in DELHI Cantt, ( Call Me )-8377877756-Female Escort- In Delhi / NcrCall Girls in DELHI Cantt, ( Call Me )-8377877756-Female Escort- In Delhi / Ncr
Call Girls in DELHI Cantt, ( Call Me )-8377877756-Female Escort- In Delhi / Ncrdollysharma2066
 
Case study on tata clothing brand zudio in detail
Case study on tata clothing brand zudio in detailCase study on tata clothing brand zudio in detail
Case study on tata clothing brand zudio in detailAriel592675
 
Marketing Management Business Plan_My Sweet Creations
Marketing Management Business Plan_My Sweet CreationsMarketing Management Business Plan_My Sweet Creations
Marketing Management Business Plan_My Sweet Creationsnakalysalcedo61
 
Market Sizes Sample Report - 2024 Edition
Market Sizes Sample Report - 2024 EditionMarket Sizes Sample Report - 2024 Edition
Market Sizes Sample Report - 2024 EditionMintel Group
 
Call US-88OO1O2216 Call Girls In Mahipalpur Female Escort Service
Call US-88OO1O2216 Call Girls In Mahipalpur Female Escort ServiceCall US-88OO1O2216 Call Girls In Mahipalpur Female Escort Service
Call US-88OO1O2216 Call Girls In Mahipalpur Female Escort Servicecallgirls2057
 
Global Scenario On Sustainable and Resilient Coconut Industry by Dr. Jelfina...
Global Scenario On Sustainable  and Resilient Coconut Industry by Dr. Jelfina...Global Scenario On Sustainable  and Resilient Coconut Industry by Dr. Jelfina...
Global Scenario On Sustainable and Resilient Coconut Industry by Dr. Jelfina...ictsugar
 
Cash Payment 9602870969 Escort Service in Udaipur Call Girls
Cash Payment 9602870969 Escort Service in Udaipur Call GirlsCash Payment 9602870969 Escort Service in Udaipur Call Girls
Cash Payment 9602870969 Escort Service in Udaipur Call GirlsApsara Of India
 
Call Girls Miyapur 7001305949 all area service COD available Any Time
Call Girls Miyapur 7001305949 all area service COD available Any TimeCall Girls Miyapur 7001305949 all area service COD available Any Time
Call Girls Miyapur 7001305949 all area service COD available Any Timedelhimodelshub1
 
Call Girls In Sikandarpur Gurgaon ❤️8860477959_Russian 100% Genuine Escorts I...
Call Girls In Sikandarpur Gurgaon ❤️8860477959_Russian 100% Genuine Escorts I...Call Girls In Sikandarpur Gurgaon ❤️8860477959_Russian 100% Genuine Escorts I...
Call Girls In Sikandarpur Gurgaon ❤️8860477959_Russian 100% Genuine Escorts I...lizamodels9
 
8447779800, Low rate Call girls in Tughlakabad Delhi NCR
8447779800, Low rate Call girls in Tughlakabad Delhi NCR8447779800, Low rate Call girls in Tughlakabad Delhi NCR
8447779800, Low rate Call girls in Tughlakabad Delhi NCRashishs7044
 
Sales & Marketing Alignment: How to Synergize for Success
Sales & Marketing Alignment: How to Synergize for SuccessSales & Marketing Alignment: How to Synergize for Success
Sales & Marketing Alignment: How to Synergize for SuccessAggregage
 
FULL ENJOY Call girls in Paharganj Delhi | 8377087607
FULL ENJOY Call girls in Paharganj Delhi | 8377087607FULL ENJOY Call girls in Paharganj Delhi | 8377087607
FULL ENJOY Call girls in Paharganj Delhi | 8377087607dollysharma2066
 
Call Girls In Sikandarpur Gurgaon ❤️8860477959_Russian 100% Genuine Escorts I...
Call Girls In Sikandarpur Gurgaon ❤️8860477959_Russian 100% Genuine Escorts I...Call Girls In Sikandarpur Gurgaon ❤️8860477959_Russian 100% Genuine Escorts I...
Call Girls In Sikandarpur Gurgaon ❤️8860477959_Russian 100% Genuine Escorts I...lizamodels9
 
8447779800, Low rate Call girls in Kotla Mubarakpur Delhi NCR
8447779800, Low rate Call girls in Kotla Mubarakpur Delhi NCR8447779800, Low rate Call girls in Kotla Mubarakpur Delhi NCR
8447779800, Low rate Call girls in Kotla Mubarakpur Delhi NCRashishs7044
 
VIP Kolkata Call Girl Howrah 👉 8250192130 Available With Room
VIP Kolkata Call Girl Howrah 👉 8250192130  Available With RoomVIP Kolkata Call Girl Howrah 👉 8250192130  Available With Room
VIP Kolkata Call Girl Howrah 👉 8250192130 Available With Roomdivyansh0kumar0
 
Tech Startup Growth Hacking 101 - Basics on Growth Marketing
Tech Startup Growth Hacking 101  - Basics on Growth MarketingTech Startup Growth Hacking 101  - Basics on Growth Marketing
Tech Startup Growth Hacking 101 - Basics on Growth MarketingShawn Pang
 
Flow Your Strategy at Flight Levels Day 2024
Flow Your Strategy at Flight Levels Day 2024Flow Your Strategy at Flight Levels Day 2024
Flow Your Strategy at Flight Levels Day 2024Kirill Klimov
 
Keppel Ltd. 1Q 2024 Business Update Presentation Slides
Keppel Ltd. 1Q 2024 Business Update  Presentation SlidesKeppel Ltd. 1Q 2024 Business Update  Presentation Slides
Keppel Ltd. 1Q 2024 Business Update Presentation SlidesKeppelCorporation
 
(8264348440) 🔝 Call Girls In Mahipalpur 🔝 Delhi NCR
(8264348440) 🔝 Call Girls In Mahipalpur 🔝 Delhi NCR(8264348440) 🔝 Call Girls In Mahipalpur 🔝 Delhi NCR
(8264348440) 🔝 Call Girls In Mahipalpur 🔝 Delhi NCRsoniya singh
 
Call Us 📲8800102216📞 Call Girls In DLF City Gurgaon
Call Us 📲8800102216📞 Call Girls In DLF City GurgaonCall Us 📲8800102216📞 Call Girls In DLF City Gurgaon
Call Us 📲8800102216📞 Call Girls In DLF City Gurgaoncallgirls2057
 

Recently uploaded (20)

Call Girls in DELHI Cantt, ( Call Me )-8377877756-Female Escort- In Delhi / Ncr
Call Girls in DELHI Cantt, ( Call Me )-8377877756-Female Escort- In Delhi / NcrCall Girls in DELHI Cantt, ( Call Me )-8377877756-Female Escort- In Delhi / Ncr
Call Girls in DELHI Cantt, ( Call Me )-8377877756-Female Escort- In Delhi / Ncr
 
Case study on tata clothing brand zudio in detail
Case study on tata clothing brand zudio in detailCase study on tata clothing brand zudio in detail
Case study on tata clothing brand zudio in detail
 
Marketing Management Business Plan_My Sweet Creations
Marketing Management Business Plan_My Sweet CreationsMarketing Management Business Plan_My Sweet Creations
Marketing Management Business Plan_My Sweet Creations
 
Market Sizes Sample Report - 2024 Edition
Market Sizes Sample Report - 2024 EditionMarket Sizes Sample Report - 2024 Edition
Market Sizes Sample Report - 2024 Edition
 
Call US-88OO1O2216 Call Girls In Mahipalpur Female Escort Service
Call US-88OO1O2216 Call Girls In Mahipalpur Female Escort ServiceCall US-88OO1O2216 Call Girls In Mahipalpur Female Escort Service
Call US-88OO1O2216 Call Girls In Mahipalpur Female Escort Service
 
Global Scenario On Sustainable and Resilient Coconut Industry by Dr. Jelfina...
Global Scenario On Sustainable  and Resilient Coconut Industry by Dr. Jelfina...Global Scenario On Sustainable  and Resilient Coconut Industry by Dr. Jelfina...
Global Scenario On Sustainable and Resilient Coconut Industry by Dr. Jelfina...
 
Cash Payment 9602870969 Escort Service in Udaipur Call Girls
Cash Payment 9602870969 Escort Service in Udaipur Call GirlsCash Payment 9602870969 Escort Service in Udaipur Call Girls
Cash Payment 9602870969 Escort Service in Udaipur Call Girls
 
Call Girls Miyapur 7001305949 all area service COD available Any Time
Call Girls Miyapur 7001305949 all area service COD available Any TimeCall Girls Miyapur 7001305949 all area service COD available Any Time
Call Girls Miyapur 7001305949 all area service COD available Any Time
 
Call Girls In Sikandarpur Gurgaon ❤️8860477959_Russian 100% Genuine Escorts I...
Call Girls In Sikandarpur Gurgaon ❤️8860477959_Russian 100% Genuine Escorts I...Call Girls In Sikandarpur Gurgaon ❤️8860477959_Russian 100% Genuine Escorts I...
Call Girls In Sikandarpur Gurgaon ❤️8860477959_Russian 100% Genuine Escorts I...
 
8447779800, Low rate Call girls in Tughlakabad Delhi NCR
8447779800, Low rate Call girls in Tughlakabad Delhi NCR8447779800, Low rate Call girls in Tughlakabad Delhi NCR
8447779800, Low rate Call girls in Tughlakabad Delhi NCR
 
Sales & Marketing Alignment: How to Synergize for Success
Sales & Marketing Alignment: How to Synergize for SuccessSales & Marketing Alignment: How to Synergize for Success
Sales & Marketing Alignment: How to Synergize for Success
 
FULL ENJOY Call girls in Paharganj Delhi | 8377087607
FULL ENJOY Call girls in Paharganj Delhi | 8377087607FULL ENJOY Call girls in Paharganj Delhi | 8377087607
FULL ENJOY Call girls in Paharganj Delhi | 8377087607
 
Call Girls In Sikandarpur Gurgaon ❤️8860477959_Russian 100% Genuine Escorts I...
Call Girls In Sikandarpur Gurgaon ❤️8860477959_Russian 100% Genuine Escorts I...Call Girls In Sikandarpur Gurgaon ❤️8860477959_Russian 100% Genuine Escorts I...
Call Girls In Sikandarpur Gurgaon ❤️8860477959_Russian 100% Genuine Escorts I...
 
8447779800, Low rate Call girls in Kotla Mubarakpur Delhi NCR
8447779800, Low rate Call girls in Kotla Mubarakpur Delhi NCR8447779800, Low rate Call girls in Kotla Mubarakpur Delhi NCR
8447779800, Low rate Call girls in Kotla Mubarakpur Delhi NCR
 
VIP Kolkata Call Girl Howrah 👉 8250192130 Available With Room
VIP Kolkata Call Girl Howrah 👉 8250192130  Available With RoomVIP Kolkata Call Girl Howrah 👉 8250192130  Available With Room
VIP Kolkata Call Girl Howrah 👉 8250192130 Available With Room
 
Tech Startup Growth Hacking 101 - Basics on Growth Marketing
Tech Startup Growth Hacking 101  - Basics on Growth MarketingTech Startup Growth Hacking 101  - Basics on Growth Marketing
Tech Startup Growth Hacking 101 - Basics on Growth Marketing
 
Flow Your Strategy at Flight Levels Day 2024
Flow Your Strategy at Flight Levels Day 2024Flow Your Strategy at Flight Levels Day 2024
Flow Your Strategy at Flight Levels Day 2024
 
Keppel Ltd. 1Q 2024 Business Update Presentation Slides
Keppel Ltd. 1Q 2024 Business Update  Presentation SlidesKeppel Ltd. 1Q 2024 Business Update  Presentation Slides
Keppel Ltd. 1Q 2024 Business Update Presentation Slides
 
(8264348440) 🔝 Call Girls In Mahipalpur 🔝 Delhi NCR
(8264348440) 🔝 Call Girls In Mahipalpur 🔝 Delhi NCR(8264348440) 🔝 Call Girls In Mahipalpur 🔝 Delhi NCR
(8264348440) 🔝 Call Girls In Mahipalpur 🔝 Delhi NCR
 
Call Us 📲8800102216📞 Call Girls In DLF City Gurgaon
Call Us 📲8800102216📞 Call Girls In DLF City GurgaonCall Us 📲8800102216📞 Call Girls In DLF City Gurgaon
Call Us 📲8800102216📞 Call Girls In DLF City Gurgaon
 

Market Trends - June/July 2013

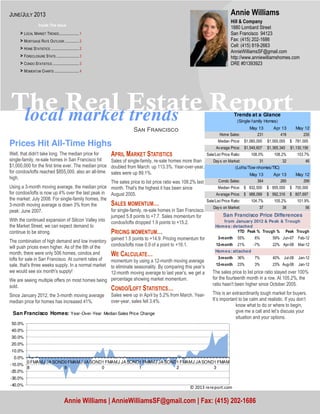
  • 1. local market trends The Real Estate Report Sඉඖ Fකඉඖඋඑඛඋ඗ The sales price to list price ratio stayed over 100% for the fourteenth month in a row. At 105.2%, the ratio hasn't been higher since October 2005. This is an extraordinarily tough market for buyers. It’s important to be calm and realistic. If you don’t know what to do or where to begin, give me a call and let’s discuss your situation and your options. Prices Hit All-Time Highs Well, that didn't take long. The median price for single-family, re-sale homes in San Francisco hit $1,000,000 for the first time ever. The median price for condos/lofts reached $855,000, also an all-time high. Using a 3-month moving average, the median price for condos/lofts is now up 4% over the last peak in the market: July 2008. For single-family homes, the 3-month moving average is down 3% from the peak: June 2007. With the continued expansion of Silicon Valley into the Market Street, we can expect demand to continue to be strong. The combination of high demand and low inventory will push prices even higher. As of the 8th of the month, there were only 506 homes, condos and lofts for sale in San Francisco. At current rates of sale, that's three weeks supply. In a normal market we would see six month's supply! We are seeing multiple offers on most homes being sold. Since January 2012, the 3-month moving average median price for homes has increased 41%. APRIL MARKET STATISTICS Sales of single-family, re-sale homes more than doubled from March: up 113.3%. Year-over-year, sales were up 89.1%. The sales price to list price ratio was 108.2% last month. That's the highest it has been since August 2005. SALES MOMENTUM… for single-family, re-sale homes in San Francisco jumped 5.8 points to +7.7. Sales momentum for condos/lofts dropped 1.9 points to +15.2. PRICING MOMENTUM… gained 1.5 points to +14.9. Pricing momentum for condos/lofts rose 0.9 of a point to +16.1. WE CALCULATE… momentum by using a 12-month moving average to eliminate seasonality. By comparing this year’s 12-month moving average to last year’s, we get a percentage showing market momentum. CONDO/LOFT STATISTICS… Sales were up in April by 5.2% from March. Year- over-year, sales fell 3.4%. Hill & Company 1880 Lombard Street San Francisco 94123 Fax: (415) 202-1686 Cell: (415) 819-2663 AnnieWilliamsSF@gmail.com http://www.anniewilliamshomes.com DRE #01393923 Annie Williams Annie Williams | AnnieWilliamsSF@gmail.com | Fax: (415) 202-1686 JUNE/JULY 2013 Inside This Issue > LOCAL MARKET TRENDS.....................1 > MORTGAGE RATE OUTLOOK ...............2 > HOME STATISTICS ..............................2 > FORECLOSURE STATS ........................3 > CONDO STATISTICS ............................3 > MOMENTUM CHARTS ..........................4 May 13 Apr 13 May 12 Home Sales: 231 418 235 Median Price: 1,060,000$ 1,000,000$ 781,000$ Average Price: 1,549,607$ 1,365,340$ 1,130,156$ Sale/List Price Ratio: 108.0% 108.2% 103.7% Days on Market: 31 32 46 May 13 Apr 13 May 12 Condo Sales: 364 285 299 Median Price: 832,500$ 855,000$ 700,000$ Average Price: 988,099$ 992,316$ 807,697$ Sale/List Price Ratio: 104.7% 105.2% 101.9% Days on Market: 37 38 56 (Lofts/Tow nhomes/TIC) Trends at a Glance (Single-family Homes) Homes: detached YTD Peak % Trough % Peak Trough 3-month 55% 6% 59% Jun-07 Feb-12 12-month 21% -7% 22% Apr-08 Mar-12 Homes: attached 3-month 36% 7% 40% Jul-08 Jan-12 12-month 23% 3% 23% Aug-08 Jan-12 San Francisco Price Differences from January 2012 & Peak & Trough -40.0% -30.0% -20.0% -10.0% 0.0% 10.0% 20.0% 30.0% 40.0% 50.0% 0 8 FMAMJ JASOND0 9 FMAMJ JASOND1 0 FMAMJ JASOND1 1 FMAMJ JASOND1 2 FMAMJ JASOND1 3 FMAM San Francisco Homes: Year-Over-Year Median Sales Price Change © 2013 rereport.com
  • 2. Page 2 The Real Estate Report The chart above shows the National monthly average for 30-year fixed rate mortgages as compiled by HSH.com. The average includes mortgages of all sizes, including conforming, "expanded conforming," and jumbo. MORTGAGE RATE OUTLOOK June 7, 2013 -- If anything, the waters became even more muddied this week as it pertains to any change in the Fed's QE policies. The latest data didn't suggest enough strength to tilt the scale toward a hastened exit, nor was there enough weakness to swell hopes that the Fed's process of buying mortgage-backed securities and Treasuries will continue for a longer stretch yet. While not exactly limbo, it does make it more difficult to know what to expect. The Fed next meets to discuss policy on June 18 and 19, and will release updates to their own economic projections at that time. Until then, the markets will continue to ruminate over where we go from here,. This will occur in the context of the highest mortgage rates in a years' time. Despite remaining well below historic norms and "natural" record lows (those achieved pre-Fed market manipulations of the last five years), at least a few folks have expressed concerns about rates reaching 4%. HSH.com's broad-market mortgage tracker -- our weekly Fixed-Rate Mortgage Indicator (FRMI) -- found that the overall average rate for 30-year fixed- rate mortgages powered ahead by another nine basis points (0.09%) to 4.10%, a rise of nearly a half- percentage point in five weeks' time. At the same tme, the FRMI's 15-year companion bounded upward by another seven basis points (0.07%) rise to 3.28% for the week. FHA-backed 30-year FRMs added another ten basis points to jump to an average rate of 3.74%, while the most popular ARM -- the 5/1 Hybrid -- moved the least amount of the bunch, with just a seven hundredths of a percentage point (0.07%) upward bump to 2.77% for the week. So here we are, with mortgage rates no longer hanging very near record lows, but instead holding in former-record-low territory. The fact is that the economic news out this week wasn't poor enough to help rates decline, not was it strong enough to suggest that the Fed will go away quickly, or even soon. With the June Federal Open Market Committee meeting little more than a week away, there doesn't seem anything new to suggest that they will begin the process of tapering when it concludes. At the same time, there was nothing to suggest that there is any reason to wait until late this year to begin the process, either. 3.0% 4.0% 5.0% 6.0% 7.0% 8.0% 01-06 04-06 07-06 10-06 01-07 04-07 07-07 10-07 01-08 04-08 07-08 10-08 01-09 04-09 07-09 10-09 01-10 04-10 07-10 10-10 01-11 04-11 07-11 10-11 01-12 04-12 07-12 10-12 01-13 30-Year Fixed Mortgage Rates 0 50 100 150 200 250 300 $300 $500 $700 $900 $1,100 $1,300 $1,500 0 8 FMAMJ JASOND0 9 FMAMJ JASOND1 0 FMAMJ JASOND1 1 FMAMJ JASOND1 2 FMAMJ JASOND1 3 FMAM San Francisco Homes: Sold Prices & Unit Sales (3-month moving average — $000's) Ave Med Units © 2013 rereport.com Unit Median Average Sales DOM SP/LP Median Average Sales Median Average Sales San Francisco 1,060,000$ 1,549,607$ 231 31 108.0% 35.7% 37.1% -1.7% 6.0% 13.5% -44.7% D1: Northwest 1,445,000$ 1,760,119$ 21 36 109.3% 20.4% 15.4% 0.0% -10.0% -15.8% -50.0% D2: Central West 850,000$ 893,096$ 41 21 114.4% 22.3% 21.8% 24.2% -0.6% -4.8% -37.9% D3: Southwest 850,000$ 920,769$ 13 32 115.2% 58.4% 63.2% 8.3% 27.2% 27.4% -61.8% D4: Twin Peaks 1,210,000$ 1,362,000$ 31 27 110.8% 31.8% 31.5% -16.2% 8.2% 15.4% -29.5% D5: Central 1,575,000$ 1,766,645$ 35 31 110.5% 12.5% 9.1% 0.0% -3.4% -4.0% -45.3% D6: Central North 2,725,000$ 2,728,775$ 4 21 112.1% 83.1% 86.2% 33.3% 147.7% 93.1% -60.0% D7: North 3,590,000$ 4,422,083$ 24 28 101.7% 24.9% 15.5% 118.2% 21.7% 32.8% 9.1% D8: Northeast 2,187,500$ 2,187,500$ 2 8 108.2% -29.4% -31.1% -33.3% -71.1% -71.1% -50.0% D9: Central East 988,000$ 1,048,677$ 26 38 110.5% 31.4% 36.2% 44.4% -2.9% -9.4% -56.7% D10: Southeast 580,000$ 577,261$ 33 39 107.6% 16.0% 19.3% -32.7% 4.4% 4.6% -54.2% May Sales Statistics (Single-family Homes) Prices Yearly Change Monthly Change
  • 3. Table Definitions _______________ Median Price The price at which 50% of prices were higher and 50%were lower. Average Price Add all prices and divide by the number of sales. SP/LP Sales price to list price ratio or the price paid for the property divided by the asking price. DOI Days of Inventory, or how many days it would take to sell all the property for sale at the current rate of sales. Pend Property under contract to sell that hasn’t closed escrow. Inven Number of properties actively for sale as of the last day of the month. There were no notices of default filed in San Francisco in May!!!! There were only four notices of sale filed last month. After the filing of a Notice of Trustee Sale, there are only three possible outcomes. First, the sale can be cancelled for reasons that include a successful loan modification or short sale, a filing error, or a legal requirement to re-file the notice after extended postponements. Alternatively, if the property is taken to sale, the bank will place the opening bid. If a third party, typically an investor, bids more than the bank's opening bid, the property will be sold to the third party; if not, it will go back to the bank. FORECLOSURE STATISTICS Only one home went back to the bank last month. There are currently 189 properties scheduled for sale. With the recent surge in prices, many of them will probably be cancelled. The total number of properties owned by the banks was down 39.6% year-over-year. The banks now own approximately 351 properties in the city. For further details and a city-by-city breakdown of foreclosure statistics, go to http://foreclosureradar.com. 0 50 100 150 200 250 300 350 $300 $400 $500 $600 $700 $800 $900 $1,000 $1,100 0 8 FMAMJ JASOND0 9 FMAMJ JASOND1 0 FMAMJ JASOND1 1 FMAMJ JASOND1 2 FMAMJ JASOND1 3 FMAM San Francisco Condos: Sold Prices & Unit Sales (3-month moving average — $000's) Ave Med Units © 2013 rereport.com -30.0% -20.0% -10.0% 0.0% 10.0% 20.0% 30.0% 40.0% 0 8 FMAMJ JASOND0 9 FMAMJ JASOND1 0 FMAMJ JASOND1 1 FMAMJ JASOND1 2 FMAMJ JASOND1 3 FMAM San Francisco Condos/Lofts: Year-Over-Year Median Sales Price Change © 2013 rereport.com Unit Median Average Sales DOM SP/LP Median Average Sales Median Average Sales San Francisco 832,500$ 988,099$ 364 37 104.7% 18.9% 22.3% 21.7% -2.6% -0.4% 27.7% D1: Northwest 800,000$ 859,515$ 15 36 108.0% 11.5% 5.6% 25.0% -4.2% 6.7% 36.4% D2: Central West 889,000$ 787,000$ 4 17 112.9% 27.6% 15.3% 0.0% 123.6% 98.0% 100.0% D3: Southwest 485,000$ 435,667$ 3 20 103.0% 108.8% 92.8% 0.0% 31.1% 14.6% 0.0% D4: Twin Peaks 465,000$ 529,556$ 9 34 111.5% 82.2% 68.5% 80.0% 41.3% 10.1% 80.0% D5: Central 950,000$ 998,136$ 59 30 111.4% 29.9% 18.9% 25.5% 2.7% 0.9% 31.1% D6: Central North 858,500$ 890,396$ 36 31 108.4% 29.6% 17.8% 63.6% 1.8% 0.2% 12.5% D7: North 1,150,000$ 1,307,488$ 40 75 103.1% 11.7% 3.2% 17.6% 0.0% 11.3% -2.4% D8: Northeast 787,500$ 1,071,177$ 62 37 101.9% 7.2% 20.9% 21.6% -15.0% -16.9% 26.5% D9: Central East 803,500$ 983,318$ 126 32 102.4% 25.5% 36.1% 44.8% 5.0% 9.6% 34.0% D10: Southeast 430,000$ 405,511$ 9 38 102.9% 17.8% 10.1% 125.0% 38.7% 22.7% 200.0% May Sales Statistics (Condos/TICs/Co-ops/Lofts) Prices Yearly Change Monthly Change
  • 4. The Real Estate Market Trends Report is published and copyrighted by http://rereport.com. THE REAL ESTATE REPORT San Francisco Annie Williams Hill & Company 1880 Lombard Street San Francisco 94123 Go online to see the full report with the district by district breakdown: HTTP://WWW.ANNIEWILLIAMSHOMES.COM -25.0 -20.0 -15.0 -10.0 -5.0 0.0 5.0 10.0 15.0 20.0 25.0 0 8 FMAMJ JASOND0 9 FMAMJ JASOND1 0 FMAMJ JASOND1 1 FMAMJ JASOND1 2 FMAMJ JASOND1 3 FMAM San Francisco Homes: Sales Momentum Sales Pricing © 2013 rereport.com -50.0 -40.0 -30.0 -20.0 -10.0 0.0 10.0 20.0 30.0 40.0 0 8 FMAMJ JASOND0 9 FMAMJ JASOND1 0 FMAMJ JASOND1 1 FMAMJ JASOND1 2 FMAMJ JASOND1 3 FMAM San Francisco Condos/Lofts: Sales Momentum Sales Pricing © 2013 rereport.com