More Related Content Similar to Annie Williams Real Estate Report Sept-Oct 2016 (20) More from Annie Williams (20) 1. The Real Estate Report
The median price for single-family, re-sale homes
and condos/townhomes rose for the third month in
a row in August. The median price for homes has
been higher than the year before every month but
one since March 2015.
Of note, while prices have been higher than the
year before, the double-digit gains that
predominated in 2015 have slowed to single-digit
gains in 2016.
Sales, meanwhile, have been anemic. Home sales
have been lower ten of the past thirteen months.
Condo sales have been lower sixteen of the past
twenty months. Year-to-date, home sales are down
7.7% and condo/townhome sales are off 6.5%.
It looks like the market is moderating after the
frenzy of last year. The sales price to list price ratio
for homes, which is a good indicator of demand,
while still over 100%, has gone from being over
110% for most of last year to under 110% for most
of this year.
The ratio for condos/townhomes spent much of
2015 north of 105%. This year it has been south of
105%.
August Sales Statistics
Sales momentum…
for homes was flat at –8.7. Sales momentum for
condos/townhomes gained 2.7 points to –7.4.
Pricing momentum…
for single-family homes fell 1.5 points to +5.9.
Pricing momentum for condos/lofts fell 0.8 of a
point to +5.4.
Our momentum statistics are based on 12-month
moving averages to eliminate monthly and
seasonal variations.
This is an extraordinarily tough market for buyers.
It's important to be calm and realistic. If you don't
know what to do or where to begin, give me a call
and let's discuss your situation and your options.
Hill & Company
1880 Lombard Street
San, Francisco 94123
Fax: (415) 202-1686
Cell: (415) 819-2663
AnnieWilliamsSF@gmail.com
http://www.anniewilliamshomes.com
DRE #01393923
Annie Williams
Annie Williams | Fax: (415) 202-1686 | AnnieWilliamsSF@gmail.com
San Francisco Prices Up, Sales Down
Local Market Trends September/October 2016San Francisco
Aug 16 Jul 16 Aug 15
Home Sales: 186 196 198
Median Price: 1,257,500$ 1,362,500$ 1,225,444$
Average Price: 1,546,587$ 1,744,082$ 1,505,629$
SP/LP: 108.4% 106.8% 113.6%
Days on Market: 33 32 28
Aug 16 Jul 16 Aug 15
Condo Sales: 242 245 228
Median Price: 1,057,500$ 1,045,000$ 1,047,500$
Average Price: 1,202,026$ 1,204,372$ 1,161,445$
SP/LP: 102.3% 103.3% 107.9%
Days on Market: 47 39 29
(Lofts/Tow nhomes/TIC)
Trends at a Glance
(Single-family Homes)
Homes: detached
YTD Peak % Trough % Peak Trough
3-month 39% 41% 112% Apr-15 Feb-12
12-month 34% 41% 84% Apr-15 Mar-12
Homes: attached
3-month 30% 40% 82% Apr-15 Jan-12
12-month 32% 45% 74% Apr-15 Jan-12
San Francisco Price Differences
from January 2014 & Peak & Trough
-25.0
-20.0
-15.0
-10.0
-5.0
0.0
5.0
10.0
15.0
20.0
25.0
0
6
M M J S N 0
7
M M J S N 0
8
M M J S N 0
9
M M J S N 1
0
M M J S N 1
1
M M J S N 1
2
M M J S N 1
3
M M J S N 1
4
M M J S N 1
5
M M J S N 1
6
M M J
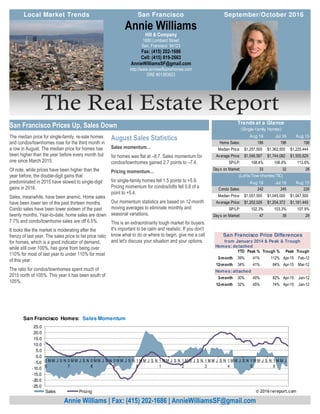
San Francisco Homes: Sales Momentum
Sales Pricing © 2016 rereport.com
2. SOFTER DATA, SOFTER FED STANCE? MAYBE.
September 2, 2016 -- There wasn't a great probability
of the Federal Reserve raising interest rates at its Sep-
tember meeting, but the freshest economic data may
have diminished those odds somewhat.
As we enter the final month of the third quarter, it would
seem that the economic momentum that showed itself
in the first half of the period has tailed off a bit, leaving
behind a less-than-clear outlook as to when short-term
interest rates will again be raised. Despite the Fed's
hopes, the economy continues to plod along, some-
times a bit more quickly, sometimes a bit more slowly
but never seeming to sustain one trend or the other
long enough as to require action in one form or another.
That said, the economy does seem strong enough as to
not be able to completely remove the prospect for a
near-term rate hike, nor weak enough as to completely
rule it out, either. Futures markets now put the chance
of a hike at about one in five, down from about one in
three in recent days.
What does this mean for mortgage rates? Most proba-
bly, a continuation of the very flat summer pattern for a
while longer. Without a quickly moving economy, the
Fed may prefer to wait for a longer accumulation of
modest news before pulling the trigger.
HSH.com's broad-market mortgage tracker -- our
weekly Fixed-Rate Mortgage Indicator (FRMI) -- found
the overall average rate for 30-year fixed-rate mort-
gages increased by two basis points (0.02%), rising to
3.58%. The FRMI's 15-year companion barely moved
as well but rose by one basis point, ticking up to an
average of 2.98%. Popular with first-time homebuyers,
rates on fully-insured FHA-backed 30-year FRMs re-
main a little below their Fannie and Freddie counter-
parts but also featured a small rise, climbing by one
basis point to land at 3.41%. Lastly, the overall 5/1
Hybrid ARM rose a bit more than did the other prod-
ucts, adding four basis points, stopping at 2.93% on
average for the week.
Given all the above, and with more August data still to
come, we're not yet convinced that the Fed will remain
on the sidelines this month. It's a well-established tenet
that the Fed prefers not to make a move on the cusp of
a presidential election, so if not September, they would
need to wait until December. That being the case, how
would markets react if August's modest employment
gains prove temporary, and the Fed sits idly by while
hiring or inflation measures for September, October and
November all come in above expectations? This could
see the Fed need to make a more aggressive move in
raising rates, and that would go against the expecta-
tions for a modest, long-running upward trend for policy
tightening. It's not quite a box the Fed is in, but we may
be at a bit of a pinch point of sorts for them.
2 Local Market Trends | San Francisco |
Mortgage Rate Outlook
The chart above shows the National
monthly average for 30-year fixed rate mort-
gages as compiled by HSH.com. The aver-
age includes mortgages of all sizes, includ-
ing conforming, "expanded conforming,"
and jumbo.
September/October 2016
3.0% 4.0% 5.0% 6.0% 7.0% 8.0%
01-08
07-08
01-09
07-09
01-10
07-10
01-11
07-11
01-12
07-12
01-13
07-13
01-14
07-14
01-15
07-15
01-16
07-16
30-Year Fixed Mortgage Rates
Unit
Median Average Sales DOM SP/LP Median Average Sales Median Average Sales
San Francisco 1,257,500$ 1,546,587$ 186 33 108.4% 2.6% 2.7% -6.1% -7.7% -11.3% -5.1%
D1: Northwest 1,794,000$ 1,993,429$ 14 35 105.1% 9.5% 1.3% 0.0% -21.1% -6.7% 16.7%
D2: Central West 1,250,000$ 1,233,848$ 27 21 119.4% 73.0% 44.3% 575.0% 26.3% 24.6% ######
D3: Southwest 840,000$ 831,938$ 16 32 106.4% 11.3% -15.3% 23.1% -31.0% -28.2% 14.3%
D4: Twin Peaks 1,439,500$ 1,557,279$ 28 26 113.4% -0.1% 5.6% -3.4% 2.5% 2.1% -12.5%
D5: Central 2,175,000$ 2,285,652$ 23 38 104.0% 4.7% 2.1% 15.0% 11.5% 5.4% -14.8%
D6: Central North 2,425,000$ 2,516,667$ 6 51 98.1% -22.4% -14.5% 0.0% 23.6% 28.3% 200.0%
D7: North 3,091,000$ 3,395,857$ 7 55 99.2% -5.6% 3.7% 250.0% -25.0% -48.3% -41.7%
D8: Northeast 9,750,000$ 9,750,000$ 1 21 97.5% 27.5% 28.0% -66.7% n/a n/a n/a
D9: Central East 1,430,000$ 1,434,717$ 23 33 111.5% 10.0% 2.3% -8.0% 2.5% 5.6% 4.5%
D10: Southeast 833,000$ 861,927$ 41 35 109.9% 4.1% 3.7% -16.3% 4.3% -0.1% 7.9%
August Sales Statistics
(Single-family Homes)
Prices Yearly Change Monthly Change
0
50
100
150
200
250
300
350
$300
$500
$700
$900
$1,100
$1,300
$1,500
$1,700
$1,900
0
9
M M J S N 1
0
M M J S N 1
1
M M J S N 1
2
M M J S N 1
3
M M J S N 1
4
M M J S N 1
5
M M J S N 1
6
M M J
San Francisco Homes: Sold Prices & Unit Sales
(3-month moving average — $000's)
Ave Med Units © 2016 rereport.com
3. Table Definitions
_______________
Median Price
The price at which 50% of prices
were higher and 50% were lower.
Average Price
Add all prices and divide by the
number of sales.
SP/LP
Sales price to list price ratio or the
price paid for the property divided
by the asking price.
DOI
Days of Inventory, or how many
days it would take to sell all the
property for sale at the current rate
of sales.
Pend
Property under contract to sell that
hasn’t closed escrow.
Inven
Number pf properties actively for
sale as of the last day of the month.
Local Market Trends | San Francisco | 3September/October 2016
-40.0%
-30.0%
-20.0%
-10.0%
0.0%
10.0%
20.0%
30.0%
40.0%
50.0%
0
9
M M J S N 1
0
M M J S N 1
1
M M J S N 1
2
M M J S N 1
3
M M J S N 1
4
M M J S N 1
5
M M J S N 1
6
M M J
San Francisco Homes: Year-Over-Year Median SalesPrice Change
© 2016 rereport.com
0
10
20
30
40
50
60
70
80
90
0
9
A J O 1
0
A J O 1
1
A J O 1
2
A J O 1
3
A J O 1
4
A J O 1
5
A J O 1
6
A J
San Francisco Homes: Days on Market
© 2016 rereport.com
0
50
100
150
200
250
300
350
$300
$500
$700
$900
$1,100
$1,300
$1,500
0
9
M M J S N 1
0
M M J S N 1
1
M M J S N 1
2
M M J S N 1
3
M M J S N 1
4
M M J S N 1
5
M M J S N 1
6
M M J
San Francisco Condos: Sold Prices & Unit Sales
(3-month moving average — $000's)
Ave Med Units © 2016 rereport.com
Unit
Median Average Sales DOM SP/LP Median Average Sales Median Average Sales
San Francisco 1,057,500$ 1,202,026$ 242 47 102.3% 1.0% 3.5% 6.1% 1.2% -0.2% -1.2%
D1: Northwest 1,147,500$ 1,120,000$ 14 37 106.1% 30.5% 15.0% -12.5% 11.1% 0.7% 0.0%
D2: Central West 990,000$ 990,000$ 2 92 100.0% 107.5% 107.5% 0.0% 0.0% -7.4% -60.0%
D3: Southwest 1,098,236$ 993,052$ 7 48 103.0% 64.8% 19.2% -12.5% 50.4% 39.6% 75.0%
D4: Twin Peaks 680,000$ 680,000$ 1 39 114.3% -6.8% -13.8% -92.3% 2.6% 2.6% -50.0%
D5: Central 1,199,000$ 1,346,354$ 41 35 106.7% -4.1% 9.8% 51.9% 4.3% 12.6% -6.8%
D6: Central North 900,000$ 911,618$ 21 37 102.1% -24.7% -22.6% -4.5% -12.4% -20.6% -44.7%
D7: North 1,475,000$ 1,965,152$ 31 43 100.8% -6.3% 25.8% 93.8% 25.5% 23.8% 40.9%
D8: Northeast 899,000$ 1,034,667$ 39 51 99.6% -26.6% -24.6% 0.0% -18.6% -31.3% 14.7%
D9: Central East 975,000$ 1,072,446$ 81 54 101.4% -11.3% -6.3% 3.8% 2.6% -1.6% 3.8%
D10: Southeast 657,500$ 655,125$ 4 97 98.3% 1.9% 4.2% -33.3% 9.6% 17.0% 33.3%
August Sales Statistics
(Condos/TICs/Co-ops/Lofts)
Prices Yearly Change Monthly Change
4. THE REAL ESTATE REPORT
San Francisco
This Real Estate Report is published and copyrighted by http://rereport.com.
Information contained herein is deemed accurate and correct, but no warranty is implied or given.
Annie Williams
Hill & Company
1880 Lombard Street
San, Francisco 94123
Go online to see the full report with the district by district breakdown: http://rereport.com/sf/aw/
-50.0
-40.0
-30.0
-20.0
-10.0
0.0
10.0
20.0
30.0
40.0
0
6
M M J S N 0
7
M M J S N 0
8
M M J S N 0
9
M M J S N 1
0
M M J S N 1
1
M M J S N 1
2
M M J S N 1
3
M M J S N 1
4
M M J S N 1
5
M M J S N 1
6
M M J
San Francisco Condos/Lofts: SalesMomentum
Sales Pricing © 2016 rereport.com
-30.0%
-20.0%
-10.0%
0.0%
10.0%
20.0%
30.0%
40.0%
0
9
M M J S N 1
0
M M J S N 1
1
M M J S N 1
2
M M J S N 1
3
M M J S N 1
4
M M J S N 1
5
M M J S N 1
6
M M J
San Francisco Condos/Lofts: Year-Over-Year Median Sales Price Change
© 2016 rereport.com