More Related Content
Similar to Annie Williams: Real Estate Market Trends Sep/Oct 2013
Similar to Annie Williams: Real Estate Market Trends Sep/Oct 2013 (14)
Annie Williams: Real Estate Market Trends Sep/Oct 2013
- 1. local market trends
The Real Estate Report
Sඉඖ Fකඉඖඋඑඛඋ
12-month moving average to last year’s, we get a
percentage showing market momentum.
CONDO/LOFT STATISTICS…
The median price for condos was up 12% year-
over-year.
Closed sales were off 11.5%. There
were 285 condos/lofts sold last month.
Year-to-date, sales are down 1%.
The sale price to list price ratio stayed
over 100% for the eighteenth month in
a row: 105.1%.
This is an extraordinarily tough market
for buyers. It’s important to be calm
and realistic. If you don’t know what to
do or where to begin, give me a call
and let’s discuss your situation and
your options.
Jumbo Loans Cheaper Than Conforming Loans
The Mortgage Bankers Assn. reported the average
contract rate for a conforming loan with a 20%
down payment was 4.73% last week, compared
with 4.71% for a similar jumbo loan.
Jumbos are defined as mortgages over $625,500
in much of California.
The difference was more pronounced in the
"hybrid" loans, popular with affluent buyers, that
have a fixed rate for five, seven or 10 years before
becoming adjustable.
Wells Fargo was making 30-year fixed jumbos with
no upfront costs to borrowers at 4.75% on
Thursday, compared with conforming loans at 5%.
For a loan with a rate fixed for the first 10 years,
Wells was writing mortgages at 4.125% for jumbos
compared with 4.875% for conforming loans.
The reason for the difference is that Wells Fargo
has been keeping low-risk jumbo loans on its
books rather than selling them as fodder for
mortgage-backed securities.
Big banks are flooded to the gills with deposits that
are costing them virtually nothing. Wells Fargo, for
example, reported that as of the second quarter
this year it was paying an average of 0.14% a
year interest on its $1 trillion in deposits.
AUGUST MARKET STATISTICS
The median price for single-family, re-sale
homes scored another solid gain in August,
rising 27.5% year-over-year.
Sales of single-family, re-sale homes were off
9.6% year-over-year. There were 217 homes
sold last month. Home sales are up 7.5% year-to-
date.
The sales price to list price ratio has been over
100% for seventeen of the past eighteen months.
SALES MOMENTUM…
for homes fell 1.9 points to +5.6.
PRICING MOMENTUM…
has been on the up-swing the past eighteen
months. It rose 0.9 of a point to +19.4.
WE CALCULATE…
momentum by using a 12-month moving average
to eliminate seasonality. By comparing this year’s
Hill & Company
1880 Lombard Street
San Francisco 94123
Fax: (415) 202-1686
Cell: (415) 819-2663
AnnieWilliamsSF@gmail.com
http://www.anniewilliamshomes.com
DRE #01393923
Annie Williams
Annie Williams | AnnieWilliamsSF@gmail.com | Fax: (415) 202-1686
SEPTEMBER/OCTOBER 2013
Inside This Issue
> LOCAL MARKET TRENDS.....................1
> MORTGAGE RATE OUTLOOK ...............2
> HOME STATISTICS ..............................2
> FORECLOSURE STATS ........................3
> CONDO STATISTICS ............................3
> MOMENTUM CHARTS ..........................4
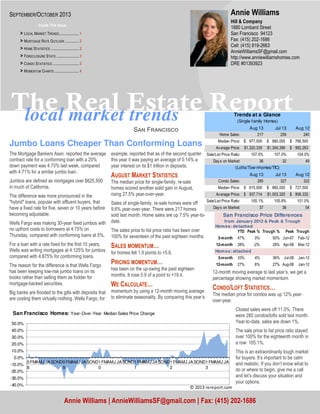
Aug 13 Jul 13 Aug 12
Home Sales: 217 259 240
Median Price: 977,000$ 890,000$ 766,500$
Average Price: 1,320,335$ 1,304,399$ 992,263$
Sale/List Price Ratio: 107.5% 107.0% 104.0%
Days on Market: 36 32 49
Aug 13 Jul 13 Aug 12
Condo Sales: 285 327 322
Median Price: 815,000$ 860,000$ 727,500$
Average Price: 937,714$ 1,003,320$ 806,332$
Sale/List Price Ratio: 105.1% 105.8% 101.0%
Days on Market: 37 36 54
(Lofts/Tow nhomes/TIC)
Trends at a Glance
(Single-family Homes)
Homes: detached
YTD Peak % Trough % Peak Trough
3-month 47% 0% 50% Jun-07 Feb-12
12-month 28% -2% 28% Apr-08 Mar-12
Homes: attached
3-month 33% 4% 36% Jul-08 Jan-12
12-month 27% 6% 27% Aug-08 Jan-12
San Francisco Price Differences
from January 2012 & Peak & Trough
-40.0%
-30.0%
-20.0%
-10.0%
0.0%
10.0%
20.0%
30.0%
40.0%
50.0%
0
8
FMAMJ JASOND0
9
FMAMJ JASOND1
0
FMAMJ JASOND1
1
FMAMJ JASOND1
2
FMAMJ JASOND1
3
FMAMJ JA
San Francisco Homes: Year-Over-Year Median Sales Price Change
© 2013 rereport.com
- 2. Page 2
The Real Estate Report
The chart above shows the
National monthly average for
30-year fixed rate mortgages
as compiled by HSH.com. The
average includes mortgages of
all sizes, including conforming,
"expanded conforming," and
jumbo.
MORTGAGE RATE OUTLOOK
Sep 6, 2013 -- Just when you think there is sufficient
clarity as to where we're going economically, and that
you've got a firm grip on how the Fed is likely to act,
along comes a piece of data or two which derails
both of those trains of thought.
In a week where all the data suddenly seemed to
strong or stronger relative to recent trends, investors
continued to shift money out of bonds, driving yields
and mortgage rates higher. At one point, the yield on
the influential 10-year US Treasury topped the 3
percent mark, a more than two-year high, and nearly
double yields of a year ago this week.
And then, with a thud, came the August employment
report.
HSH.com's broad-market mortgage tracker -- our
weekly Fixed-Rate Mortgage Indicator (FRMI) --
found that the overall average rate for 30-year fixed-
rate mortgages returned to multi-year highs, rising by
the same seven basis points (0.07%) it declined last
week to again hit 4.75%. The FRMI's 15-year
companion added six basis points (0.06%), climbing
to 3.82%, the highest such figure since July 2011.
Popular FHA-backed 30-year FRMs climbed a full ten
basis points, returning to 4.36%, while the overall 5/1
Hybrid ARM moved by a four hundredths of a
percentage point to a relative bargain of 3.45% for
the week.
One feature of the soft employment report is that it
cut the legs out of the rise in mortgage rates, at least
for now, as daily rates eased back on Friday. That
said, we harbor no illusions that mortgage rates are
poised to decline greatly, but they should steady a bit
as we move into next week. The most significant new
data come out later in the week, with measures of
prices, retail sales and consumer moods all due.
Rates will probably be steady to slightly higher again
next week, but the climb may be slow and the move
small.
One other note: The Mortgage Bankers Association
reported that, according to their data, jumbo fixed
rates are averaging below conforming. There are
several reasons why this may be showing in their
survey, including a change in the mix of borrowers for
conforming loans and the inclusion of lower-than-
private-cost "agency jumbo" prices in their jumbo
averages, among other items. Media members are
encouraged to give a call or drop a line if they would
like to know more.
0
50
100
150
200
250
300
350
$300
$500
$700
$900
$1,100
$1,300
$1,500
0
8
FMAMJ JASOND0
9
FMAMJ JASOND1
0
FMAMJ JASOND1
1
FMAMJ JASOND1
2
FMAMJ JASOND1
3
FMAMJ JA
San Francisco Homes: Sold Prices & Unit Sales
(3-month moving average — $000's)
Ave Med Units © 2013 rereport.com
Unit
Median Average Sales DOM SP/LP Median Average Sales Median Average Sales
San Francisco 977,000$ 1,320,335$ 217 36 107.5% 27.5% 33.1% -9.6% 9.8% 1.2% -16.2%
D1: Northwest 1,275,000$ 1,482,380$ 19 27 112.7% 18.6% 6.3% 11.8% -1.9% 3.1% -17.4%
D2: Central West 856,000$ 932,305$ 39 33 112.1% 14.4% 17.7% 5.4% -1.9% 3.1% -35.0%
D3: Southwest 650,000$ 627,684$ 19 45 108.1% 25.5% 8.7% 0.0% -8.5% -16.8% 0.0%
D4: Twin Peaks 1,130,000$ 1,264,359$ 22 45 105.2% 3.2% 7.6% -15.4% 8.7% 10.6% -29.0%
D5: Central 1,590,000$ 1,891,605$ 38 24 112.8% 12.4% 8.5% 11.8% -3.9% 5.3% 18.8%
D6: Central North 2,250,000$ 2,250,000$ 2 26 105.1% 61.3% 62.7% -33.3% 26.3% 42.9% -60.0%
D7: North 4,150,000$ 4,273,770$ 10 46 97.4% -3.7% 1.0% 150.0% -16.5% -31.5% -23.1%
D8: Northeast 2,500,000$ 3,181,250$ 4 98 96.9% 165.7% 238.1% 300.0% 19.0% 71.7% 33.3%
D9: Central East 940,000$ 1,080,440$ 25 36 110.0% 19.7% 35.9% -16.7% 1.6% 6.5% 19.0%
D10: Southeast 590,000$ 599,767$ 39 38 106.1% 14.3% 18.0% -31.6% -4.2% 0.0% -29.1%
August Sales Statistics
(Single-family Homes)
Prices Yearly Change Monthly Change
3.0% 4.0% 5.0% 6.0% 7.0% 8.0%
01-06
04-06
07-06
10-06
01-07
04-07
07-07
10-07
01-08
04-08
07-08
10-08
01-09
04-09
07-09
10-09
01-10
04-10
07-10
10-10
01-11
04-11
07-11
10-11
01-12
04-12
07-12
10-12
01-13
04-13
07-13
30-Year Fixed Mortgage Rates
- 3. Table Definitions
_______________
Median Price
The price at which 50% of
prices were higher and
50%were lower.
Average Price
Add all prices and divide by the
number of sales.
SP/LP
Sales price to list price ratio or
the price paid for the property
divided by the asking price.
DOI
Days of Inventory, or how many
days it would take to sell all the
property for sale at the current
rate of sales.
Pend
Property under contract to sell
that hasn’t closed escrow.
Inven
Number of properties actively
for sale as of the last day of the
month.
Notices of default, the first step in the foreclosure
process, in San Francisco fell 7.9% in July from June.
Year-over-year, notices were down 73.1%.
Notices of sale, which set the date and time of an
auction, and serve as the homeowner's final notice
before sale, dropped 22.2% from June, and were down
67.9% year-over-year.
After the filing of a Notice of Trustee Sale, there are
only three possible outcomes. First, the sale can be
cancelled for reasons that include a successful loan
modification or short sale, a filing error, or a legal
requirement to re-file the notice after extended
postponements.
Alternatively, if the property is taken to sale, the bank
will place the opening bid. If a third party, typically an
FORECLOSURE STATISTICS
investor, bids more than the bank's opening bid, the
property will be sold to the third party; if not, it will go
back to the bank.
There were 44 sales cancelled last month.
Only six homes went back to the bank in July. There
were four in June.
There are currently 184 properties scheduled for sale.
With the recent surge in prices, many of them will
probably be cancelled.
The total number of properties owned by the banks was
down 44.5% year-over-year. The banks now own
approximately 292 properties in the city.
For further details and a city-by-city breakdown of
foreclosure statistics, go to http://foreclosureradar.com.
0
50
100
150
200
250
300
350
$300
$400
$500
$600
$700
$800
$900
$1,000
$1,100
0
8
FMAMJ JASOND0
9
FMAMJ JASOND1
0
FMAMJ JASOND1
1
FMAMJ JASOND1
2
FMAMJ JASOND1
3
FMAMJ JA
San Francisco Condos: Sold Prices & Unit Sales
(3-month moving average — $000's)
Ave Med Units © 2013 rereport.com
-30.0%
-20.0%
-10.0%
0.0%
10.0%
20.0%
30.0%
40.0%
0
8
FMAMJ JASOND0
9
FMAMJ JASOND1
0
FMAMJ JASOND1
1
FMAMJ JASOND1
2
FMAMJ JASOND1
3
FMAMJ JA
San Francisco Condos/Lofts: Year-Over-Year Median Sales Price Change
© 2013 rereport.com
Unit
Median Average Sales DOM SP/LP Median Average Sales Median Average Sales
San Francisco 815,000$ 937,714$ 285 37 105.1% 12.0% 16.3% -11.5% -5.2% -6.5% -12.8%
D1: Northwest 975,000$ 1,002,667$ 18 36 106.7% 25.4% 28.1% 50.0% 7.7% 8.3% 38.5%
D2: Central West 827,000$ 754,400$ 5 20 107.6% 11.8% 4.3% 66.7% 1.1% 3.4% 66.7%
D3: Southwest 500,000$ 500,000$ 1 48 125.6% 58.5% 57.9% -83.3% 9.6% 5.4% -80.0%
D4: Twin Peaks 504,000$ 516,717$ 6 34 114.5% 9.7% -2.0% 50.0% -24.2% -24.7% 0.0%
D5: Central 860,000$ 951,034$ 35 35 110.9% 0.6% 4.6% -10.3% -20.0% -10.9% -30.0%
D6: Central North 738,500$ 855,650$ 30 34 107.4% -8.0% 8.7% -11.8% -10.0% -2.7% 7.1%
D7: North 1,160,000$ 1,133,978$ 29 25 106.5% 44.1% 24.3% 11.5% -3.1% -16.4% -34.1%
D8: Northeast 812,500$ 1,050,604$ 50 46 101.2% 30.0% 31.6% -28.6% 7.9% -4.3% -12.3%
D9: Central East 755,250$ 897,916$ 107 36 103.7% 4.9% 4.1% 12.6% -8.9% -1.1% -7.8%
D10: Southeast 335,000$ 335,000$ 3 156 96.9% 12.0% 14.4% -62.5% 3.1% -8.7% -40.0%
August Sales Statistics
(Condos/TICs/Co-ops/Lofts)
Prices Yearly Change Monthly Change
- 4. The Real Estate Market Trends Report is published and copyrighted by http://rereport.com.
THE REAL ESTATE REPORT
San Francisco
Annie Williams
Hill & Company
1880 Lombard Street
San Francisco 94123
Go online to see the full report
with the district by district breakdown:
HTTP://WWW.ANNIEWILLIAMSHOMES.COM
-25.0
-20.0
-15.0
-10.0
-5.0
0.0
5.0
10.0
15.0
20.0
25.0
0
8
FMAMJ JASOND0
9
FMAMJ JASOND1
0
FMAMJ JASOND1
1
FMAMJ JASOND1
2
FMAMJ JASOND1
3
FMAMJ JA
San Francisco Homes: Sales Momentum
Sales Pricing © 2013 rereport.com
-50.0
-40.0
-30.0
-20.0
-10.0
0.0
10.0
20.0
30.0
40.0
0
8
FMAMJ JASOND0
9
FMAMJ JASOND1
0
FMAMJ JASOND1
1
FMAMJ JASOND1
2
FMAMJ JASOND1
3
FMAMJ JA
San Francisco Condos/Lofts: Sales Momentum
Sales Pricing © 2013 rereport.com