Market Takes a Breather - Real Estate Report September/October
•
0 likes•296 views

The Real Estate Report September/October, local market trends San Francisco: "Market Takes a Breather" by AMSI's Real Estate Broker Robb Fleischer

Recommended
Recommended
More Related Content
What's hot
What's hot (20)
Viewers also liked
Viewers also liked (10)
Similar to Market Takes a Breather - Real Estate Report September/October
Similar to Market Takes a Breather - Real Estate Report September/October (16)
Recently uploaded
Recently uploaded (20)
Market Takes a Breather - Real Estate Report September/October
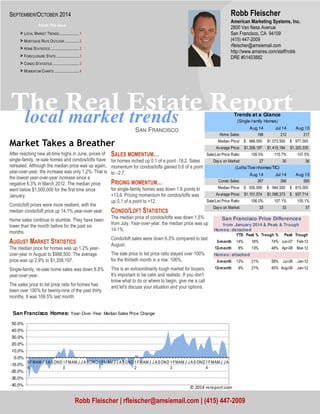
- 1. Robb Fleischer The Real Estate Report local market trends SAN FRANCISCO Market Takes a Breather After reaching new all-time highs in June, prices of single-family, re-sale homes and condos/lofts have retreated. Although the median price was up again, year-over-year, the increase was only 1.2%. That is the lowest year-over-year increase since a negative 6.3% in March 2012. The median price went below $1,000,000 for the first time since January. Condo/loft prices were more resilient, with the median condo/loft price up 14.1% year-over-year. Home sales continue to stumble. They have been lower than the month before for the past six months. AUGUST MARKET STATISTICS The median price for homes was up 1.2% year-over- year in August to $988,500. The average price was up 2.9% to $1,358,197. Single-family, re-sale home sales was down 8.8% year-over-year. The sales price to list price ratio for homes has been over 100% for twenty-nine of the past thirty months. It was 109.5% last month. SALES MOMENTUM… for homes inched up 0.1 of a point -18.2. Sales momentum for condos/lofts gained 0.6 of a point to –2.7. PRICING MOMENTUM… for single-family homes was down 1.6 points to +13.6. Pricing momentum for condos/lofts was up 0.1 of a point to +12. CONDO/LOFT STATISTICS The median price of condos/lofts was down 1.5% from July. Year-over-year, the median price was up 14.1%. Condo/loft sales were down 6.3% compared to last August. The sale price to list price ratio stayed over 100% for the thirtieth month in a row: 106%. This is an extraordinarily tough market for buyers. It's important to be calm and realistic. If you don't know what to do or where to begin, give me a call and let's discuss your situation and your options. American Marketing Systems, Inc. 2800 Van Ness Avenue San Francisco, CA 94109 (415) 447-2009 rfleischer@amsiemail.com http://www.amsires.com/staff/robb DRE #01403882 Trends at a Glance (Single-family Homes) (Lof ts/Tow nhomes/TIC) San Francisco Price Differences from January 2014 & Peak & Trough Robb Fleischer | rfleischer@amsiemail.com | (415) 447-2009 SEPTEMBER/OCTOBER 2014 Inside This Issue > LOCAL MARKET TRENDS ..................... 1 > MORTGAGE RATE OUTLOOK ............... 2 > HOME STATISTICS .............................. 2 > FORECLOSURE STATS ........................ 3 > CONDO STATISTICS ............................ 3 > MOMENTUM CHARTS .......................... 4 Aug 14 Jul 14 Aug 13 Home Sales: 198 212 217 Median Price: $ 9 88,500 $1 ,073,500 $ 977,000 Av erage Price: $1 ,358,197 $1 ,415,184 $1 ,320,335 Sale/List Price Ratio: 109.5% 110.7% 107.5% Day s on Market: 27 30 36 Aug 14 Jul 14 Aug 13 Condo Sales: 267 266 285 Median Price: $ 9 30,000 $ 9 44,500 $ 8 15,000 Av erage Price: $1 ,101,574 $1 ,098,373 $ 937,714 Sale/List Price Ratio: 106.0% 107.1% 105.1% Day s on Market: 33 33 37 Homes: detached YTD Peak % Trough % Peak Trough 3-month 14% 16% 74% Jun-07 Feb-12 12-month 8% 13% 48% Apr-08 Mar-12 Homes: attached 3-month 13% 21% 58% Jul-08 Jan-12 12-month 9% 21% 45% Aug-08 Jan-12 50.0% 40.0% 30.0% 20.0% 10.0% 0.0% -10.0% -20.0% -30.0% -40.0% 0 9 FMAM J J ASOND 1 0 FMAM J J ASOND 1 1 FMAM J J A SOND 1 2 FMAM J J A SOND 1 3 FMAM J J ASOND 1 4 FMAM J J A San Francisco Homes: Year-Over-Year Median Sales Price Change
- 2. 30-Year Fixed Mortgage Rates 07-14 04-14 01-14 10-13 07-13 04-13 01-13 10-12 07-12 04-12 01-12 10-11 07-11 04-11 01-11 10-10 07-10 04-10 01-10 10-09 07-09 04-09 01-09 10-08 07-08 04-08 01-08 10-07 07-07 04-07 3.0% 4.0% 5.0% 6.0% 7.0% 8.0% Page 2 The Real Estate Report The chart above shows the Na-tional monthly average for 30- year fixed rate mortgages as compiled by HSH.com. The av-erage includes mortgages of all sizes, including conforming, expanded conforming, and jumbo. MORTGAGE RATE OUTLOOK Despite Solid Data, Rates Remain Tethered September 5, 2014 -- Over the last couple of months, available economic signals from the U.S. continue to flash much more green than yellow. The economic storm in the first quarter of 2014 which produced a decline in GDP growth in the first quarter of the year continues to get smaller and smaller in the rearview mirror, and the road ahead increasingly appears dry and clear. For most of the world (and of course the U.S.) this is good news, as American consumers are again needed to help lift the world out of a set of difficult straits. Faltering economies in the Eurozone and prospects for outright deflation led the European Central Bank this week to further trim the interest rates they control, and even charge banks more for parking funds with the financial authority. These changes are hoped to help incent more lending and promote both growth and firmer prices in the econo-mies which share the Euro as a currency. However, the ECB stopped short of implementing any direct QE-style programs, but at least they are tweaking things around the edges to try to stimulate growth. Weak growth and low yielding domestic investments have led investors to the U.S., where our bonds offer better returns and prospects for making money in equities may be better. This additional inbound de-mand for our bonds continues to serve mortgage borrowers well, as without it, the growing economy would surely be producing higher interest rates by now. HSH.com's broad-market mortgage tracker -- our weekly Fixed-Rate Mortgage Indicator (FRMI)-- found that the overall average rate for 30-year fixed-rate mortgages held fast this week, remaining at an aver-age rate of 4.17 percent, a 2014 low. The FRMI's 15- year companion followed suit, holding an average rate of 3.43 percent for a fourth consecutive week; this is also a level achieved in six of the last eight weeks. Fully-insured FHA-backed 30-year FRMs also remained in stasis, as these lowest-priced fixed rate mortgages clung to an average rate of 3.91 percent yet again. In fact, the only wobble in rates of the most popular mortgage products was seen in the overall 5/1 Hybrid ARM, and this most-favored adjustable rate mortgage managed all of a single basis point move (.01%) to tick to 3.12 percent. All told, up and down the yield curve, mortgage rates continue to show remarkable stability. 350 300 250 200 150 100 50 0 $1,700 $1,500 $1,300 $1,100 $900 $700 $500 $300 0 9 FMAMJ J ASOND 1 0 FMAMJ J ASOND 1 1 FMAMJ J ASOND 1 2 FMAMJ J ASOND 1 3 FMAMJ J ASOND 1 4 FMAMJ J A San Francisco Homes: Sold Prices Unit Sales (3-month moving average —$000's) Ave Med Units
- 3. August Sales Statistics Unit (Single-family Homes) Prices Yearly Change Monthly Change Median Average Sales DOM SP/LP Median Average Sales Median Average Sales San Francisco $ 9 88,500 $1 ,358,197 198 27 109.5% 1.2% 2.9% -8.8% -7.9% -4.0% -6.6% D1: Northwest $ 1,380,000 $1 ,761,882 17 25 108.2% 8.2% 18.9% -10.5% -5.6% 3.8% -10.5% D2: Central West $ 9 21,500 $1 ,022,210 42 26 113.6% 7.7% 9.6% 7.7% -13.1% -11.0% 0.0% D3: Southwest $ 780,000 $ 8 45,456 18 30 110.7% 20.0% 34.7% -5.3% 10.6% 10.1% -5.3% D4: Twin Peaks $1 ,260,000 $1 ,299,435 23 21 110.2% 11.5% 2.8% 4.5% 13.0% -1.1% 9.5% D5: Central $ 1,875,000 $2 ,030,500 23 26 112.8% 17.9% 7.3% -39.5% -0.8% 8.9% -17.9% D6: Central North $ 2,662,500 $2 ,662,500 2 15 114.7% 18.3% 18.3% 0.0% 8.6% 9.7% -50.0% D7: North $ 3,575,000 $3 ,745,000 10 19 101.1% -13.9% -12.4% 0.0% -14.9% -30.3% 11.1% D8: Northeast $2 ,462,500 $2 ,845,972 4 27 101.8% -1.5% -10.5% 0.0% 72.8% 99.7% 300.0% D9: Central East $1 ,097,000 $1 ,084,421 19 30 110.8% 16.7% 0.4% -24.0% -15.6% -21.1% -24.0% D10: Southeast $ 7 20,000 $ 7 36,731 39 31 112.1% 22.0% 22.8% 0.0% 1.6% 3.7% -11.4% 01-07
- 4. Table Definitions _______________ Median Price The price at which 50% of prices were higher and 50%were lower. Average Price Add all prices and divide by the number of sales. SP/LP Sales price to list price ratio or the price paid for the property divided by the asking price. DOI Days of Inventory, or how many days it would take to sell all the property for sale at the current rate of sales. Pend Property under contract to sell that hasn’t closed escrow. Inven Number of properties actively for sale as of the last day of the month. 40.0% 30.0% 20.0% 10.0% 0.0% -10.0% -20.0% FORECLOSURE STATISTICS Notices of default, the first step in the foreclosure proc-ess, in San Francisco continues to drop. They plum-meted 36.6% in July from June. Year-over-year, notices were down 40.9%. There were 26 notices in June. Notices of sale, which set the date and time of an auc-tion, and serve as the homeowner's final notice before sale, fell 38.9% from June, and they were down 58.5% year-over-year. There were 22. After the filing of a Notice of Trustee Sale, there are only three possible outcomes. First, the sale can be cancelled for reasons that include a successful loan modification or short sale, a filing error, or a legal re-quirement to re-file the notice after extended postpone-ments. Alternatively, if the property is taken to sale, the bank will place the opening bid. If a third party, typically an investor, bids more than the bank's opening bid, the property will be sold to the third party; if not, it will go back to the bank. There were 30 sales cancelled last month. Seven homes went back to the bank in July. There are currently 102 properties scheduled for sale. With the recent surge in prices, many of them will probably be cancelled. The total number of properties owned by the banks was down 14% year-over-year. The banks now own ap-proximately 240 properties in the city. 350 300 250 200 150 100 50 0 $1,300 $1,100 $900 $700 $500 $300 0 9 FMAM J J ASOND 1 0 FMAMJ J ASOND 1 1 FMAMJ J ASOND 1 2 FMAMJ J ASOND 1 3 FMAMJ J ASOND 1 4 FMAMJ J A San Francisco Condos: Sold Prices Unit Sales (3-month moving average —$000's) Ave Med Units
- 5. -30.0% 0 9 FMAM J J ASOND 1 0 FMAM J J ASOND 1 1 FMAM J J A SOND 1 2 FMAM J J A SOND 1 3 FMAM J J ASOND 1 4 FMAM J J A San Francisco Condos/Lofts: Year-Over-Year Median Sales Price Change © 2014 rereport.com August Sales Statistics (Condos/TICs/Co-ops/Lof ts) Unit Prices Yearly Change Monthly Change Median Average Sales DOM SP/LP Median Average Sales Median Average Sales San Francisco $ 9 30,000 $1 ,101,574 267 33 106.0% 14.1% 17.5% -6.3% -1.5% 0.3% 0.4% D1: Northwest $ 850,000 $ 8 98,250 14 33 113.5% -12.8% -10.4% -22.2% -16.5% -10.4% 0.0% D2: Central West $ 8 00,000 $ 7 17,000 3 26 112.8% -3.3% -5.0% -40.0% -9.1% -18.2% -57.1% D3: Southwest $ 420,000 $ 4 20,000 1 10 102.4% -16.0% -16.0% 0.0% -12.7% -12.7% 0.0% D4: Twin Peaks $ 3 63,000 $ 4 24,730 5 57 107.2% -28.0% -17.8% -16.7% -68.7% -63.6% 66.7% D5: Central $ 1,159,992 $1 ,180,309 34 36 112.5% 34.9% 24.1% -2.9% -3.3% -1.0% -5.6% D6: Central North $ 1,000,000 $ 935,524 21 22 109.7% 35.4% 9.3% -30.0% 30.7% 16.8% -25.0% D7: North $ 1,450,000 $1 ,582,527 37 31 105.7% 25.0% 39.6% 27.6% 10.9% 2.6% 76.2% D8: Northeast $ 827,500 $ 9 83,781 32 35 105.2% 1.8% -6.4% -36.0% -17.3% -23.7% -34.7% D9: Central East $ 8 80,000 $1 ,093,365 113 34 103.2% 16.5% 21.8% 5.6% -0.6% 7.8% 9.7% D10: Southeast $ 5 08,000 $ 5 07,400 5 54 100.0% 51.6% 51.5% 66.7% -10.9% -24.6% 66.7%
- 6. THE REAL ESTATE REPORT San Francisco Robb Fleischer American Marketing Systems, Inc. 2800 Van Ness Avenue San Francisco, CA 94109 Go online to see the full report with the district by district breakdown: HTTP://WWW.AMSIRES.COM/STAFF/ROBB The Real Estate Market Trends Report is published and copyrighted by http://rereport.com. 25.0 20.0 15.0 10.0 5.0 0.0 -5.0 -10.0 -15.0 -20.0 -25.0 0 8 FMAMJ JASOND0 9 FMAMJ JASOND1 0 FMAMJ JASOND1 1 FMAMJ JASOND1 2 FMAMJ JASOND1 3 FMAMJ JASOND1 4 FMAMJ JA San Francisco Homes: Sales Momentum Sales Pricing © 2014 rereport.com 40.0 30.0 20.0 10.0 0.0 -10.0 -20.0 -30.0 -40.0 -50.0 0 8 FMAMJ JASOND0 9 FMAMJ JASOND1 0 FMAMJ JASOND1 1 FMAMJ JASOND1 2 FMAMJ JASOND1 3 FMAMJ JASOND1 4 FMAMJ JA San Francisco Condos/Lofts: Sales Momentum Sales Pricing © 2014 rereport.com