More Related Content
Similar to Annie Williams Market Trends July-Aug 2014
Similar to Annie Williams Market Trends July-Aug 2014 (15)
Annie Williams Market Trends July-Aug 2014
- 1. local market trends
The Real Estate Report
SAN FRANCISCO
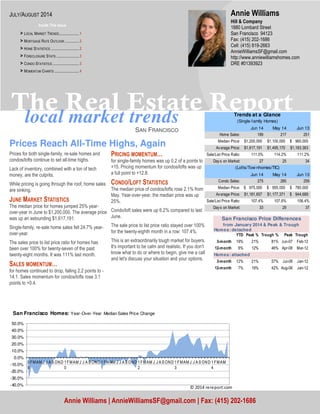
Prices Reach All-Time Highs, Again
Prices for both single-family, re-sale homes and
condos/lofts continue to set all-time highs.
Lack of inventory, combined with a ton of tech
money, are the culprits.
While pricing is going through the roof, home sales
are sinking.
JUNE MARKET STATISTICS
The median price for homes jumped 25% year-
over-year in June to $1,200,000. The average price
was up an astounding $1,617,191.
Single-family, re-sale home sales fell 24.7% year-
over-year.
The sales price to list price ratio for homes has
been over 100% for twenty-seven of the past
twenty-eight months. It was 111% last month.
SALES MOMENTUM…
for homes continued to drop, falling 2.2 points to -
14.1. Sales momentum for condos/lofts rose 3.1
points to +0.4.
PRICING MOMENTUM…
for single-family homes was up 0.2 of a points to
+15. Pricing momentum for condos/lofts was up
a full point to +12.8.
CONDO/LOFT STATISTICS
The median price of condos/lofts rose 2.1% from
May. Year-over-year, the median price was up
25%.
Condo/loft sales were up 6.2% compared to last
June.
The sale price to list price ratio stayed over 100%
for the twenty-eighth month in a row: 107.4%.
This is an extraordinarily tough market for buyers.
It's important to be calm and realistic. If you don't
know what to do or where to begin, give me a call
and let's discuss your situation and your options.
Hill & Company
1880 Lombard Street
San Francisco 94123
Fax: (415) 202-1686
Cell: (415) 819-2663
AnnieWilliamsSF@gmail.com
http://www.anniewilliamshomes.com
DRE #01393923
Annie Williams
Annie Williams | AnnieWilliamsSF@gmail.com | Fax: (415) 202-1686
JULY/AUGUST 2014
Inside This Issue
> LOCAL MARKET TRENDS.....................1
> MORTGAGE RATE OUTLOOK ...............2
> HOME STATISTICS ..............................2
> FORECLOSURE STATS ........................3
> CONDO STATISTICS ............................3
> MOMENTUM CHARTS ..........................4
Jun 14 May 14 Jun 13
Home Sales: 189 217 251
Median Price: 1,200,000$ 1,100,000$ 960,000$
Average Price: 1,617,191$ 1,495,170$ 1,183,363$
Sale/List Price Ratio: 111.0% 114.2% 111.2%
Days on Market: 27 25 34
Jun 14 May 14 Jun 13
Condo Sales: 275 285 259
Median Price: 975,000$ 955,000$ 780,000$
Average Price: 1,181,657$ 1,177,371$ 944,689$
Sale/List Price Ratio: 107.4% 107.6% 106.4%
Days on Market: 33 29 37
(Lofts/Tow nhomes/TIC)
Trends at a Glance
(Single-family Homes)
Homes: detached
YTD Peak % Trough % Peak Trough
3-month 19% 21% 81% Jun-07 Feb-12
12-month 6% 12% 46% Apr-08 Mar-12
Homes: attached
3-month 12% 21% 57% Jul-08 Jan-12
12-month 7% 19% 42% Aug-08 Jan-12
San Francisco Price Differences
from January 2014 & Peak & Trough
-40.0%
-30.0%
-20.0%
-10.0%
0.0%
10.0%
20.0%
30.0%
40.0%
50.0%
0
9
FMAM J J AS OND 1
0
FMAM J J A S OND 1
1
FMAM J J A S OND 1
2
FMAM J J A S OND 1
3
FMAM J J A S OND 1
4
FMAM
San Francisco Homes: Year-Over-Year Median Sales Price Change
© 2014 rereport.com
- 2. Page 2
The Real Estate Report
The chart above shows the Na-
tional monthly average for 30-
year fixed rate mortgages as
compiled by HSH.com. The av-
erage includes mortgages of all
sizes, including conforming,
"expanded conforming," and
jumbo.
MORTGAGE RATE OUTLOOK
July 3, 2014 -- As it has for much of the spring, the
economy seems to be maintaining an upward path.
Coupled with a forgiving Federal Reserve slowing
removing policy accommodation, this has resulted in
record highs for major stock market indices, while the
global investor search for yield and to keep funds out
of harm's way has helped U.S. interest rates to re-
main low.
We find ourselves in a very interesting position as the
recovery seems to finally be coming into its own.
With only about $35 billion left to trim, the Federal
Reserve will complete its exit from QE in just three
more meetings, with an expected late October clo-
sure of the program. After that, Fed officials and offi-
cial forecasts suggest it may be six months before
the Fed begins to adapt interest rate policies to the
new economic reality.
If present growth trends persist between now and the
end of the program we will probably get something
shorter than a six-month period in which to prepare,
especially if inflation tracks upward during this time.
Even if the Fed chooses to do nothing during this
window, markets will certainly have made adjust-
ments in preparation, lifting rates, and the Fed will
probably be acting reactively at that point rather than
proactively.
For now, and likely through the summer, we may see
data-driven bumps and dips in rates. Although we
managed a slight dip presently, a bump is in order
before long.
HSH.com's broad-market mortgage tracker -- our
weekly Fixed-Rate Mortgage Indicator (FRMI) --
found that the overall average rate for 30-year fixed-
rate mortgages decreased by two basis points
(0.02%), easing back to 4.19% and very close to
2014 lows. Meanwhile, the FRMI's 15-year compan-
ion slid by just one basis point to drift to 3.42%.
Popular FHA-backed 30-year FRMs backed off by
four basis points, drifting down to 3.91%, as these
fully-insured offerings continue to beat conforming
30-year FRMs by almost a quarter percentage point.
Finally, the overall 5/1 Hybrid ARM declined by an-
other three basis points, landing at 3.06% for the first
week of the third quarter.
0
50
100
150
200
250
300
350
$300
$500
$700
$900
$1,100
$1,300
$1,500
$1,700
0
9
FMAM J J ASOND 1
0
FMAM J J ASOND 1
1
FMAM J J ASOND 1
2
FMAM J J ASOND 1
3
FMAM J J ASOND 1
4
FMAM J
San Francisco Homes: Sold Prices & Unit Sales
(3-month moving average — $000's)
Ave Med Units © 2014 rereport.com
Unit
Median Average Sales DOM SP/LP Median Average Sales Median Average Sales
San Francisco 1,200,000$ 1,617,191$ 189 27 111.0% 25.0% 36.7% -24.7% 9.1% 8.2% -12.9%
D1: Northwest 1,625,000$ 1,641,706$ 17 19 114.2% 22.2% 13.9% -26.1% 4.8% 0.8% -5.6%
D2: Central West 980,000$ 1,147,602$ 31 23 115.8% 19.1% 30.9% -29.5% 0.1% 1.7% -20.5%
D3: Southwest 1,109,000$ 1,029,300$ 10 26 115.0% 35.7% 20.3% -37.5% 55.6% 23.8% -44.4%
D4: Twin Peaks 1,400,000$ 1,500,310$ 29 32 113.6% 22.2% 24.6% -12.1% -1.4% 4.1% 7.4%
D5: Central 2,325,000$ 2,286,321$ 28 18 112.0% 52.0% 40.2% -36.4% 31.0% 14.9% -3.4%
D6: Central North 2,912,500$ 2,583,750$ 4 30 110.6% 2.9% -8.7% 100.0% 7.9% -4.4% 33.3%
D7: North 3,840,000$ 4,099,714$ 14 23 104.4% 30.2% 14.2% 75.0% 3.8% -8.7% 16.7%
D8: Northeast 2,757,000$ 4,292,083$ 3 76 97.6% 31.3% 131.6% 0.0% -61.4% -40.0% 50.0%
D9: Central East 1,105,000$ 1,155,600$ 10 11 119.3% -3.5% 0.4% -54.5% -21.4% -18.9% -44.4%
D10: Southeast 710,000$ 748,421$ 43 36 112.7% 12.6% 20.3% -23.2% 3.4% 1.8% -14.0%
June Sales Statistics
(Single-family Homes)
Prices Yearly Change Monthly Change
3.0% 4.0% 5.0% 6.0% 7.0% 8.0%
01-06
04-06
07-06
10-06
01-07
04-07
07-07
10-07
01-08
04-08
07-08
10-08
01-09
04-09
07-09
10-09
01-10
04-10
07-10
10-10
01-11
04-11
07-11
10-11
01-12
04-12
07-12
10-12
01-13
04-13
07-13
10-13
01-14
04-14
30-Year Fixed Mortgage Rates
- 3. Table Definitions
_______________
Median Price
The price at which 50% of
prices were higher and
50%were lower.
Average Price
Add all prices and divide by the
number of sales.
SP/LP
Sales price to list price ratio or
the price paid for the property
divided by the asking price.
DOI
Days of Inventory, or how many
days it would take to sell all the
property for sale at the current
rate of sales.
Pend
Property under contract to sell
that hasn’t closed escrow.
Inven
Number of properties actively
for sale as of the last day of the
month.
Notices of default, the first step in the foreclosure proc-
ess, in San Francisco continues to drop. They plum-
meted 72.7% in May from April. Year-over-year, notices
were down 71.2%. There were 15 notices in May.
Notices of sale, which set the date and time of an auc-
tion, and serve as the homeowner's final notice before
sale, dropped 69.6.1% from April, and they were down
88.5% year-over-year. There were 7.
After the filing of a Notice of Trustee Sale, there are
only three possible outcomes. First, the sale can be
cancelled for reasons that include a successful loan
modification or short sale, a filing error, or a legal re-
quirement to re-file the notice after extended postpone-
ments.
FORECLOSURE STATISTICS
Alternatively, if the property is taken to sale, the bank
will place the opening bid. If a third party, typically an
investor, bids more than the bank's opening bid, the
property will be sold to the third party; if not, it will go
back to the bank.
There were 24 sales cancelled last month.
Only two homes went back to the bank in May.
There are currently 114 properties scheduled for sale.
With the recent surge in prices, many of them will
probably be cancelled.
The total number of properties owned by the banks was
down 27.1% year-over-year. The banks now own ap-
proximately 226 properties in the city.
0
50
100
150
200
250
300
350
$300
$500
$700
$900
$1,100
$1,300
0
9
FMAM J J ASOND 1
0
FMAM J J ASOND 1
1
FMAM J J ASOND 1
2
FMAM J J ASOND 1
3
FMAM J J ASOND 1
4
FMAM J
San Francisco Condos: Sold Prices & Unit Sales
(3-month moving average — $000's)
Ave Med Units © 2014 rereport.com
-30.0%
-20.0%
-10.0%
0.0%
10.0%
20.0%
30.0%
40.0%
0
9
FMAM J J AS OND 1
0
FMAM J J A S OND 1
1
FMAM J J A S OND 1
2
FMAM J J A S OND 1
3
FMAM J J A S OND 1
4
FMAM
San Francisco Condos/Lofts: Year-Over-Year Median Sales Price Change
© 2014 rereport.com
Unit
Median Average Sales DOM SP/LP Median Average Sales Median Average Sales
San Francisco 975,000$ 1,181,657$ 275 33 107.4% 25.0% 25.1% 6.2% 2.1% 0.4% -3.5%
D1: Northwest 1,000,000$ 1,229,385$ 13 32 110.2% 13.4% 16.6% 18.2% -21.9% -1.8% 0.0%
D2: Central West 1,160,000$ 1,240,222$ 9 15 116.3% 112.8% 78.9% 125.0% 40.8% 42.8% 125.0%
D3: Southwest 549,500$ 549,500$ 2 49 102.9% 53.1% 53.1% 100.0% -34.2% -17.8% -60.0%
D4: Twin Peaks 810,000$ 810,000$ 1 47 101.9% 18.2% 27.1% -75.0% 35.0% 14.4% -85.7%
D5: Central 1,125,000$ 1,124,965$ 49 25 111.6% 25.7% 21.0% 4.3% 3.7% -6.0% 58.1%
D6: Central North 1,025,000$ 1,138,118$ 17 26 115.1% 42.3% 45.3% -34.6% 13.9% 23.9% -45.2%
D7: North 1,317,500$ 1,530,912$ 34 32 104.2% 3.2% 21.3% 9.7% 1.3% 1.2% 70.0%
D8: Northeast 774,500$ 1,258,359$ 49 56 106.0% 7.2% 24.5% 22.5% -23.7% -3.6% -2.0%
D9: Central East 899,500$ 1,094,267$ 96 29 105.2% 17.5% 19.8% 9.1% -5.3% -7.9% -22.0%
D10: Southeast 486,500$ 486,500$ 2 68 123.1% -7.9% 4.3% -60.0% 95.8% 95.8% 100.0%
June Sales Statistics
(Condos/TICs/Co-ops/Lofts)
Prices Yearly Change Monthly Change
- 4. The Real Estate Market Trends Report is published and copyrighted by http://rereport.com.
THE REAL ESTATE REPORT
San Francisco
Annie Williams
Hill & Company
1880 Lombard Street
San Francisco 94123
Go online to see the full report
with the district by district breakdown:
HTTP://WWW.ANNIEWILLIAMSHOMES.COM
-25.0
-20.0
-15.0
-10.0
-5.0
0.0
5.0
10.0
15.0
20.0
25.0
0
8
FMAMJ JASOND0
9
FMAMJ JASOND1
0
FMAMJ JASOND1
1
FMAMJ JASOND1
2
FMAMJ JASOND1
3
FMAMJ JASOND1
4
FMAMJ
San Francisco Homes: Sales Momentum
Sales Pricing © 2014 rereport.com
-50.0
-40.0
-30.0
-20.0
-10.0
0.0
10.0
20.0
30.0
40.0
0
8
FMAMJ JASOND0
9
FMAMJ JASOND1
0
FMAMJ JASOND1
1
FMAMJ JASOND1
2
FMAMJ JASOND1
3
FMAMJ JASOND1
4
FMAMJ
San Francisco Condos/Lofts: Sales Momentum
Sales Pricing © 2014 rereport.com