Quantitative Easing and Mortgage Rates - Real Estate Report November/December
•
0 likes•502 views

The Robb Fleischer’s Real Estate Report – Local Market Trends San Francisco includes monthly updates regarding mortgage rates, market statistics, sales momentum, pricing momentum, trends at a glance, foreclosure statistics and more.

Recommended
Recommended
More Related Content
What's hot
What's hot (20)
Similar to Quantitative Easing and Mortgage Rates - Real Estate Report November/December
Similar to Quantitative Easing and Mortgage Rates - Real Estate Report November/December (19)
Recently uploaded
Recently uploaded (20)
Quantitative Easing and Mortgage Rates - Real Estate Report November/December
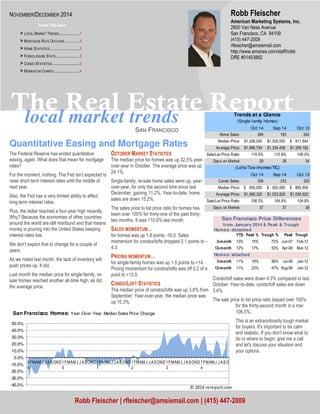
- 1. Robb Fleischer The Real Estate Report local market trends SAN FRANCISCO Trends at a Glance (Single-family Homes) (Lof ts/Tow nhomes/TIC) San Francisco Price Differences from January 2014 & Peak & Trough Condo/loft sales were down 4.3% compared to last October. Year-to-date, condo/loft sales are down 3.4%. The sale price to list price ratio stayed over 100% for the thirty-second month in a row: 106.5%. This is an extraordinarily tough market for buyers. It's important to be calm and realistic. If you don't know what to do or where to begin, give me a call and let's discuss your situation and your options. Quantitative Easing and Mortgage Rates The Federal Reserve has ended quantitative easing, again. What does that mean for mortgage rates? For the moment, nothing. The Fed isn’t expected to raise short term interest rates until the middle of next year. Also, the Fed has a very limited ability to affect long-term interest rates. Plus, the dollar reached a four-year high recently. Why? Because the economies of other countries around the world are still moribund and that means money is pouring into the United States keeping interest rates low. We don’t expect that to change for a couple of years. As we noted last month, the lack of inventory will push prices up. It did. Last month the median price for single-family, re-sale homes reached another all-time high, as did the average price. OCTOBER MARKET STATISTICS The median price for homes was up 32.5% year-over- year in October. The average price was up 24.1%. Single-family, re-sale home sales were up, year-over- year, for only the second time since last December, gaining 11.2%. Year-to-date, home sales are down 15.2%. The sales price to list price ratio for homes has been over 100% for thirty-one of the past thirty-two months. It was 110.6% last month. SALES MOMENTUM… for homes was up 1.8 points -16.0. Sales momentum for condos/lofts dropped 2.1 points to – 4.3. PRICING MOMENTUM… for single-family homes was up 1.5 points to +14. Pricing momentum for condos/lofts was off 0.2 of a point to +12.0. CONDO/LOFT STATISTICS The median price of condos/lofts was up 3.8% from September. Year-over-year, the median price was up 10.3%. American Marketing Systems, Inc. 2800 Van Ness Avenue San Francisco, CA 94109 (415) 447-2009 rfleischer@amsiemail.com http://www.amsires.com/staff/robb DRE #01403882 Robb Fleischer | rfleischer@amsiemail.com | (415) 447-2009 NOVEMBER/DECEMBER 2014 Inside This Issue > LOCAL MARKET TRENDS ..................... 1 > MORTGAGE RATE OUTLOOK ............... 2 > HOME STATISTICS .............................. 2 > FORECLOSURE STATS ........................ 3 > CONDO STATISTICS ............................ 3 > MOMENTUM CHARTS .......................... 4 Oct 14 Sep 14 Oct 13 Home Sales: 269 183 242 Median Price: $1 ,208,000 $1 ,035,000 $ 911,944 Av erage Price: $1 ,686,754 $1 ,334,436 $1 ,359,182 Sale/List Price Ratio: 110.6% 110.8% 108.0% Day s on Market: 29 26 34 Oct 14 Sep 14 Oct 13 Condo Sales: 309 233 323 Median Price: $ 9 55,000 $ 9 20,000 $ 8 65,900 Av erage Price: $1 ,069,320 $1 ,023,825 $1 ,006,920 Sale/List Price Ratio: 106.5% 104.9% 104.8% Day s on Market: 37 37 38 Homes: detached YTD Peak % Trough % Peak Trough 3-month 13% 15% 72% Jun-07 Feb-12 12-month 12% 17% 53% Apr-08 Mar-12 Homes: attached 3-month 11% 19% 56% Jul-08 Jan-12 12-month 11% 23% 47% Aug-08 Jan-12 50.0% 40.0% 30.0% 20.0% 10.0% 0.0% -10.0% -20.0% -30.0% -40.0% 0 9 FMAM J J ASOND 1 0 FMAMJ J ASOND 1 1 FMAM J J ASOND 1 2 FMAM J J ASOND 1 3 FMAMJ J ASOND 1 4 FMAM J J ASO San Francisco Homes: Year-Over-Year Median Sales Price Change
- 2. 30-Year Fixed Mortgage Rates 07-14 04-14 01-14 10-13 07-13 04-13 01-13 10-12 07-12 04-12 01-12 10-11 07-11 04-11 01-11 10-10 07-10 04-10 01-10 10-09 07-09 04-09 01-09 10-08 07-08 04-08 3.0% 4.0% 5.0% 6.0% 7.0% 8.0% Page 2 The Real Estate Report The chart above shows the Na-tional monthly average for 30- year fixed rate mortgages as compiled by HSH.com. The av-erage includes mortgages of all sizes, including conforming, expanded conforming, and jumbo. MORTGAGE RATE OUTLOOK Mortgage Rates Firming Slightly October 31, 2014 -- Rebounding stock markets and com-forting economic data have reassured investors that things are pretty good at the moment, and mortgage rates continued on a gentle firming path after a tu-multuous stretch in mid-month. In a direct acknowledgment that the economy is on solid footing (and despite a rocky month of October for financial markets) the Fed followed its predeter-mined path to end the accumulation of Mortgage- Backed Securities and Treasury bonds. Quantitative Easing (QE) hasn't fully ended, though, as the Fed will continue to recycle (reinvest) inbound funds from maturing Treasury bonds and principal pay-ments on mortgages into like-sized purchases of new bonds. As such, it will keep its portfolio of holdings level and continue to help foster a low long-term interest rate environment for at least a while longer yet. The actual end of QE will begin when the Fed starts to raise short-term interest rates at some point and stops recycling cash; present indications are that this process of normalization will begin in the second or third quarters of 2015, so we will likely have a considerable period (the Fed's language) of 6 to 9 months before that occurs. In the meantime, mortgage and underlying interest rates cannot regularly ignore good economic news, and have been steadily firming in the days after a mid-month panic fit by the stock and bond markets. There's no spike in rates to be expected, but we are seeing a bit of a gradual uptick at the moment. HSH.com's broad-market mortgage tracker -- our weekly Fixed-Rate Mortgage Indicator (FRMI) -- found that the overall average rate for 30-year fixed-rate mortgages firmed up by five basis points this week (0.05%) rising to 4.09 percent. The FRMI's 15- year companion also saw an increase of five basis points (0.05%), as this popular refinancing product edged up to 3.34 percent. Fully-insured FHA-backed 30-year FRMs remain a bargain even with a four basis point rise in the average this week, as the pre-sent 3.78 percent average remains well below even conforming product. Finally, the overall 5/1 Hybrid ARM reversed course from last week, adding five basis points to increase to an average 3.06 percent. 350 300 250 200 150 100 50 0 $1,700 $1,500 $1,300 $1,100 $900 $700 $500 $300 0 9 FMAMJ J ASOND1 0 FMAMJ J ASOND1 1 FMAMJ J ASOND1 2 FMAMJ J ASOND1 3 FMAMJ J ASOND1 4 FMAMJ JASO San Francisco Homes: Sold Prices Unit Sales (3-month moving average —$000's) Ave Med Units
- 3. October Sales Statistics Unit (Single-family Homes) Prices Yearly Change Monthly Change Median Average Sales DOM SP/LP Median Average Sales Median Average Sales San Francisco $1 ,208,000 $1 ,686,754 269 29 110.6% 32.5% 24.1% 11.2% 16.7% 26.4% 47.0% D1: Northwest $ 1,619,000 $1 ,828,757 28 20 113.4% 13.2% 8.2% 40.0% 24.5% 19.1% 47.4% D2: Central West $ 9 43,000 $1 ,044,021 43 39 114.0% 17.9% 28.2% -17.3% -4.7% 0.6% 16.2% D3: Southwest $ 850,000 $ 8 86,868 16 55 110.0% 2.1% 5.6% 0.0% 5.6% -3.0% 23.1% D4: Twin Peaks $1 ,311,500 $1 ,461,906 32 22 113.3% 24.9% 20.9% 10.3% 16.6% 7.8% 28.0% D5: Central $ 1,862,500 $2 ,430,000 38 17 112.5% 16.8% 34.7% 8.6% 4.1% 13.5% 123.5% D6: Central North $ 2,025,000 $2 ,054,000 7 18 106.6% 30.6% 25.8% 133.3% -26.4% -25.3% 600.0% D7: North $ 4,135,938 $5 ,126,849 20 28 104.5% 7.3% 9.6% 53.8% -5.0% 7.8% 185.7% D8: Northeast $3 ,495,000 $2 ,595,000 3 17 100.5% -14.5% -36.2% -25.0% n/a n/a n/a D9: Central East $1 ,296,000 $1 ,350,517 30 22 115.9% 22.8% 10.2% 20.0% 11.7% 6.9% 42.9% D10: Southeast $ 7 36,500 $ 7 52,160 52 36 111.3% 20.7% 18.6% 15.6% 3.9% 1.4% 20.9% 01-08
- 4. Table Definitions _______________ Median Price The price at which 50% of prices were higher and 50%were lower. Average Price Add all prices and divide by the number of sales. SP/LP Sales price to list price ratio or the price paid for the property divided by the asking price. DOI Days of Inventory, or how many days it would take to sell all the property for sale at the current rate of sales. Pend Property under contract to sell that hasn’t closed escrow. Inven Number of properties actively for sale as of the last day of the month. 40.0% 30.0% 20.0% 10.0% 0.0% -10.0% -20.0% FORECLOSURE STATISTICS Notices of default, the first step in the foreclosure proc-ess, in San Francisco fell 1.6% in September from Au-gust. Year-over-year, notices were jumped 59%. There were 62 notices in September. Notices of sale, which set the date and time of an auc-tion, and serve as the homeowner's final notice before sale, fell 17.9% from August, and they were down 14.8% year-over-year. There were 23. After the filing of a Notice of Trustee Sale, there are only three possible outcomes. First, the sale can be cancelled for reasons that include a successful loan modification or short sale, a filing error, or a legal re-quirement to re-file the notice after extended postpone-ments. Alternatively, if the property is taken to sale, the bank will place the opening bid. If a third party, typically an investor, bids more than the bank's opening bid, the property will be sold to the third party; if not, it will go back to the bank. There were 24 sales cancelled last month. Three homes went back to the bank in September. There are currently 107 properties scheduled for sale. With the recent surge in prices, many of them will probably be cancelled. The total number of properties owned by the banks was down 14.3% year-over-year. The banks now own ap-proximately 222 properties in the city. 350 300 250 200 150 100 50 0 $1,300 $1,100 $900 $700 $500 $300 0 9 FMAMJ J ASOND 1 0 FMAMJ J ASOND 1 1 FMAMJ J ASOND1 2 FMAMJ J ASOND1 3 FMAMJ J ASOND 1 4 FMAMJ J ASO San Francisco Condos: Sold Prices Unit Sales (3-month moving average —$000's) Ave Med Units
- 5. -30.0% 0 9 FMAM J J ASOND 1 0 FMAMJ J ASOND 1 1 FMAM J J ASOND 1 2 FMAM J J ASOND 1 3 FMAMJ J ASOND 1 4 FMAM J J ASO San Francisco Condos/Lofts: Year-Over-Year Median Sales Price Change © 2014 rereport.com October Sales Statistics (Condos/TICs/Co-ops/Lof ts) Unit Prices Yearly Change Monthly Change Median Average Sales DOM SP/LP Median Average Sales Median Average Sales San Francisco $ 9 55,000 $1 ,069,320 309 37 106.5% 10.3% 6.2% -4.3% 3.8% 4.4% 32.6% D1: Northwest $ 1,400,000 $1 ,303,095 21 34 104.8% 24.4% 20.5% 162.5% 51.1% 30.3% -16.0% D2: Central West $ 8 45,000 $ 8 30,833 6 23 115.5% 11.3% 7.4% -33.3% 18.2% 16.2% 500.0% D3: Southwest $ 470,000 $ 4 67,500 4 46 102.6% -10.5% -19.1% 33.3% -16.5% -17.0% 100.0% D4: Twin Peaks $ 5 57,500 $ 5 71,667 6 26 106.9% 1.5% 8.9% 20.0% -7.1% -6.5% 100.0% D5: Central $ 1,187,000 $1 ,155,133 45 32 112.2% 6.5% 7.8% -19.6% -1.1% -0.8% 36.4% D6: Central North $ 1,070,500 $ 953,771 30 56 111.7% 37.2% 5.2% -28.6% 16.4% 1.9% 15.4% D7: North $ 1,525,000 $1 ,532,205 28 26 106.4% 19.8% 17.1% -22.2% -3.9% 1.5% 100.0% D8: Northeast $ 750,000 $1 ,015,311 47 46 104.8% 0.0% 4.6% -4.1% -12.4% -4.5% 6.8% D9: Central East $ 9 30,000 $1 ,006,824 119 34 104.0% 9.0% 1.0% 9.2% 3.1% 2.1% 56.6% D10: Southeast $ 5 02,500 $ 5 80,833 3 70 106.4% 16.9% 22.7% 0.0% 8.1% 46.4% -40.0%
- 6. THE REAL ESTATE REPORT San Francisco Robb Fleischer American Marketing Systems, Inc. 2800 Van Ness Avenue San Francisco, CA 94109 Go online to see the full report with the district by district breakdown: HTTP://WWW.AMSIRES.COM/STAFF/ROBB FMAMJ JASOND1 FMAMJ JASOND1 The Real Estate Market Trends Report is published and copyrighted by http://rereport.com. 25.0 20.0 15.0 10.0 5.0 0.0 -5.0 -10.0 -15.0 -20.0 -25.0 0 8 FMAMJ JASOND0 9 0 FMAMJ JASOND1 1 FMAMJ JASOND1 2 FMAMJ JASOND1 3 FMAMJ JASOND1 4 FMAMJ JASO San Francisco Homes: Sales Momentum Sales Pricing © 2014 rereport.com 40.0 30.0 20.0 10.0 0.0 -10.0 -20.0 -30.0 -40.0 -50.0 0 8 FMAMJ JASOND0 9 FMAMJ JASOND1 0 1 FMAMJ JASOND1 2 FMAMJ JASOND1 3 FMAMJ JASOND1 4 FMAMJ JASO San Francisco Condos/Lofts: Sales Momentum Sales Pricing © 2014 rereport.com