Chapter 2.ppt of macroeconomics by mankiw 9th edition
Copper gold report 20140331
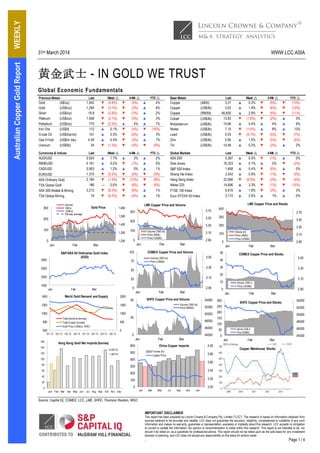
1. 31st March 2014 WWW.LCC.ASIA
IMPORTANT DISCLAIMER
This report has been prepared by Lincoln Crowne & Company Pty. Limited ("LCC"). The research is based on information obtained from
sources believed to be accurate and reliable. LCC does not guarantee the accuracy, reliability, completeness or suitability of any such
information and makes no warranty, guarantee or representation, expressly or impliedly about this research. LCC accepts no obligation
to correct or update the information. No opinion or recommendation is made within this research. This report is not intended to be, nor
should it be relied on, as a substitute for professional advice. This report should not be relied upon as the sole basis for any investment
decision or planning, and LCC does not accept any responsibility on this basis for actions made
. Page 1 / 4
WEEKLYAustralianCopperGoldReport
黄金武士 - IN GOLD WE TRUST
Global Economic Fundamentals
Source: Capital IQ, COMEX, LCC, LME, SHFE, Thomson Reuters, WGC
Precious Metals Last Week r 4-Wk r YTD r Base Metals Last Week r 4-Wk r YTD r
Gold (A$/oz) 1,400 ▼ (4.8%) ▼ (5%) ▲ 4% Copper (A$/lb) 3.27 ▲ 0.2% ▼ (9%) ▼ (13%)
Gold (US$/oz) 1,294 ▼ (3.1%) ▼ (2%) ▲ 8% Copper (US$/lb) 3.02 ▲ 1.9% ▼ (6%) ▼ (10%)
Silver (US$/oz) 19.8 ▼ (2.6%) ▼ (7%) ▲ 2% Copper (RMB/t) 46,650 ▲ 2.8% ▼ (5%) ▼ (11%)
Platinum (US$/oz) 1,406 ▼ (2.1%) ▼ (3%) ▲ 3% Cobalt (US$/lb) 13.83 ▼ (1.6%) ▼ (2%) ▲ 3%
Palladium (US$/oz) 770 ▼ (2.3%) ▲ 4% ▲ 7% Molybdenum (US$/lb) 10.66 ▲ 4.4% ▲ 4% ▲ 9%
Iron Ore (US$/t) 112 ▲ 0.1% ▼ (4%) ▼ (16%) Nickel (US$/lb) 7.15 ▼ (1.4%) ▲ 8% ▲ 13%
Crude Oil (US$/barrel) 101 ▲ 2.3% ▼ (0%) ▲ 3% Lead (US$/lb) 0.93 ▼ (0.1%) ▼ (5%) ▼ (7%)
Gas H.Hub (US$/m btu) 4.49 ▲ 4.4% ▼ (3%) ▲ 7% Zinc (US$/lb) 0.90 ▲ 1.5% ▼ (5%) ▼ (5%)
Uranium (US$/lb) 34 ▼ (1.3%) ▼ (3%) ▼ (0%) Tin (US$/lb) 10.46 ▲ 0.2% ▼ (2%) ▲ 2%
Currencies & Indices Last Week r 4-Wk r YTD r Global Markets Last Week r 4-Wk r YTD r
AUD/USD 0.924 ▲ 1.7% ▲ 3% ▲ 2% ASX 200 5,367 ▲ 0.5% ▼ (1%) ▲ 0%
RMB/USD 0.161 ▲ 0.2% ▼ (1%) ▲ 0% Dow Jones 16,323 ▲ 0.1% ▲ 0% ▼ (2%)
CAD/USD 0.903 ▲ 1.2% ▲ 0% ▲ 1% S&P 500 Index 1,858 ▲ 0.4% ▼ (0%) ▲ 0%
EUR/USD 1.375 ▼ (0.2%) ▼ (0%) ▼ (0%) Shang Hai Index 2,042 ▲ 0.9% ▼ (1%) ▼ (2%)
ASX Ordinary Gold 2,184 ▼ (1.5%) ▼ (12%) ▼ (8%) Hang Seng Index 22,066 ▼ (0.3%) ▼ (3%) ▼ (4%)
TSX Global Gold 186 — 0.0% ▼ (6%) ▼ (6%) Nikkei 225 14,696 ▲ 3.3% ▼ (1%) ▼ (10%)
ASX 300 Metals & Mining 3,212 ▼ (8.3%) ▼ (6%) ▲ 1% FTSE 100 Index 6,616 ▲ 1.8% ▼ (3%) ▲ 3%
TSX Global Mining 74 ▼ (6.2%) ▼ (4%) ▲ 1% Euro STOXX 50 Index 3,172 ▲ 2.6% ▲ 1% ▲ 0%
1,200
1,300
1,400
1,500
1,600
0
100
200
300
Jan Feb Mar
Thousands
Gold Price
Volume
A$/oz
US$/oz
200 day average
2.90
3.10
3.30
3.50
3.70
0
100
200
300
Jan Feb Mar
Thousands
LME Copper Price and Volume
Volume ('000 lot)
Price (A$/lb)
Price (US$/lb)
2.90
3.10
3.30
3.50
0
10
20
30
40
50
Jan Feb Mar
COMEX Copper Price and Stocks
Stocks ('000 t)
Price (US$/lb)
44000
46000
48000
50000
52000
54000
0
50
100
150
200
250
300
Jan Feb Mar
Thousands
SHFE Copper Price and Stocks
Stocks ('000 t)
Price (RMB/t)
44000
46000
48000
50000
52000
54000
0
25
50
Jan Feb Mar
Thousands
SHFE Copper Price and Volume
Volume ('000 lot)
Price (RMB/t)
2.90
3.10
3.30
3.50
0
25
50
75
100
Jan Feb Mar
COMEX Copper Price and Volume
Volume ('000 lot)
Price (US$/lb)
1500
2000
2500
3000
Jan Feb Mar
S&P/ASX All Ordinaries Gold Index
(XGD)
3.00
3.20
3.40
3.60
3.80
4.00
0
100
200
300
400
500
600
Jan Mar May Jul Sep Nov Jan
China Copper Imports
Tonnes (kt)
Copper Price
2.90
3.10
3.30
3.50
3.70
0
100
200
300
400
Jan Feb Mar
LME Copper Price and Stocks
Stocks (kt)
Price (A$/lb)
Price (US$/lb)
0
500
1000
1500
2000
600
800
1000
1200
1400
Q1 12 Q2 12 Q3 12 Q4 12 Q1 13 Q2 13 Q3 13 Q4 13
World Gold Demand and Supply
Total Demand (tonnes)
Total Supply (tonnes)
Gold Price (US$/oz, RHS)
Copper Warehouse Stocks
0
20
40
60
80
100
120
140
160
Jan Feb Mar Apr May Jun Jul Aug Sep Oct Nov Dec
Hong Kong Gold Net Imports (tonnes)
2013
2014
2. 31st March 2014 WWW.LCC.ASIA
IMPORTANT DISCLAIMER
This report has been prepared by Lincoln Crowne & Company Pty. Limited ("LCC"). The research is based on information obtained from
sources believed to be accurate and reliable. LCC does not guarantee the accuracy, reliability, completeness or suitability of any such
information and makes no warranty, guarantee or representation, expressly or impliedly about this research. LCC accepts no obligation
to correct or update the information. No opinion or recommendation is made within this research. This report is not intended to be, nor
should it be relied on, as a substitute for professional advice. This report should not be relied upon as the sole basis for any investment
decision or planning, and LCC does not accept any responsibility on this basis for actions made
. Page 2 / 4
WEEKLYAustralianCopperGoldReport
Markets & Majors
World #1 copper producer Codelco's output fell to a five-year low
and its profit dropped by half in 2013 due to dwindling ore grades
and lower metal prices. Output was 1.62 million tonnes or 1.5%
lower year on year. Codelco indicated that production falls at
Chuquicamata, Radomiro Tomic, Salvador, Andina and Gabriela
Mistral mines were partially compensated by an increase at the El
Teniente mine. Direct cash costs fell 0.3% to US$1.63/lb Cu,
helped by lower power prices. Chile expects mining investment to
reach US$112 billion by 2021, figure that include US$27 billion
planned by Codelco with the expectation to maintain existing
production and increase it to 2.1mt by 2021.
Metal Bulletin has launched an index for copper concentrate
treatment and refining charges (TC/RCs) on a CIF Asia-Pacific
ports basis. The TC/RC index was published for the first time on
14th March 2014, at a value of US$92 per dry metric tonne/9.2¢/lb,
down from a high of US$122/12¢ at the end of November. This
compares with US$66/6.6¢ on 15th June 2013. Rises and falls in
TC/RCs provide an insight into the balance of supply and demand
in the copper concentrates market. As such, they can be a leading
indicator for supply and demand in the refined copper market.
Traders are bidding aggressively to secure premium concentrates
ahead of an expected squeeze in the market later in the year, as
mine delays and disruptions continue. Smelters, by contrast, are
still holding comfortable inventories that they built up around the
turn of the year, and have so far avoided paying the higher prices
that traders have agreed with miners. Recent sales to traders and
smelters show an inverted spread between the cost of buying
from mines and terms that can be extracted from consumers.
High-grade copper concentrates have recently been sold to trade
buyers at levels below US$80/8¢.
Reuters - Forthcoming metals warehouse rule changes and global
political uncertainty have dampened the appetite for new industrial
metals funds that are backed by physical material. In response to
bitter complaints from metals users about delays in getting hold of
metal, the LME last year announced changes to its rules on
warehouses, stipulating a 50-day maximum wait time for delivery
of physical metals. The rules come into effect on 1st April.
Reuters - Workers at Glencore Xstrata's Tintaya-Antapaccay
copper mine in the Peruvian Andes have launched a 48-hour
strike to demand a bigger share of profit. The deposit that
produced 151,200 tonnes of copper last year is operating normally,
a Peru-based Glencore spokesman said. Around 900 of 1,200
miners have dropped their tools at the mine located in the Cusco
region, according to the secretary general of the union. Glencore
has been operating in Tintaya-Antapaccay for 16 months and has
been implementing drastic changes to labour relations.
Rio Tinto faces more delays to reach an agreement with the
Mongolian government to expand the Oyu Tolgoi project into an
underground mine. The standoff between Rio and the government
- a funded 34% partner in the project - means the March 31 expiry
date on project finance commitments from lenders is set to come
in to force, requiring the project partners to seek extensions of the
commitments. Production guidance for 2014 has been revised at
135,000–160,000t of copper in concentrates and 600,000–
700,000oz of gold, down from the previous forecast of 150,000–
175,000t of copper and 700,000–750,000oz.
Jiangxi Copper, China's top producer of the metal, expects that
the Chinese copper consumption will increase by about 700,000t
in 2014 from the previous year, while production is expected to
rise by between 600,000-650,000t.
The gold price broke through the 200-day moving average, a key
support level. Last week saw the first reduction in four weeks of
holdings in ETF backed by physical gold. The reduction was small,
only 0.2 t, but marked a loss of positive momentum.
Mineweb - For the first two months of the year net gold imports
through Hong Kong totaled 192.8t as compared with 80.6t in the
first two months of 2013 suggesting a rise of just under 140%. The
very fact that China imported more than 100t in February –
normally a weak month for gold imports because of the Chinese
New Year holiday – has to be highly significant as a guide to likely
ongoing Chinese demand.
Copper Explorers & Emerging Producers
Copper Producers
Source: ASX, Capital IQ, LCC. Assumption: A$/US$ of 0.90
Code Company Name
Close
Price
Week r YTD r
Market
Cap (A$m)
52 Week
Range
Cash
(A$m)
EV (A$m)
AVI Avalon Minerals 0.010 ▲ 25% 0% 12 2.7 9
AVB Avanco Resources 0.068 ▲ 1% (4% ) 92 16.6 75
AZS Azure Minerals 0.030 — 0% 0% 21 2.3 19
BMB Balamara Resources 0.11 ▼ (4% ) 16% 38 1.2 36
BTR Blackthorn Resources 0.15 ▼ (12% ) (42% ) 25 16.3 8
BOC Bougainville Copper 0.54 ▼ (2% ) 13% 215 6.2 208
CDU Cudeco 1.76 ▲ 9% (2% ) 412 47.4 364
ERM Emmerson Resources 0.032 ▼ (18% ) (24% ) 8.4 1.2 7
ENR Encounter Resources 0.20 ▼ (13% ) 5% 27 3.9 23
ESR Estrella Resources 0.15 ▲ 21% (17% ) 14 2.0 12
FND Finders Resources 0.18 ▲ 3% (17% ) 97 12.9 84
GCR Golden Cross Resources 0.005 — 0% 0% 9 1.1 8
HAV Havilah Resources 0.24 ▼ (4% ) (4% ) 29 3.5 25
HCH Hot Chili 0.38 ▼ (3% ) (11% ) 132 8.2 124
HIG Highlands Pacific 0.063 ▼ (15% ) 3% 54 9.6 44
IRN Indophil Resources 0.17 ▼ (3% ) 3% 205 215.1 (11)
KGL KGL Resources 0.110 ▲ 10% 5% 15 7.8 8
KDR Kidman Resources 0.110 ▼ (4% ) (41% ) 14 3.7 11
MMC Marengo Mining 0.014 — 0% (7% ) 16 4.5 39
MNC Metminco 0.023 ▼ (12% ) (26% ) 40 7.8 32
PEX Peel Mining 0.22 — 0% (15% ) 29 3.8 25
RDM Red Metal 0.17 — 0% 10% 24 1.1 23
RXM Rex Minerals 0.37 ▼ (10% ) (23% ) 80 20.9 59
SBR Sabre Resources 0.035 ▼ (8% ) (19% ) 8 4.1 4
SUH Southern Hemisphere 0.055 ▲ 2% 10% 14 0.5 13
TLM Talisman Mining 0.11 — 0% 5% 14 17.3 (3)
VXR Venturex Resources 0.007 — 0% (30% ) 11 3.4 7
XAM Xanadu Mines 0.050 — 0% 0% 10 2.8 7
YTC YTC Resources 0.23 ▼ (4% ) 0% 75 25.8 115
Code Company Name Close Price Week r YTD r
Market
Cap (A$m)
52 Week
Range
Cash
(A$m)
EV (A$m)
EV/
EBITDA
ABY Aditya Birla Minerals 0.30 — 0% (13% ) 92 118 (25) NM
AOH Altona Mining 0.16 ▼ (3% ) (3% ) 85 20 76 3.3x
DML Discovery Metals 0.028 — 0% (47% ) 16 13 174 NM
HGO Hillgrove Resources 0.075 ▼ (12% ) (17% ) 89 17 117 3.4x
OZL OZ Minerals 3.42 ▲ 8% 9% 1,038 364 674 3.9x
PNA PanAust 1.54 ▼ (3% ) (15% ) 937 145 972 4.0x
SFR Sandfire Resources 5.70 ▲ 4% (12% ) 887 75 1,042 8.2x
SRQ Straits Resources 0.005 — 0% (38% ) 6 12 116 NM
TGS Tiger Resources 0.35 ▼ (3% ) 1% 281 42 295 4.5x
MWE Mawson West C$0.55 ▼ (2% ) (5% ) 92 56 59 1.9x
985 CST Mining Group HK$0.058 ▼ (2% ) (13% ) 219 119 100 NM
3. 31st March 2014 WWW.LCC.ASIA
IMPORTANT DISCLAIMER
This report has been prepared by Lincoln Crowne & Company Pty. Limited ("LCC"). The research is based on information obtained from
sources believed to be accurate and reliable. LCC does not guarantee the accuracy, reliability, completeness or suitability of any such
information and makes no warranty, guarantee or representation, expressly or impliedly about this research. LCC accepts no obligation
to correct or update the information. No opinion or recommendation is made within this research. This report is not intended to be, nor
should it be relied on, as a substitute for professional advice. This report should not be relied upon as the sole basis for any investment
decision or planning, and LCC does not accept any responsibility on this basis for actions made
. Page 3 / 4
WEEKLYAustralianCopperGoldReport
Mergers & Acquisitions
Bloomberg expects about US$30 billion in private equity
investment to come into the mining sector as funds look for
somewhere to park the significant capital raised in the past three
years. Global mining sector head Ken Hoffman told delegates at
Mines and Money Hong Kong on 27th March that 96 mining-
specific funds emerged in 2013, raising almost US$8 billion in the
same year.
Centamin (LSE: CEN) has moved to compulsory acquisition of
Ampella Mining (ASX: AMX) after closing a takeover offer.
Indophil Resources (ASX: IRN) indicated interest in acquiring
Glencore Xstrata’s stake in the US$5.9 billion Tampakan copper-
gold project in the Philippines. The project operator Sagittarius
Mines is owned 37.5% by IRN and 62.5% by GX. Indophil Vice
President for Corporate Affairs Gavan Collery said that the
company will resume negotiations in acquiring the remaining
stake in Sagittarius after Glencore Xstrata sells its Las Bambas
copper-gold mine in Peru.
ASX-Listed Company News
Altona Mining (ASX: AOH) announced an increase of the mineral
resource at its Kylylahti underground mine at the Outokumpu
copper project in Finland, with contained copper rising 17%. The
resource estimate now stands at 8.8mt at 1.3% copper, 0.8g/t
gold and 0.5% zinc. Contained metal is 117,480t of copper,
222,595oz of gold and 47,401t zinc. Resources are reported
above a 0.4% copper lower cut-off grade.
Resolute Mining (ASX: RSG) announced the results of the PFS at
Syama, Mali. Ore reserves increased to 3.15 million ounces, up
1.1moz with the addition of 14.3mt of underground ore. Reserves
were estimated using a gold price of US$1,300/oz.
St Barbara (ASX: SBM) has advised that performance at Simberi
in the March 2014 quarter has been hampered by poor mining
performance and delays in ramping up the new processing circuit.
The recently completed processing plant expansion, designed to
lift ore throughput from 2mtpa to 3.5mtpa, requires significant
debottlenecking and optimisation work to achieve nameplate
performance. Gold production for the March 2014 quarter will be
modest at around 11,000oz, with production for FY14 estimated to
be between 45,000 and 50,000oz. Simberi is now expected to be
cash positive by the month of December 2014. An annualised
production rate of 90,000 to 100,000oz is expected by March
2015. Unit cash operating costs for FY14 are expected to be
between A$1,850 and A$1,950/oz. Standard & Poor’s has revised
down St Barbara’s credit rating to B- from B.
Gold Explorers & Emerging Producers
Source: ASX, Capital IQ, LCC. Assumption: A$/US$ of 0.90
Gold Producers
Source: ASX, Capital IQ, LCC. Assumption: A$/US$ of 0.90
Code Company Name
Close
Price
Week r YTD r
Market Cap
(A$m)
52 Week
Range
Cash
(A$m)
EV
(A$m)
ABU ABM Resources 0.024 ▼ (8%) 9% 91 5.1 86
ALK Alkane Resources 0.32 ▲ 12% (6%) 119 43.3 76
AUK Augur Resources 0.051 ▲ 2% (32%) 14 2.2 11
AZM Azumah Resources 0.051 ▼ (23%) 82% 18 3.3 15
BSR Bassari Resources 0.007 ▼ (22%) (13%) 7 0.2 7
BAB Bullabulling Gold 0.053 ▼ (12%) 18% 18 4.3 14
CHN Chalice Gold 0.15 ▼ (3%) 7% 43 55.1 (12)
CHZ Chesser Resources 0.13 ▼ (7%) 24% 29 4.6 24
CDG Cleveland Mining 0.09 ▼ (14%) (10%) 22 0.6 21
CVG Convergent Minerals 0.013 ▼ (7%) (19%) 5 0.7 4
CAS Crusader Resources 0.28 ▼ (5%) (7%) 35 2.2 38
DCN Dacian Gold 0.36 ▼ (4%) 48% 34 13.2 21
EXG Excelsior Gold 0.082 ▼ (2%) 19% 34 4.3 28
FMl Focus Minerals 0.02 ▼ (12%) 25% 137 81.2 63
GCY Gascoyne Resources 0.16 ▲ 14% 14% 25 1.2 24
GOR Gold Road Resources 0.15 ▼ (19%) 52% 77 7.1 70
GRY Gryphon Minerals 0.15 ▼ (9%) (12%) 60 41.7 18
IDC Indochine Mining 0.076 ▲ 3% 77% 73 0.5 73
IAU Intrepid Mines 0.26 ▼ (5%) (17%) 145 98.2 46
KGD Kula Gold 0.09 ▼ (9%) (18%) 11 3.2 8
MSR Manas Resources 0.037 ▼ (8%) 16% 15 5.6 10
MYG Mutiny Gold 0.029 ▼ (3%) (9%) 18 1.7 22
OBS Orbis Gold 0.32 — 0% 28% 80 5.5 75
ORD Ord Resources 0.00 — 0% (20%) 5 1.5 3
PAN Panoramic Resources 0.41 ▼ (24%) 64% 132 34.0 98
PIR Papillon Resources 1.25 ▼ (9%) 28% 426 43.6 382
PXG Phoenix Gold 0.13 ▼ (10%) (19%) 39 4.6 34
RED Red 5 0.08 ▼ (17%) (15%) 57 36.7 20
RNI Resource & Investment 0.084 ▲ 5% 58% 28 3.0 40
ROL Robust Resources 0.30 ▲ 7% (14%) 47 2.5 50
SIH Sihayo Gold 0.025 ▼ (4%) (17%) 23 0.5 23
SXG Southern Cross Goldfields 0.014 ▼ (7%) 8% 12 5.1 14
SUM Sumatra Copper & Gold 0.08 ▼ (11%) 14% 33 4.0 32
TAM Tanami Gold 0.02 ▼ (29%) (9%) 24 8.8 30
WAF West African Resources 0.16 ▲ 3% 11% 42 1.3 41
YTC YTC Resources 0.23 ▼ (4%) 0% 75 25.8 115
Code Company Name
Close
Price
Week r YTD r
Market
Cap (A$m)
52 Week
Range
Cash
(A$m)
EV (A$m)
EV/
EBITDA
AQG Alacer Gold 2.71 ▼ (11% ) 19% 813 322 491 2.7x
AGD Austral Gold 0.09 — 0% (25% ) 15 9 67 3.5x
BDR Beadell Resources 0.59 ▼ (9% ) (25% ) 467 24 512 4.6x
BEZ Besra Gold 0.027 — 0% (40% ) 11 1 36 NM
DRM Doray Minerals 0.80 ▼ (9% ) 43% 131 24 156 5.2x
DRA Dragon Mining 0.18 ▼ (5% ) 38% 16 6 10 2.3x
EVN Evolution Mining 0.84 ▼ (7% ) 36% 593 37 698 4.1x
EVR Endeavour Mining Corp 0.79 ▼ (10% ) 62% 343 119 523 NM
IGO Independence Group 3.87 ▼ (4% ) 24% 903 46 921 11.0x
KCN Kingsgate Consolidated 0.99 ▼ (12% ) 6% 219 37 358 4.4x
KRM Kingsrose Mining 0.37 — 0% 10% 133 1 131 NM
LSA Lachlan Star 0.25 ▼ (11% ) 23% 36 3 37 NM
MML Medusa Mining 1.99 ▼ (12% ) (2% ) 414 23 390 7.6x
MLX Metals X 0.20 ▼ (11% ) 18% 331 50 281 13.4x
MOY Millennium Minerals 0.10 ▼ (9% ) (47% ) 22 5 55 2.0x
MLI Mintails 0.054 — 0% (4% ) 15 4 10 NM
NCM Newcrest Mining 9.80 ▼ (7% ) 26% 7,507 121 12,024 11.4x
NGF Norton Gold Fields 0.13 ▼ (4% ) (7% ) 116 41 190 2.6x
NST Northern Star Resources 1.10 ▼ (10% ) 40% 636 49 587 10.3x
OGC OceanaGold Corporation 2.41 ▼ (15% ) 52% 739 28 905 3.7x
PNA PanAust 1.54 ▼ (3% ) (15% ) 937 145 972 4.0x
PGI PanTerra Gold 0.040 ▼ (13% ) (2% ) 31 5 75 NM
PRU Perseus Mining 0.43 ▼ (9% ) 76% 226 28 198 18.6x
RMS Ramelius Resources 0.11 ▼ (12% ) 13% 40 33 11 1.0x
RRL Regis Resources 2.19 ▼ (9% ) (25% ) 1,094 13 1,091 5.0x
RSG Resolute Mining 0.57 ▼ (11% ) 3% 365 50 409 3.2x
SAR Saracen Mineral Holdings 0.32 ▼ (9% ) 73% 254 23 253 3.1x
SBM St Barbara 0.27 ▼ (27% ) 4% 132 70 392 NM
SLR Silver Lake Resources 0.43 ▼ (9% ) (20% ) 216 17 207 NM
TBR Tribune Resources 3.10 ▼ (1% ) 33% 156 9 166 3.2x
TGZ Teranga Gold Corp 0.84 ▼ (17% ) 52% 285 39 313 NM
TRY Troy Resources 1.02 ▼ (19% ) 30% 195 18 207 7.2x
UML Unity Mining 0.022 ▼ (12% ) (46% ) 21 10 11 1.4x
VGO Vantage Goldfields 0.023 ▼ (18% ) (12% ) 6 1 5 1.5x
ANG AngloGold Ashanti ZAR186 ▼ (5% ) 52% 7,658 725 11,122 6.4x
ABX Barrick Gold Corp C$20.24 ▼ (7% ) 8% 23,029 2,688 36,671 6.1x
CRK Crocodile Gold Corp C$0.22 ▼ (10% ) 83% 105 3 109 1.5x
GFI Goldfields ZAR42 ▼ (9% ) 27% 3,280 358 5,316 5.6x
NEM Newmont Mining Corp US$24 ▼ (3% ) 4% 12,884 1,739 21,571 6.2x
4. 31st March 2014 WWW.LCC.ASIA
IMPORTANT DISCLAIMER
This report has been prepared by Lincoln Crowne & Company Pty. Limited ("LCC"). The research is based on information obtained from
sources believed to be accurate and reliable. LCC does not guarantee the accuracy, reliability, completeness or suitability of any such
information and makes no warranty, guarantee or representation, expressly or impliedly about this research. LCC accepts no obligation
to correct or update the information. No opinion or recommendation is made within this research. This report is not intended to be, nor
should it be relied on, as a substitute for professional advice. This report should not be relied upon as the sole basis for any investment
decision or planning, and LCC does not accept any responsibility on this basis for actions made
. Page 4 / 4
WEEKLYAustralianCopperGoldReport
Australian Gold Producers Cost Curve
as at 31 December 2013