Oz Metals 20150315
•
1 like•468 views

Gold prices have swung into defensive mode on fresh signs of resurgence in the U.S. economy, wilting the metal's safe haven appeal. Update on metals market and junior mining companies listed on the Australian Securities Exchange

Recommended
More Related Content
What's hot
What's hot (20)
Viewers also liked
Viewers also liked (17)
Similar to Oz Metals 20150315
Similar to Oz Metals 20150315 (18)
Recently uploaded
Recently uploaded (20)
Oz Metals 20150315
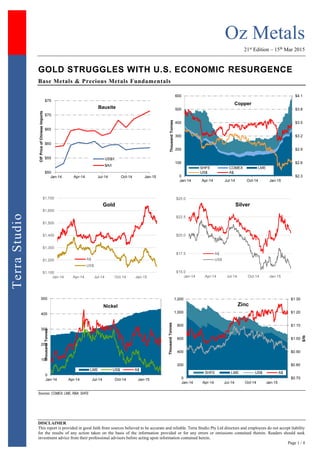
- 1. Oz Metals 21st Edition – 15th Mar 2015 DISCLAIMER This report is provided in good faith from sources believed to be accurate and reliable. Terra Studio Pty Ltd directors and employees do not accept liability for the results of any action taken on the basis of the information provided or for any errors or omissions contained therein. Readers should seek investment advice from their professional advisors before acting upon information contained herein. Page 1 / 4 TerraStudio GOLD STRUGGLES WITH U.S. ECONOMIC RESURGENCE Base Metals & Precious Metals Fundamentals Sources: COMEX, LME, RBA, SHFE $50 $55 $60 $65 $70 $75 Jan-14 Apr-14 Jul-14 Oct-14 Jan-15 CIFPriceofChineseImports Bauxite US$/t $A/t $2.3 $2.6 $2.9 $3.2 $3.5 $3.8 $4.1 0 100 200 300 400 500 600 Jan-14 Apr-14 Jul-14 Oct-14 Jan-15 ThousandTonnes Copper SHFE COMEX LME US$ A$ $1,100 $1,200 $1,300 $1,400 $1,500 $1,600 $1,700 Jan-14 Apr-14 Jul-14 Oct-14 Jan-15 Gold A$ US$ $15.0 $17.5 $20.0 $22.5 $25.0 Jan-14 Apr-14 Jul-14 Oct-14 Jan-15 Silver A$ US$ $6 $9 0 100 200 300 400 500 Jan-14 Apr-14 Jul-14 Oct-14 Jan-15 $/lb ThousandTonnes Nickel LME US$ A$ $0.70 $0.80 $0.90 $1.00 $1.10 $1.20 $1.30 0 200 400 600 800 1,000 1,200 Jan-14 Apr-14 Jul-14 Oct-14 Jan-15 $/lb ThousandTonnes Zinc SHFE LME US$ A$
- 2. Oz Metals 21st Edition – 15th Mar 2015 DISCLAIMER This report is provided in good faith from sources believed to be accurate and reliable. Terra Studio Pty Ltd directors and employees do not accept liability for the results of any action taken on the basis of the information provided or for any errors or omissions contained therein. Readers should seek investment advice from their professional advisors before acting upon information contained herein. Page 2 / 4 TerraStudio Markets & Majors Thomson Reuters - Gold prices have swung into defensive mode on fresh signs of resurgence in the U.S. economy, wilting the metal's safe haven appeal. Traders foresee further downside potential as stronger than expected economic data argues for an earlier rise in U.S. interest rates. One major indication of gold's increased sensitivity to U.S. statistics was the metal's slump on Friday to $1,163/oz, its lowest price in three months, after the labour department released data showing non-farm payrolls grew more than expected in February. Other recent data on U.S. private employment and durable goods orders has also hurt gold. Thomson Reuters - Demand for spot copper in China strengthened only marginally this week after most factories returned from near month-long Lunar New Year holidays, traders said, as end users expect lower prices and have limited cash to buy copper. Purchases normally pick up after the holiday period, but weaker than expected buying by fabricators this year is weighing on domestic prices. This is reducing buying of spot copper from the international market by importers and is likely to trim China's imports in March and April compared with last year. Factories still appeared to have limited cash to buy refined cop-per despite Beijing's recent measures to boost liquidity, although the measures had slightly improved end users' views on copper prices, traders said. The weakness of the South African rand, which has dropped near 13-year lows against the U.S. dollar, serves as a double-edged sword for mining companies operating in the African country, Reuters wrote. A weaker rand provides mining companies cheaper costs and higher income from sales, but also swells inflationary pressures on the ground that will potentially drive wage claims and labor unrest. Business News Americas wrote that Chile's copper output increased 12.2% year over year to 516,900 tonnes in January. The Escondida mine of BHP Billiton posted the biggest increase of 44% after producing 126,600 tonnes during the month. Chile is pushing to pass a bill to protect the country's glaciers, a move that could deter mining projects in the world's top copper exporter, Reuters reported. A glacier protection law would impede construction of large mining projects high in the Andes or imply higher costs to meet regulations as well as prohibit commercial activity on glaciers in national parks. State-owned Beijing General Research Institute of Mining and Metallurgy sees the annual increase of lead concentrate imported into China slowing to 5% in the next two years, Metal Bulletin reported. The country saw its lead concentrate imports rise 23% year-over-year to 1.8 million tonnes in 2014 on the back of higher treatment charges, according to BGRIMM. According to Reuters, an Indonesian mining ministry official said 11 new nickel smelters are to be built in the country over the next two years at a cost of US$1.4 billion. Most of the six new nickel smelters due to be finished in 2015 are located in Sulawesi and have a combined investment of US$920 million, Coal and Minerals Director General R. Sukhyar said. Russia won the right to explore cobalt ores in 150 sites within the region of the Magellanic mountains at the bottom of the Pacific Ocean, according to a Kommersant report. Russia has 15 years to explore the sites, which could host 35 million tonnes of ore, and will then keep the 50 most promising sites. However, no technology is currently available for deep-sea mining and Russian companies have virtually no interest in the sites, the report added. The Western Australian government is drafting amendments to the Valuation of Land Act 1978, which would cut recent rate increases of up to 400% on mining tenements and up to 3,000% on petroleum exploration permits. Global refined nickel consumption will increase at a compound annual growth rate of around 11% in 2015 to 2020 as the commodity is used in more industrialized products, according to Research and Markets. For instance, the automotive and aerospace industries will raise the demand for the commodity. Mitsui Mining & Smelting expects zinc price to recover toward US$2,300/t in the second half of the year, driven by an expected deficit in the global refined zinc market through 2017, Reuters reported. MMG CEO Andrew Michelmore remains confident that the base metals-focused company will not be an easy target for private equity firms eyeing mining bargains, The Australian Financial Review reported. Equity firms like X2 Resources would have a "very interesting conversation" should they approach the controlling shareholder of the company, China Minmetals Corp., according to Michelmore.
- 3. Oz Metals 21st Edition – 15th Mar 2015 DISCLAIMER This report is provided in good faith from sources believed to be accurate and reliable. Terra Studio Pty Ltd directors and employees do not accept liability for the results of any action taken on the basis of the information provided or for any errors or omissions contained therein. Readers should seek investment advice from their professional advisors before acting upon information contained herein. Page 3 / 4 TerraStudio Funding, Mergers & Acquisitions MMG is standing by its high profile buy of the Las Bambas copper project in Peru from Glencore, even as the price of copper has tanked, according to CEO Andrew Michelmore. Chalice Gold Mines exercised its right to buy back two-thirds, or 2%, of the existing 3% net smelter return royalty over the Cameron gold deposit in Ontario for C$2 million. The acquisition of the royalty is expected to increase the net present value of the larger Cameron project, the company said. KBL Mining has secured a metals purchase agreement with Quintana Mineral Hill Streaming Co. LLC that will net the company US$23 million to pay off debt and fund the development of its Mineral Hill copper-gold mine in New South Wales, Australia. Quintana will be entitled to 24.1% of the payable copper, lead, zinc, silver and gold produced at Mineral Hill until a certain quantity has been supplied, after which the streaming percentage will reduce to 12.1%. Callabonna Resources has entered into a binding term sheet to acquire 100% of the issued share capital of Alice Queen Holding Pty. Ltd. Alice Queen Holding is a private unlisted company, which owns 84.5% and 90% interests, respectively, in the Horn Island gold project in Queensland and the Looking Glass copper-gold porphyry project in New South Wales. The purchase price has been agreed at A$6 million which will be satisfied wholly through the issue of ordinary Callabonna shares. Bauxite Sector Source: Bloomberg, SNL, Terra Studio Lithium-Tantalum Sector Source: SNL, Terra Studio Tin Sector Source: SNL Nickel Sector Source: SNL Copper Developers & Explorers Source: SNL, Terra Studio Copper Producers Source: SNL Company Name Close Price Week Δ YTD Δ 52 Week Range Market Cap (A$m) Cash (A$m) TEV (A$m) Australian Bauxite 0.270 ▲ 2% (11%) 34 5 30 Bauxite Resources 0.080 ▼ (7%) (18%) 19 25 (6) Metallica Minerals 0.050 ▼ (2%) (9%) 8 1 7 Metro Mining 0.035 ▼ (5%) 30% 10 8 3 Code Company Name Close Price Week Δ YTD Δ 52 Week Range Market Cap (A$m) Cash (A$m) TEV (A$m) AJM Altura Mining 0.029 ▼ (3%) (55%) 14 3 13 GXY Galaxy Resources 0.025 — 0% 0% 27 3 93 ORE Orocobre 2.48 ▼ (4%) (11%) 365 26 367 PLS Pilbara Minerals Ltd. 0.041 ▼ (5%) (2%) 25 2 22 RDR Reed Resources 0.033 ▼ (3%) (13%) 17 7 14 Code Company Name Close Price Week Δ YTD Δ 52 Week Range Market Cap (A$m) Cash (A$m) TEV (A$m) CSD Consolidated Tin Mines 0.042 ▼ (9%) 2% 12 0 11 ELT Elementos 0.006 — 0% (25%) 5 1 3 KAS Kasbah Resources 0.042 ▼ (9%) (22%) 19 4 13 MLX Metals X 1.18 ▼ (6%) 50% 491 57 384 MOO Monto Minerals 0.001 — 0% (50%) 1 1 1 SRZ Stellar Resources 0.034 ▲ 3% 17% 10 4 7 VMS Venture Minerals 0.030 ▼ (9%) (3%) 9 7 2 Code Company Name Close Price Week Δ YTD Δ 52 Week Range Market Cap (A$m) Cash (A$m) TEV (A$m) TEV/ EBITDA IGO Independence Group 5.39 ▼ (1%) 22% 1,263 57 1,171 NA MBN Mirabella Nickel 0.135 ▲ 63% 366% 126 18 236 0.4x MCR Mincor Resources 0.69 ▼ (1%) 18% 130 26 111 NA PAN Panoramic Resources 0.56 ▼ (3%) 32% 178 64 120 1.6x WSA Western Areas 3.80 ▼ (6%) 1% 884 231 833 NA AVQ Axiom Mining 0.010 ▼ (17%) (33%) 36 2 34 NM CZI Cassini Resources 0.07 — 0% (42%) 8 8 6 NA DKM Duketon Mining 0.15 ▼ (3%) (44%) 11 7 4 NA LEG Legend Mining 0.007 ▼ (13%) 0% 14 7 7 NM MAT Matsa Resources 0.175 ▲ 21% 3% 25 3 23 NM MLM Metallica Minerals 0.050 ▼ (2%) (9%) 8 1 7 NA PIO Pioneer Resources 0.017 ▼ (11%) 31% 11 1 9 NA POS Poseidon Nickel 0.13 ▼ (4%) 8% 89 4 105 NA SEG Segue Resources 0.006 — 0% 20% 12 1 11 NA SGQ St George Mining 0.050 — 0% (21%) 6 1 4 NA SIR Sirius Resources 2.78 ▼ (4%) 9% 950 59 704 NM TLM Talisman Mining 0.17 ▲ 3% 6% 22 16 7 NA WIN Winward Resources 0.36 ▲ 58% 122% 31 6 28 NA Company Name Close Price Week Δ YTD Δ 52 Week Range Market Cap (A$m) Cash (A$m) TEV (A$m) Argonaut Resources 0.009 ▼ (10%) (44%) 4 1 3 Avanco Resources 0.072 ▼ (8%) (5%) 120 20 100 Avalon Minerals 0.030 ▲ 20% 50% 4 1 3 Azure Minerals 0.014 ▼ (13%) (42%) 11 1 11 CuDeco 1.41 — 0% (28%) 351 7 406 Caravel Minerals 0.009 — 0% 13% 7 1 6 Encounter Resources 0.11 — 0% (15%) 15 4 13 Emmerson Resources 0.025 ▼ (17%) (19%) 9 3 7 Finders Resources 0.14 — 0% (10%) 89 48 41 Golden Cross Resources 0.056 ▼ (8%) (20%) 5 1 4 Geopacific Resources 0.038 ▼ (3%) (27%) 15 3 14 Havilah Resources 0.210 ▲ 5% 50% 33 6 27 Hot Chili 0.12 ▼ (4%) (25%) 42 6 48 Hammer Metals 0.075 ▲ 4% (9%) 7 1 7 Intrepid Mines 0.13 ▲ 4% (7%) 46 74 (28) Kidman Resources 0.047 ▼ (16%) (30%) 6 3 3 KGL Resources 0.16 ▲ 3% (31%) 22 10 12 Minotaur Exploration 0.10 ▼ (17%) (31%) 18 7 11 Metminco 0.005 ▼ (9%) (38%) 10 3 8 Mithril Resources 0.008 ▲ 14% 14% 3 1 2 Peel Mining 0.055 — 0% (20%) 7 2 5 Red Metal 0.04 ▼ (7%) (48%) 7 2 3 Regal Resources 0.046 ▼ (2%) 0% 10 2 7 RTG Mining 0.600 ▼ (8%) 3% 77 3 74 Rex Minerals 0.086 ▼ (14%) (22%) 19 14 5 Syndicated Metals 0.024 — 0% (25%) 7 1 6 Sipa Resources 0.085 ▲ 39% 130% 52 4 51 Southern Hemisphere 0.019 ▼ (14%) (56%) 5 2 4 Thundelarra Resources 0.070 ▼ (7%) (36%) 22 7 15 Xanadu Mines 0.080 ▼ (11%) (20%) 29 4 30 Company Name Close Price Week Δ YTD Δ 52 Week Range Market Cap (A$m) Cash (A$m) TEV (A$m) TEV/ EBITDA Aditya Birla Minerals 0.18 ▲ 3% (8%) 56 137 (48) NA Altona Mining 0.11 — 0% (56%) 56 129 (73) NA Hillgrove Resources 0.37 ▼ (5%) (19%) 54 9 64 1.3x KBL Mining 0.023 ▲ 10% (23%) 11 7 34 NA Mawson West 0.050 ▲ 25% 0% 11 48 40 NM OZ Minerals 3.79 ▲ 2% 9% 1,150 219 932 2.7x PanAust 1.17 ▼ (8%) (18%) 711 74 937 NM Sandfire Resources 4.28 ▼ (4%) (6%) 667 58 751 3.6x Straits Resources 0.004 ▲ 33% (20%) 5 13 162 NA Tiger Resources 0.062 ▼ (2%) (52%) 71 80 220 NA CST Mining 0.047 ▲ 2% 7% 1,274 136 178 0.4x MMG 2.18 ▼ (2%) (9%) 11,531 251 83,367 14.3x China Molybdenum 4.92 ▼ (3%) 9% 67,848 1,883 71,897 NA
- 4. Oz Metals 21st Edition – 15th Mar 2015 DISCLAIMER This report is provided in good faith from sources believed to be accurate and reliable. Terra Studio Pty Ltd directors and employees do not accept liability for the results of any action taken on the basis of the information provided or for any errors or omissions contained therein. Readers should seek investment advice from their professional advisors before acting upon information contained herein. Page 4 / 4 TerraStudio Gold Producers Source: SNL Gold Developers & Explorers Source: SNL, Terra Studio Zinc & Poly-metallic Sector Source: SNL For further information, please contact: J-François Bertincourt m +61 406 998 779 jf@terrastudio.biz au.linkedin.com/in/jfbertincourt Code Company Name Close Price Week Δ YTD Δ 52 Week Range Market Cap (A$m) Cash (A$m) TEV (A$m) TEV/ EBITDA AGD Austral Gold 0.13 ▲ 8% 0% 62 NA 54 NA ALK Alkane Resources 0.33 ▼ (11%) 50% 137 16 118 NA AMI Aurelia Metals 0.27 ▼ (2%) 10% 103 22 204 NA BDR Beadell Resources 0.25 ▼ (13%) 9% 196 13 301 4.6x DRM Doray Minerals 0.45 ▼ (6%) (6%) 106 16 105 NA EVN Evolution Mining 0.79 ▼ (9%) 22% 565 32 695 3.4x IGO Independence Group 5.39 ▼ (1%) 22% 1,263 57 1,171 NA KCN Kingsgate Consolidated 0.65 ▼ (16%) (2%) 144 54 228 NA KRM Kingsrose Mining 0.24 — 0% (6%) 86 7 97 NA LSA Lachlan Star 0.024 — 0% 20% 4 2 22 NA MIZ Minera Gold 0.002 ▼ (25%) (50%) 4 0 9 NA MLX Metals X 1.18 ▼ (6%) 50% 491 57 384 NA MML Medusa Mining 0.80 ▼ (19%) 23% 166 13 159 NA MOY Millennium Minerals 0.039 ▲ 5% 5% 8 2 47 NA NCM Newcrest Mining 12.43 ▼ (6%) 14% 9,526 141 13,943 NA NGF Norton Gold Fields 0.20 ▼ (3%) 56% 182 19 309 4.8x NST Northern Star Resources 2.19 ▼ (0%) 47% 1,297 82 1,269 6.3x OGC OceanaGold Corp. 2.17 ▼ (2%) 7% 653 NA 739 2.4x PGI PanTerra Gold 0.145 ▼ (12%) (19%) 12 3 75 NM PRU Perseus Mining 0.26 ▼ (26%) (2%) 134 37 100 1.7x RMS Ramelius Resources 0.100 ▼ (9%) 96% 47 12 30 NA RRL Regis Resources 1.29 ▼ (8%) (33%) 642 7 652 NA RSG Resolute Mining 0.25 ▼ (24%) (6%) 160 19 191 NA SAR Saracen Mineral Holdings 0.37 ▼ (15%) 45% 293 36 274 NA SBM St Barbara 0.19 ▼ (12%) 81% 94 79 417 NA SLR Silver Lake Resources 0.16 ▼ (18%) (18%) 81 24 87 NA TBR Tribune Resources 3.25 ▲ 2% 23% 163 11 177 10.3x TRY Troy Resources 0.43 ▼ (20%) (7%) 84 43 124 NA UML Unity Mining 0.007 ▼ (22%) 0% 8 7 (4) NA Code Company Name Close Price Week Δ YTD Δ 52 Week Range Market Cap (A$m) Cash (A$m) TEV (A$m) AYC A1 Consolidated 0.031 ▼ (6%) (23%) 9 0 8 ABU ABM Resources 0.23 ▲ 2% (20%) 64 11 53 AWV Anova Metals 0.045 ▼ (12%) 67% 13 1 12 AZM Azumah Resources 0.027 ▼ (4%) 35% 11 4 9 BLK Blackham Resources 0.115 ▼ (8%) 125% 20 3 17 BOK Black Oak Minerals 0.40 ▲ 4% 46% 17 11 31 BSR Bassari Resources 0.016 ▲ 23% 33% 19 - 19 CHN Chalice Gold Mines 0.12 ▼ (12%) 10% 33 43 (10) CHZ Chesser Resources 0.03 ▲ 3% (6%) 8 1 3 DCN Dacian Gold 0.44 ▼ (10%) 57% 42 8 35 EXC Exterra Resources 0.013 ▲ 8% 0% 2 1 2 EXG Excelsior Gold 0.098 ▼ (2%) 61% 46 2 45 FML Focus Minerals 0.008 — 0% 14% 73 81 73 GCY Gascoyne Resources 0.095 ▼ (5%) 34% 16 1 15 GMR Golden Rim Resources 0.008 ▼ (11%) 60% 10 1 10 GOR Gold Road Resources 0.33 ▼ (3%) 33% 193 21 172 GRY Gryphon Minerals 0.060 ▼ (14%) (6%) 24 34 0 IDC Indochine Mining 0.007 ▼ (13%) (42%) 10 0 11 KGD Kula Gold 0.049 ▼ (18%) 11% 13 3 13 MSR Manas Resources 0.020 — 0% 43% 9 6 7 MUX Mungana Goldmines 0.10 ▼ (17%) (20%) 24 5 29 MYG Mutiny Gold 0.046 — 0% 5% 32 3 29 OGX Orinoco Gold 0.070 ▼ (5%) 19% 10 1 9 PNR Pacific Niugini 0.060 ▼ (5%) 20% 24 1 23 PXG Phoenix Gold 0.095 ▼ (5%) (3%) 40 6 34 RED Red 5 0.110 ▼ (8%) 20% 84 38 66 RNI Resource & Investment 0.062 ▲ 3% (17%) 31 5 48 RNS Renaissance Minerals 0.048 ▼ (8%) (26%) 19 4 15 SAU Southern Gold 0.012 — 0% 50% 5 1 4 SIH Sihayo Gold 0.011 — 0% 38% 12 0 9 TAM Tanami Gold 0.023 ▼ (18%) 64% 27 1 37 WAF West African Resources 0.082 — 0% (18%) 22 3 22 WPG WPG Resources 0.036 ▼ (12%) (5%) 9 3 6 Code Company Name Close Price Week Δ YTD Δ 52 Week Range Market Cap (A$m) Cash (A$m) TEV (A$m) AQR Aeon Metals 0.085 ▼ (1%) (15%) 26 5 33 DGR DGR Global 0.038 ▼ (5%) 19% 16 0 17 HRR Heron Resources 0.13 ▼ (7%) 4% 47 28 22 IBG Ironbark Zinc 0.095 ▲ 1% 19% 42 3 39 IPT Impact Minerals 0.018 — 0% (25%) 10 1 8 IVR Investigator Resources 0.014 — 0% (13%) 6 3 2 MRP MacPhersons Resources 0.115 ▼ (8%) (8%) 36 5 31 PNX Phoenix Copper 0.017 ▼ (11%) (43%) 6 3 3 RDM Red Metal 0.042 ▼ (7%) (48%) 7 8 (1) RVR Red River Resources 0.13 ▼ (4%) 18% 23 4 19 RXL Rox Resources 0.024 ▼ (4%) (14%) 20 3 17 TZN Terramin Australia 0.125 ▼ (4%) 14% 189 1 188 VXR Venturex Resources 0.005 — 0% 0% 8 1 6