Lincoln crowne copper gold weekly report 29072013
•
1 like•219 views

Lincoln Crowne & Company Weekly report on the Australian Copper & Gold Sectors - dated 29 July 2013. Continuing soft conditions on the AUD providing ongoing support for Aussie gold producers

Recommended
Recommended
More Related Content
What's hot
What's hot (20)
Viewers also liked
Viewers also liked (11)
Similar to Lincoln crowne copper gold weekly report 29072013
Similar to Lincoln crowne copper gold weekly report 29072013 (20)
More from Lincoln Crowne & Company
More from Lincoln Crowne & Company (20)
Recently uploaded
Recently uploaded (20)
Lincoln crowne copper gold weekly report 29072013
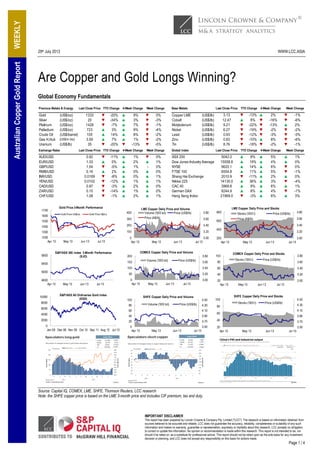
- 1. 29th July 2013 WWW.LCC.ASIA IMPORTANT DISCLAIMER This report has been prepared by Lincoln Crowne & Company Pty. Limited ("LCC"). The research is based on information obtained from sources believed to be accurate and reliable. LCC does not guarantee the accuracy, reliability, completeness or suitability of any such information and makes no warranty, guarantee or representation, expressly or impliedly about this research. LCC accepts no obligation to correct or update the information. No opinion or recommendation is made within this research. This report is not intended to be, nor should it be relied on, as a substitute for professional advice. This report should not be relied upon as the sole basis for any investment decision or planning, and LCC does not accept any responsibility on this basis for actions made. Page 1 / 4 WEEKLYAustralianCopperGoldReport Are Copper and Gold Longs Winning? Global Economy Fundamentals Source: Capital IQ, COMEX, LME, SHFE, Thomson Reuters, LCC research Note: the SHFE copper price is based on the LME 3-month price and includes CIF premium, tax and duty. Precious Metals & Energy Last Close Price YTD Change 4-Week Change Week Change Base Metals Last Close Price YTD Change 4-Week Change Week Change Gold (US$/oz) 1333 ▼ -20% ▲ 9% ▼ 0% Copper LME (US$/lb) 3.13 ▼ -13% ▲ 2% ▼ -1% Silver (US$/oz) 20 ▼ -34% ▲ 3% ▼ -3% Cobalt (US$/lb) 12.47 ▲ 8% ▼ -16% ▼ -6% Platinum (US$/oz) 1428 ▼ -7% ▲ 7% ▼ -1% Molybdenum (US$/lb) 9.21 ▼ -22% ▼ -13% ▲ 2% Palladium (US$/oz) 723 ▲ 3% ▲ 9% ▼ -4% Nickel (US$/lb) 6.27 ▼ -19% ▼ -2% ▼ -2% Crude Oil (US$/barrel) 105 ▲ 14% ▲ 8% ▼ -2% Lead (US$/lb) 0.93 ▼ -12% ▼ -3% ▼ -3% Gas H.Hub (US$/m btu) 3.59 ▲ 7% ▲ 1% ▼ -2% Zinc (US$/lb) 0.83 ▼ -10% ▲ 8% ▼ -6% Uranium (US$/lb) 35 ▼ -20% ▼ -13% ▼ -5% Tin (US$/lb) 8.76 ▼ -18% ▼ -2% ▼ -1% Exchange Rates Last Close Price YTD Change 4-Week Change Week Change Global Index Last Close Price YTD Change 4-Week Change Week Change AUD/USD 0.92 ▼ -11% ▲ 1% ▼ 0% ASX 200 5042.0 ▲ 8% ▲ 5% ▲ 1% EUR/USD 1.33 ▲ 0% ▲ 2% ▲ 1% Dow Jones Industry Average 15558.8 ▲ 19% ▲ 4% ▲ 0% GBP/USD 1.54 ▼ -5% ▲ 1% - 0% NYSE 9620.1 ▲ 14% ▲ 6% ▼ 0% RMB/USD 0.16 ▲ 2% ▲ 0% ▲ 0% FTSE 100 6554.8 ▲ 11% ▲ 5% ▼ -1% INR/USD 0.0169 ▼ -8% ▲ 0% ▲ 1% Shang Hai Exchange 2010.9 ▼ -11% ▲ 2% ▲ 0% YEN/USD 0.0102 ▼ -12% ▲ 1% ▲ 1% Nikkei 225 14130.0 ▲ 36% ▲ 3% ▼ -4% CAD/USD 0.97 ▼ -3% ▲ 2% ▲ 0% CAC 40 3968.8 ▲ 9% ▲ 6% ▲ 1% ZAR/USD 0.10 ▼ -14% ▲ 1% ▲ 0% German DAX 8244.9 ▲ 8% ▲ 4% ▼ -1% CHF/USD 1.08 ▼ -1% ▲ 2% ▲ 1% Hang Seng Index 21969.0 ▼ -3% ▲ 6% ▲ 3% 4600 5000 5400 5800 Apr 13 May 13 Jun 13 Jul 13 S&P/ASX 300 Index 3-Month Performance (XJO) 3.50 3.70 3.90 4.10 4.30 4.50 20 40 60 80 100 Apr 13 May 13 Jun 13 Jul 13 SHFE Copper Daily Price and Stocks Stocks ('000 t) Price (US$/lb) 1200 1300 1400 1500 1600 1700 Apr 13 May 13 Jun 13 Jul 13 Gold Price 3-Month Performance Gold Price US$/oz Gold Price A$/oz 3.00 3.20 3.40 3.60 3.80 200 400 600 800 Apr 13 May 13 Jun 13 Jul 13 LME Copper Daily Price and Stocks Stocks ('000 t) Price (US$/lb) Price (A$/lb) 3.00 3.20 3.40 3.60 3.80 0 50 100 150 200 Apr 13 May 13 Jun 13 Jul 13 COMEX Copper Daily Price and Volume Volume ('000 lot) Price (US$/lb) 3.50 3.70 3.90 4.10 4.30 4.50 0 20 40 60 80 100 Apr 13 May 13 Jun 13 Jul 13 SHFE Copper Daily Price and Volume Volume ('000 lot) Price (US$/lb) 20 40 60 80 100 Apr 13 May 13 Jun 13 Jul 13 3.00 3.20 3.40 3.60 3.80 COMEX Copper Daily Price and Stocks Stocks ('000 t) Price (US$/lb) 0 2000 4000 6000 8000 10000 Jan 08 Dec 08 Nov 09 Oct 10 Sep 11 Aug 12 Jul 13 S&P/ASX All Ordinaries Gold Index (XGD) 3.00 3.20 3.40 3.60 3.80 0 100 200 300 400 Apr 13 May 13 Jun 13 Jul 13 LME Copper Daily Price and Volume Volume ('000 lot) Price (US$/lb) Price (A$/lb)
- 2. 29th July 2013 WWW.LCC.ASIA IMPORTANT DISCLAIMER This report has been prepared by Lincoln Crowne & Company Pty. Limited ("LCC"). The research is based on information obtained from sources believed to be accurate and reliable. LCC does not guarantee the accuracy, reliability, completeness or suitability of any such information and makes no warranty, guarantee or representation, expressly or impliedly about this research. LCC accepts no obligation to correct or update the information. No opinion or recommendation is made within this research. This report is not intended to be, nor should it be relied on, as a substitute for professional advice. This report should not be relied upon as the sole basis for any investment decision or planning, and LCC does not accept any responsibility on this basis for actions made. Page 2 / 4 WEEKLYAustralianCopperGoldReport Markets Despite the gold ETF sales, the net position of managed money in gold futures and options has increased over the last few weeks. For copper, the overall net short position is rapidly losing significance. Despite receiving some relief from weaker currencies in Australia and South Africa, miners are slashing costs, placing assets for sale and slowing new projects to appease investors. Moderating Chinese demand triggered US$33 billion in write-downs in the past year and sparked management sweep-outs. Highlights from a strategic metals report on copper include: capital costs increased by an average 15% per year over the past 20 years; cash operating costs tripled over the past ten years to an average of almost US$1.50/lb in 2012; despite discovering 100 copper deposits between 1998 and 2012, with almost 396 million tonnes of copper metal, mining companies have only converted one-tenth of these deposits into reserves. The Reserve Bank of India has added new restrictions on gold imports in an attempt to curb demand for the metal and reduce the country’s account deficit. The country’s current account deficit is nearly 5% and gold is a major driver behind that figure, second only to oil. Indian banks will now be required to set aside 20% of all imported gold for export purposes. According to the World Gold Council, China is set to become the world’s top gold consumer, with demand expected to reach 1,000 tonnes. This compares with India’s average yearly imports of 963 tonnes. The major drivers are investment and jewellery. Opposition Energy and Resources spokesman Ian Macfarlane has confirmed the Coalition will scrap the Minerals Resource Rent Tax if it wins the federal election. The Western Australian Chamber of Mines and Energy reported a 22% drop in total exploration spending over the June quarter to A$1.1 billion. It represented the third consecutive quarter of declines for mineral exploration, and a 14% decline yoy. Unemployment and underemployment among Australian geoscientists has reached its worst level since the global financial crisis, according to the Australian Institute of Geoscientists. The AIG said unemployment and underemployment in the sector rose 19.2% over the June quarter to 22% due to an ongoing jobs bite in exploration and mining. AIG indicated the results demonstrate a continuing trend that first became evident in September 2011 and began to accelerate in June 2012 as exploration and mining for both mineral and energy resources in Australia began to decline. Australian resources and mining professionals earn the second-highest wages globally, according to a recruitment researcher survey. Norway was found to pay the highest resources wages with an average base salary of US$158,700 followed by Australia (US$137,100), Canada (US$101,800), Germany (US$99,100) and the United States (US$96,900). Copper Producers Source: Capital IQ, ASX announcements, LCC research. C1 and C3 costs as reported in last quarter, except for TGS, LCC estimate. Ticker Company Name Open Price Close Price High Price Low Price Weekly Change Market Cap (A$m) 52 Week Range Cash (A$m) EV (A$m) EV/EBITDA Ore Reserve (mt Cu) EV/Ore Reserve (US¢/lb) Project C1 Costs (US$/lb) C3 Costs (US$/lb) ABY Aditya Birla Minerals 0.39 0.39 0.40 0.39 -- 0.0% 122 100 23 0.5x 0.473 2 Nifty 2.32 N/A AOH Altona Mining 0.14 0.17 0.17 0.14 ▲ 17.9% 87 23 87 NM 0.061 58 Kylylahti 1.30 2.31 DML Discovery Metals 0.17 0.17 0.18 0.16 -- 0.0% 83 21 215 NM 0.191 46 Boseto 3.45 N/A HGO Hillgrove Resources 0.07 0.07 0.08 0.06 -- 0.0% 71 17 104 4.9x 0.125 34 Kanmantoo 3.15 4.42 IVA Inova Resources 0.18 0.18 0.19 0.17 ▼ -2.8% 127 38 90 NM 0.080 46 Osborne 2.85 4.27 OZL OZ Minerals 4.23 4.13 4.67 4.06 ▼ -2.4% 1252 659 593 1.9x 0.748 32 Prominent Hill 1.95 3.56 PNA PanAust 1.89 2.11 2.18 1.84 ▲ 11.6% 1280 74 1352 4.4x 1.127 49 Phu Kham 1.45 2.12 SFR Sandfire Resources 5.67 5.64 5.83 5.46 ▼ -0.5% 878 77 1086 6.6x 0.438 101 DeGrussa 1.37 2.21 SRQ Straits Resources 0.01 0.01 0.01 0.01 -- 0.0% 14 57 65 5.0x 0.178 15 Tritton 2.13 2.20 TGS Tiger Resources 0.21 0.21 0.22 0.20 -- 0.0% 142 19 129 3.3x 0.303 17 Kipoi 1.07 1.35
- 3. 29th July 2013 WWW.LCC.ASIA IMPORTANT DISCLAIMER This report has been prepared by Lincoln Crowne & Company Pty. Limited ("LCC"). The research is based on information obtained from sources believed to be accurate and reliable. LCC does not guarantee the accuracy, reliability, completeness or suitability of any such information and makes no warranty, guarantee or representation, expressly or impliedly about this research. LCC accepts no obligation to correct or update the information. No opinion or recommendation is made within this research. This report is not intended to be, nor should it be relied on, as a substitute for professional advice. This report should not be relied upon as the sole basis for any investment decision or planning, and LCC does not accept any responsibility on this basis for actions made. Page 3 / 4 WEEKLYAustralianCopperGoldReport Emerging Copper Companies Source: Capital IQ, ASX announcements, LCC research. C1 costs and capex as estimated and announced by the respective companies. ASX Company News OZ Minerals (ASX: OZL) production decreased to 17,379 tonnes of copper (-15% qoq) and 31,018 oz of gold (-2% qoq) for the June quarter due to lower head grade of 0.84% Cu (-15% qoq). C1 and C3 costs increased respectively to US$1.95/lb Cu (+5% qoq) and US$3.56/lb Cu (+10% qoq). PanAust (ASX: PNA) production increased to 15,483 tonnes of copper (+13% qoq) for the June quarter due to higher head grade of 0.51% (+11%). C1 and C3 costs increased to US$1.45/lb Cu (+5% qoq) and US$2.12/lb Cu (+10% qoq). Ban Houayxai produced 28,712 oz of gold at C1 costs at US$603/oz and total costs of only US$757/oz (11% and 26% reduction respectively on March quarter performance). Norton Gold Fields (ASX: NGF) gold production for the June quarter was slightly lower at 41,464 oz, at C1 costs of A$1,029/oz. This was a slight improvement on the March quarter, where the company recorded C1 costs of A$1,033/oz but produced 44,053 oz. Oceana Gold Corporation (ASX: OGC) reported total gold production of 68,353 oz at cash costs of US$682/oz. At Didipio, cash costs on a by-product basis were negative (US$586/oz) on gold sales of 11,086 oz and copper sales of 5,073 tonnes. In New Zealand, cash costs were US$918/oz on gold sales of 59,620 oz. Perseus Mining (ASX: PRU) produced 47,565 oz (-17% qoq) for the June quarter at cash costs of US$1,181/oz and all-in site costs of US$1,405/oz. Reed Resources (ASX: RDR) produced 12,918 oz (+42% qoq) at cash costs of A$1,642/oz (-5% qoq). RDR has repaid Credit Suisse all amounts owing under the A$19 million debt facility established in November 2012 and Credit Suisse has released its security over the Reed group. RDR also realised $27m on closure of its hedge book. Cash as of 30 June 2013 totalled A$19 million. Saracen Mineral Holdings (ASX: SAR) produced record production of 37,259 oz (+2% qoq) at cash costs of A$824/oz (-15% qoq). Mark to market value of the hedging is A$45.8 million (net of costs) assuming a spot price of A$1,351/oz. Cash and gold holdings at quarter end totaled A$21 million. St Barbara (ASX: SBM) increased gold production by 24% qoq to 107,363 oz at cash costs of A$958/oz (-1% qoq). At 30 June 2013, SBM had A$129 million cash at bank and A$325 million of interest bearing liabilities. Havilah Resources (ASX: HAV) shareholders will meet on August 28 to vote on the removal of one of its existing directors and installing three others. Shareholders Rockland Pty Ltd (Peter Laurance) and Gregorach Pty Ltd (Warwick Grigor) hold a 5.88% stake in Havilah and have called for a general meeting of shareholders to remove current executive director Christopher Giles and elect Ross Fardon, Peter Reeve and Ian Lawrence as directors. Mr Johnson, Executive Chairman and directors Christopher Giles and Kenneth Williams have informed shareholders they oppose all the resolutions. Ticker Company Name Open Price Close Price High Price Low Price Market Cap (A$m) 52 Week Range Cash (A$m) EV (A$m) Mineral Resource (mt Cu) EV/Mineral Resource (US¢/lb) Project C1 Costs (US$/lb) Capex (US$m) AVI Avalon Minerals 0.02 0.02 0.02 0.00 ▲ 13.3% 10 2 2 0.610 0.1 Viscaria 0.65 130 AVB Avanco Resources 0.07 0.09 0.09 0.07 ▲ 18.1% 95 7 53 0.762 2.8 Antas/Pedra Blanca 1.10 50 BTR Blackthorn Resources 0.29 0.29 0.32 0.26 -- 0.0% 48 29 19 1.000 0.8 Mumbwa 1.49 377 FND Finders Resources 0.24 0.24 0.25 0.23 -- 0.0% 101 3 99 0.205 20 Wetar 1.07 167 HAV Havilah Resources 0.30 0.30 0.31 0.30 -- 0.0% 36 7 23 0.623 1.5 Kalkaroo N/A 80 HCH Hot Chili 0.40 0.44 0.45 0.40 ▲ 10.0% 133 25 117 0.920 5.2 Productora 1.35 600 MMC Marengo Mining 0.02 0.02 0.03 0.02 ▲ 4.5% 26 6 77 0.806 3.9 Yandera n/a 1800 MNC Metminco 0.02 0.02 0.02 0.02 -- 0.0% 30 15 15 6.538 0.1 Los Calatos 1.09 1500 RXM Rex Minerals 0.53 0.59 0.65 0.53 ▲ 11.3% 111 34 26 2.000 0.5 Hillside 1.20 900 ROL Robust Resources 0.22 0.25 0.26 0.21 ▲ 14.0% 26 23 -2 0.077 -1.2 Andash N/A 96 YTC YTC Resources 0.19 0.18 0.20 0.18 ▼ -5.3% 47 16 48 0.091 22 Nymagee N/A N/A Weekly Change
- 4. 29th July 2013 WWW.LCC.ASIA IMPORTANT DISCLAIMER This report has been prepared by Lincoln Crowne & Company Pty. Limited ("LCC"). The research is based on information obtained from sources believed to be accurate and reliable. LCC does not guarantee the accuracy, reliability, completeness or suitability of any such information and makes no warranty, guarantee or representation, expressly or impliedly about this research. LCC accepts no obligation to correct or update the information. No opinion or recommendation is made within this research. This report is not intended to be, nor should it be relied on, as a substitute for professional advice. This report should not be relied upon as the sole basis for any investment decision or planning, and LCC does not accept any responsibility on this basis for actions made. Page 4 / 4 WEEKLYAustralianCopperGoldReport Emerging Gold Companies Source: Capital IQ, LCC research. C1 costs and capex as estimated and announced by the respective companies. Note: * Expenditure cost in A$ converted to US$ using an exchange rate of 0.90. Mergers & Acquisitions Chinese government-backed mining house MMG (HKEx: 1208) says it continues to enjoy a mandate to acquire assets in the resources sector, with recent weakness across the industry opening up opportunities priced “closer to the bottom of the market.” Norton Gold Fields (ASX: NGF) has declared its takeover offer for Kalgoorlie Mining Company unconditional, with the company receiving acceptances representing 84.85% of the company’s shares and 55.05% of KMC’s listed options. The KMC board has unanimously recommended that remaining security holders accept Norton’s offer without delay in the absence of a superior proposal. Gold Producers Source: Capital IQ, Goldnerds, LCC research. Assumption: A$/US$ exchange rate of 0.90. Note: * These stocks are not primarily listed on the ASX. Prices, market cap and multiples are based on their primarily listed market quote. Ticker Company Name Open Price Close Price High Price Low Price Weekly Change Market Cap (A$m) 52 Week Range Cash (A$m) EV (A$m) Reserves (moz) EV/Reserves (US$/oz) Project Name C1 Costs (US$/oz) Capex (US$m) AZM Azumah Resources 0.03 0.04 0.04 0.03 ▲ 12.5% 12 3 9 0.4 19 Wa 700 144 BAB Bullabulling Gold 0.03 0.04 0.04 0.03 ▲ 12.1% 13 2 2 2.4 1 Bullabulling 843 294* CAS Crusader Resources 0.26 0.22 0.26 0.22 ▼ -13.7% 28 1 27 1.6 15 Borborema 558 169 DRM Doray Minerals 0.58 0.61 0.64 0.58 ▲ 6.1% 87 32 55 0.3 197 Andy Well 592 53* GRY Gryphon Minerals 0.15 0.20 0.20 0.15 ▲ 33.3% 80 54 26 1.1 22 Banfora 774 208 IDC Indochine Mining 0.05 0.06 0.07 0.05 ▲ 7.7% 47 4 44 1.1 36 Mt Kare 800 218 KGD Kula Gold 0.08 0.09 0.09 0.08 ▲ 11.1% 11 5 6 0.8 7 Woodlark Island 730 160 MDI Middle Island Resources 0.11 0.15 0.15 0.11 ▲ 38% 18 6 12 0.3 35 Samira Hill N/A 1.3 MUM Mount Magnet South 0.01 0.01 0.01 0.01 -- 0.0% 7 2 5 0.3 17 Kirkalocka 1142 33* PGI PanTerra Gold 0.10 0.10 0.11 0.09 ▲ 5.3% 76 2 74 0.6 106 Las Lagunas 307 83 PIR Papillon Resources 1.03 1.15 1.20 1.03 ▲ 11.2% 386 62 325 3.0 97 Fekola 580 292 PVM PMI Gold 0.36 0.40 0.42 0.35 ▲ 12.4% 165 117 49 2.3 19 Obotan 626 297 PXG Phoenix Gold 0.18 0.19 0.19 0.18 ▲ 8.6% 46 16 30 0.7 38 Castle Hill 756 118* Ticker Company Name Open Price Close Price High Price Low Price Weekly Change Market Cap (A$m) 52 Week Range Cash (A$m) Debt (A$m) EV (A$m) EV/EBITDA Ore Reserve (moz) EV/Reserve (US$/oz) C1 Costs (US$/oz) C3 Costs (US$/oz) ANG* AngloGold Ashanti 14.54 14.53 16.09 14.43 ▼ -0.1% 5582 612 3368 8338 4.3x 74.1 101 910 1147 ASR* Alacer Gold Corp 2.64 2.70 2.99 2.55 ▲ 2.2% 775 245 63 593 2.3x 5.0 107 932 N/A BEZ* Besra Gold 0.06 0.06 0.06 0.05 ▲ 0.6% 22 4 43 61 2.6x 0.1 532 793 1330 CCU Cobar Consolidated Resources 0.16 0.18 0.21 0.16 ▲ 12.5% 59 3 18 74 N/M 0.4 169 N/A N/A EVN Evolution Mining 0.74 0.84 0.88 0.74 ▲ 13.6% 591 7 107 691 2.3x 3.1 197 826 1284 EDV* Endeavour Mining Corp 0.62 0.76 0.85 0.61 ▲ 22.8% 313 82 195 426 3.6x 2.5 154 809 975 FML Focus Minerals 0.01 0.01 0.01 0.01 -- 0.0% 119 114 11 16 N/M 0.5 27 1709 1765 GDO Gold One International 0.15 0.22 0.23 0.15 ▲ 46.7% 313 37 70 346 11.1x 2.7 116 1047 1246 KCN Kingsgate Consolidated 1.70 1.71 1.88 1.66 ▲ 0.6% 259 42 173 391 2.7x 2.6 133 1051 N/A KRM Kingsrose Mining 0.45 0.40 0.46 0.39 ▼ -10.1% 134 1 6 139 5.8x 0.0 NM 6445 N/A LSA Lachlan Star 0.29 0.25 0.29 0.25 ▼ -13.8% 25 3 26 48 N/M 0.1 316 1239 N/A MML Medusa Mining 1.93 2.21 2.54 1.93 ▲ 14.5% 417 9 0 409 6.6x 0.6 647 296 N/A MOY Millennium Minerals 0.35 0.40 0.42 0.33 ▲ 13.6% 795 5 54 845 N/M 0.7 1125 685 844 NCM Newcrest Mining 11.55 12.41 13.05 11.50 ▲ 7.4% 9509 97 3203 12615 7.0x 87.3 130 675 936 NGF Norton Gold Fields 0.13 0.15 0.15 0.13 ▲ 16.0% 125 56 45 114 4.6x 1.1 91 926 1181 NST Northern Star Resources 0.79 0.87 0.90 0.79 ▲ 9.5% 367 58 12 321 5.7x 0.3 1123 581 780 OGC* OceanaGold Corporation 1.69 1.78 1.87 1.67 ▲ 5.0% 522 18 216 719 2.9x 3.6 178 682 1000 PRU Perseus Mining 0.59 0.59 0.69 0.56 ▼ -0.8% 268 35 0 233 2.0x 4.0 52 1181 1405 RDR Reed Resources 0.04 0.06 0.06 0.04 ▲ 36.4% 31 19 0 12 2.4x 0.8 15 1642 1700 RED Red 5 - - - - -- - 168 12 23 180 N/M 0.7 229 973 1333 RMS Ramelius Resources 0.14 0.16 0.18 0.14 ▲ 10.7% 52 43 4 13 0.4x 0.6 21 968 N/A RRL Regis Resources 3.49 3.41 3.69 3.38 ▼ -2.3% 1690 8 0 1682 10.3x 3.1 490 524 N/A RSG Resolute Mining 0.74 0.83 0.86 0.73 ▲ 11.5% 548 177 69 440 1.9x 4.4 89 747 963 SAR Saracen Mineral Holdings 0.13 0.16 0.17 0.12 ▲ 24.0% 92 21 22 93 2.3x 1.1 76 742 1087 SBM St Barbara 0.68 0.53 0.71 0.51 ▼ -22.2% 256 129 325 452 1.8x 5.7 72 862 N/A SLR Silver Lake Resources 0.77 0.79 0.89 0.76 ▲ 2.6% 299 11 14 302 4.8x 1.8 152 657 1199 TAM Tanami Gold 0.06 0.06 0.07 0.06 ▼ -1.6% 36 10 44 70 35.9x 0.4 157 1750 1793 TBR Tribune Resources 1.85 1.82 1.90 1.60 ▼ -1.6% 91 14 14 91 1.8x 0.2 358 401 N/A TGZ* Teranga Gold Corp 0.67 0.68 0.72 0.66 ▲ 2.2% 168 51 79 196 0.8x 1.7 107 535 N/A TRY Troy Resources 1.49 1.49 1.60 1.40 -- 0.0% 245 41 0 204 2.2x 0.6 295 804 N/A UML Unity Mining 0.07 0.07 0.08 0.06 ▲ 7.5% 51 28 0 23 1.7x 0.4 57 881 N/A