SlideShare a Scribd company logo
1 of 4
Download to read offline
Oz Metals
26th
Edition – 19th
Apr 2015
DISCLAIMER
This report is provided in good faith from sources believed to be accurate and reliable. Terra Studio Pty Ltd directors and employees do not accept liability
for the results of any action taken on the basis of the information provided or for any errors or omissions contained therein. Readers should seek
investment advice from their professional advisors before acting upon information contained herein.
Page 1 / 4
TerraStudio
COPPER AT THE CENTRE OF THE NEW METAL AGE
Base Metals & Precious Metals Fundamentals
Sources: COMEX, LME, RBA, SHFE
$50
$55
$60
$65
$70
$75
$80
Apr-14 Jul-14 Oct-14 Jan-15
CIFPriceofChineseImports
Bauxite
US$/t
$A/t
$2.0
$2.3
$2.6
$2.9
$3.2
$3.5
$3.8
$4.1
0
100
200
300
400
500
600
700
Apr-14 Jul-14 Oct-14 Jan-15 Apr-15
ThousandTonnes
Copper
SHFE COMEX LME
US$/lb A$/lb
$1,100
$1,200
$1,300
$1,400
$1,500
$1,600
$1,700
Apr-14 Jul-14 Oct-14 Jan-15 Apr-15
Gold
A$/oz
US$/oz
$5
$6
$7
$8
$9
$10
$11
0
100
200
300
400
500
600
Apr-14 Jul-14 Oct-14 Jan-15 Apr-15
$/lb
ThousandTonnes
Nickel
LME US$ A$
$0.25
$0.50
$0.75
$1.00
$1.25
$1.50
0
100
200
300
400
500
Apr-14 Jul-14 Oct-14 Jan-15 Apr-15
$/lb
ThousandTonnes
Lead
SHFE LME US$ A$
$0.80
$0.90
$1.00
$1.10
$1.20
$1.30
$1.40
0
200
400
600
800
1,000
1,200
Apr-14 Jul-14 Oct-14 Jan-15 Apr-15
$/lb
ThousandTonnes
Zinc
SHFE LME US$ A$
Oz Metals
26th
Edition – 19th
Apr 2015
DISCLAIMER
This report is provided in good faith from sources believed to be accurate and reliable. Terra Studio Pty Ltd directors and employees do not accept liability
for the results of any action taken on the basis of the information provided or for any errors or omissions contained therein. Readers should seek
investment advice from their professional advisors before acting upon information contained herein.
Page 2 / 4
TerraStudio
Markets & Majors
Reuters - The Singapore trading hubs of the world's largest
commodity companies are coming under scrutiny from the
governments of some resource-producing countries who
say they suspect they are using units in the Southeast Asian
financial centre to avoid tax. Some of the world's largest oil,
mining and soft commodity companies book billions of
dollars of revenue in the tiny island state every year, where
tax rates can be very low, which is perfectly legal unless
they deliberately under-price group transactions so as to
shift profit there from units in other countries.
The Australian - A report commissioned by the University of
Western Australia claims that the mining slump offers a
once-in-a-lifetime chance for the Australian state to exploit
its huge recent influx of global professionals by transforming
into a regional hub for innovation.
SNL - Every A$1 million invested in the Western Australia's
Exploration Incentive Scheme stimulates exploration activity
which generates A$10.3 million in benefits for the state,
according to a study conducted by ACIL Allen Consulting for
the Department of Mines and Petroleum.
Australian Mining - Mining lobbyist Terry Burgess said South
Australia will have the potential to build state mining
revenues to A$7 billion per annum, but also believes that
the Australian state has its work cut out to prepare for the
market upswing.
According to The Australian Financial Review, fund
managers with large interests in Australian resource
companies are not adding more funds to the sector, with
Pengana Capital and Fidelity as examples. The two firms
are using a "wait-and-see” approach after Australian
Treasurer Joe Hockey's comments that iron ore prices could
fall as low as US$35/t and a warning from Standard &
Poor's Ratings Services.
SMM - Will Chinese government introduce more stimulus
measures following the better-than-expected economic
reports? Will copper prices take impetus to extend rebound?
“The PPI, though falling more slowly, remained weak,
reflecting the real economy has not yet recovered,” an
analyst from Dayou Futures told SMM, ”this means more
easing policies are still needed to bring funds into real
economy, that plus the growing long positions in copper,
may herald further rally in copper prices.” Analyst from
Shanghai CIFCO Futures also expected continued rise in
copper prices, citing the arrival of peak demand season and
disrupted production at large copper mines. But the analyst
says the rebound may be limited.
Reuters – Nearly a quarter of the world’s major copper
mines are running in the red, even after producers including
Codelco and BHP Billiton engage in the deepest cost-cutting
in years, according to a Reuters analysis. A 17% slump
since last July has pushed copper futures on the LME to
under $6,000/t ($2.72/lb), the lowest since 2009, is the first
major test of producers’ margins, since the global economic
crisis, forcing a new reckoning after five years of relatively
consistent profitability.
Antofagasta CEO Diego Hernandez warned that Chile's
copper industry may not remain competitive due to tapped
out resources at mining projects and rising labour costs,
London's Financial Times reported. Since 2004, Chile's
investments in mining were about the same as the
preceding decade, yet production has hardly registered any
increases. Output between 1990 and 2004 jumped 9.2%
annually while productivity nearly doubled. Separately,
Hernandez told Metal Bulletin that forecasts of a copper
surplus fell significantly in the past few months owing to
several issues with existing and upcoming projects. The
company initially estimated a copper surplus of 400,000
tonnes for 2015 in November 2014, which was reduced to
200,000 tonnes in February this year. Antofagasta now
anticipates an even lower 2015 copper surplus of 100,000
tonnes. The CEO added that opportunities for M&A activity
in the copper sector are more limited than other
commodities while current prices make greenfield
expansions less attractive. According to Metal Bulletin,
Hernandez noted that "copper is still the best commodity to
be in and the companies that own copper assets don't want
to dispose of them."
Metal Bulletin - Jean-Sébastien Jacques, CEO of Rio Tinto’s
copper division, said the world is on the threshold of a new
metal age and copper is at the centre.
mining.com - Chilean copper giant Codelco is fine-tuning
details of a fresh plan to tackle the almost 12-month-long
delay in a project to turn its Chuquicamata open pit mine in
the country into an underground operation.
Reuters – Codelco expects its annual copper production to
reach 2 million tonnes by 2016 at it invests US$25 billion in
new mines and expansion projects to boost output. Codelco
produced 1.67 million tonnes of copper in 2014 from its 100%
owned mines, but its position as the world’s No.1 producer
is being threatened by declining ore grades, high energy
costs and permitting delays for new projects.
Peru's biggest mining union has approved an indefinite work
stoppage, commencing May 18, in a bid to demand better
working conditions for workers, Reuters reported, citing
Ricardo Juarez, president of the national mining workers
federation.
Oz Metals
26th
Edition – 19th
Apr 2015
DISCLAIMER
This report is provided in good faith from sources believed to be accurate and reliable. Terra Studio Pty Ltd directors and employees do not accept liability
for the results of any action taken on the basis of the information provided or for any errors or omissions contained therein. Readers should seek
investment advice from their professional advisors before acting upon information contained herein.
Page 3 / 4
TerraStudio
In a bid to prevent looming layoffs and shuttering of
operations in the country, Zambia has decided to ditch its
initial plans to raise mining royalties by too much, now
proposing to set the royalties at 9% for both open-pit and
underground mines, Reuters reported, citing "a source in the
presidency."
The unexpected drop in the price of nickel has prompted
Macquarie to lower its price forecasts and downgrade
Australian producers, MiningNews reported. "The collapse
in nickel prices to six-year lows has taken the market by
surprise and certainly was not expected by Macquarie," the
report added, citing Macquarie.
Reuters – The lead market is on a tear. The least sexy of
the industrial metals traded on the LME has surged by over
20% from its March lows to a current $2,049/t ($0.93/lb). It is
showing year-to-date gains of almost 10%, making it by
some margin the best performance of the core LME metals
so far this year.
SMM - Zinc prices will have a big chance to rise during the
second quarter of the year, Shanghai Metals Market’s
interview finds. Production worries from environmental drive
and demand expectations following China’s One Belt, One
Road policy are a major price driver, Jinyou Futures said to
SMM. The ongoing stricter environmental protection
inspections across the nation, especially in some regions,
will prevent utilisation rate at domestic zinc smelters from
rising significantly, and this will serve as a major supporter
to zinc price. The US potential hike in its interest rate,
however, will be negative to zinc price, but the supply and
demand dynamics will remain the leading factor.
MiningNews.net reported that MMG is contemplating a
revised development plan for its wholly owned Dugald River
zinc-lead-silver project in Queensland, with a decision due
in the third quarter.
Reuters - Members of Indonesia's tin association and PT
Timah (Persero) Tbk will not trade the metals at prices
below US$17,000/t, Jabin Sufianto — president of the
Indonesian Association of Tin Exporters. Tin shipments from
Indonesia are forecast to drop by 8% to 14% this year from
75,925 tonnes in 2014.
SNL - Cameco Corp. has struck a deal with the Department
of Atomic Energy of India to supply 7.1 million pounds of
uranium concentrate under a long-term contract through
2020. The Saskatchewan-based uranium giant noted that
the contract is its first with India, and that the country is the
world's second fastest growing market for nuclear fuel. India
is currently operating 21 nuclear reactors to provide 6,000
megawatts of nuclear capacity to meet about 3% of its
electricity needs, with 45,000 megawatts of nuclear capacity
anticipated by 2032.
Australian Mining - Local business lobbyists in Queensland's
city of Mt. Isa voiced their support for uranium mining, voting
to submit a formal response to the minister for natural
resources and mines to say they oppose the re-
implementation of the ban on uranium mining.
Funding, Mergers & Acquisitions
Anglo American is testing market appetite for its copper
deposits Mantos Blancos in Antofagasta and Mantoverde in
Atacama, two of the assets the miner has earmarked for
divestment. Other assets for disposal include the Chagres
smelter and the company's 50.1% stake in the El Soldado
mine.
Reuters - Anglo American is also looking at syndicating its
Peru-based Quellaveco copper project and having current
partner Mitsubishi Corp. up its current 18.1% interest.
Alamos Gold and AuRico Gold are to undertake a US$1.5
billion merger of equals to create an intermediate gold
producer with three producing gold mines and strong growth
potential, in yet another display of growing investor interest
in Canadian and Mexican gold assets.
Intermin Resources Ltd entered into a deal with La Mancha
Resources Australia Pty Ltd in which the latter could earn up
to a 70% interest in the Binduli gold project in Western
Australia.
Toro Energy is reportedly in discussions with as many as six
energy utilities interested in possibly acquiring a stake in the
company and funding its A$315 million Wiluna uranium
project in Western Australia. Toro is ready to sell even a
majority stake in the company under favourable conditions
as 22% shareholder OZ Minerals is expected to sell its
entire stake in the company.
Bauxite Sector
Source: Bloomberg, SNL Metals & Mining, Terra Studio
Lithium-Tantalum Sector
Source: SNL Metals & Mining, Terra Studio
Code Company Name
Close
Price
Week Δ YTD Δ
52 Week
Range
Market Cap
(A$m)
Cash
(A$m)
TEV
(A$m)
ABX Australian Bauxite 0.35 ▲ 1% 13% 44 5 39
BAU Bauxite Resources 0.080 ▲ 4% (18%) 19 25 (6)
CAY Canyon Resources 0.042 ▼ (7%) (16%) 5 1 4
MLM Metallica Minerals 0.066 ▼ (6%) 20% 11 1 10
MMI Metro Mining 0.076 ▼ (5%) 181% 22 8 14
Company Name
Close
Price
Week Δ YTD Δ
52 Week
Range
Market Cap
(A$m)
Cash
(A$m)
TEV
(A$m)
Altura Mining 0.010 ▼ (38%) (85%) 5 3 4
Galaxy Resources 0.030 ▼ (6%) 20% 32 13 125
Neometals 0.080 ▲ 23% 111% 40 7 38
Orocobre 2.15 ▼ (2%) (23%) 326 26 327
Pilbara Minerals 0.038 — 0% (10%) 23 2 20
Oz Metals
26th
Edition – 19th
Apr 2015
DISCLAIMER
This report is provided in good faith from sources believed to be accurate and reliable. Terra Studio Pty Ltd directors and employees do not accept liability
for the results of any action taken on the basis of the information provided or for any errors or omissions contained therein. Readers should seek
investment advice from their professional advisors before acting upon information contained herein.
Page 4 / 4
TerraStudio
Tin Sector
Source: SNL Metals & Mining
Nickel Sector
Source: SNL Metals & Mining
Copper Producers
Source: SNL Metals & Mining
Copper Developers & Explorers
Zinc & Poly-metallic Sector
Source: SNL Metals & Mining
Gold Producers
Source: SNL Metals & Mining
Gold Developers & Explorers
Source: SNL Metals & Mining
For further information, please contact:
J-François Bertincourt
+61 406 998 779
jf@terrastudio.biz
Company Name
Close
Price
Week Δ YTD Δ
52 Week
Range
Market Cap
(A$m)
Cash
(A$m)
TEV
(A$m)
Consolidated Tin Mines 0.050 ▲ 19% 22% 14 0 14
Elementos 0.008 ▼ (20%) 0% 6 1 5
Kasbah Resources 0.035 — 0% (35%) 16 4 10
Metals X 1.28 ▼ (2%) 62% 530 57 423
Monto Minerals 0.002 ▲ 100% 0% 3 1 2
Stellar Resources 0.035 — 0% 21% 11 4 8
Venture Minerals 0.025 — 0% (19%) 7 7 3
Company Name
Close
Price
Week Δ YTD Δ
52 Week
Range
Market Cap
(A$m)
Cash
(A$m)
TEV
(A$m)
TEV/
EBITDA
Independence Group 5.57 ▲ 11% 26% 1,305 57 1,213 NA
Mirabella Nickel 0.130 ▲ 30% 348% 121 18 224 0.4x
Mincor Resources 0.58 ▼ (8%) (2%) 108 26 90 NA
Panoramic Resources 0.43 ▼ (2%) 2% 138 64 79 1.1x
Western Areas 3.47 ▲ 13% (7%) 807 231 756 NA
Axiom Mining 0.170 ▲ 3% (24%) 41 2 39 NM
Cassini Resources 0.08 ▲ 20% (30%) 10 8 7 NA
Duketon Mining 0.17 ▼ (3%) (35%) 13 7 6 NA
Legend Mining 0.007 ▼ (13%) 0% 14 7 7 NM
Matsa Resources 0.165 ▼ (13%) (3%) 24 3 23 NA
Metallica Minerals 0.066 ▼ (6%) 20% 11 1 10 NA
Pioneer Resources 0.016 ▼ (11%) 23% 11 1 9 NA
Poseidon Nickel 0.10 ▼ (8%) (19%) 66 4 83 NA
Segue Resources 0.005 — 0% 0% 10 1 9 NA
St George Mining 0.065 ▼ (11%) 3% 7 1 6 NA
Sirius Resources 2.62 ▲ 5% 2% 895 59 650 NM
Talisman Mining 0.17 ▲ 3% 6% 22 16 7 NA
Winward Resources 0.24 ▼ (35%) 47% 25 6 22 NA
Code Company Name
Close
Price
Week Δ YTD Δ
52 Week
Range
Market Cap
(A$m)
Cash
(A$m)
TEV
(A$m)
TEV/
EBITDA
ABY Aditya Birla Minerals 0.19 — 0% (5%) 58 137 (46) NA
HGO Hillgrove Resources 0.35 ▼ (1%) (23%) 51 9 61 1.3x
KBL KBL Mining 0.025 ▲ 14% (17%) 12 7 35 NA
MWE Mawson West 0.055 ▲ 38% 10% 22 21 71 NM
OZL OZ Minerals 3.91 ▲ 2% 12% 1,187 219 968 2.8x
PNA PanAust 1.74 ▼ (1%) 23% 1,124 74 1,346 NM
SFR Sandfire Resources 4.38 ▲ 3% (4%) 683 58 768 NA
SRQ Straits Resources 0.004 ▼ (20%) (20%) 5 13 162 NA
TGS Tiger Resources 0.053 ▼ (4%) (59%) 61 80 269 5.8x
985 CST Mining 0.065 ▲ 18% 48% 1,761 136 668 1.6x
1208 MMG 3.23 ▲ 5% 35% 17,085 251 88,756 15.3x
3993 China Molybdenum 7.86 ▼ (5%) 75% 76,941 9,326 78,502 20.4x
Code Company Name
Close
Price
Week Δ YTD Δ
52 Week
Range
Market Cap
(A$m)
Cash
(A$m)
TEV
(A$m)
AOH Altona Mining 0.105 ▲ 5% (56%) 56 129 (73)
ARE Argonaut Resources 0.007 ▼ (22%) (56%) 3 1 2
AVB Avanco Resources 0.083 ▲ 19% 9% 138 20 118
AVI Avalon Minerals 0.025 ▼ (17%) 25% 4 1 3
AZS Azure Minerals 0.014 — 0% (42%) 14 1 0
CDU CuDeco (suspended) 1.41 — 0% (28%) 384 7 439
CVV Caravel Minerals 0.007 — 0% (13%) 5 1 5
ENR Encounter Resources 0.10 ▲ 2% (27%) 13 4 11
ERM Emmerson Resources 0.027 ▲ 8% (13%) 10 2 7
FND Finders Resources 0.15 ▼ (6%) 0% 99 48 99
GCR Golden Cross Resources 0.059 ▼ (2%) (16%) 6 2 5
GPR Geopacific Resources 0.040 ▲ 14% (23%) 15 4 11
HAV Havilah Resources 0.26 ▲ 11% 82% 40 3 37
HCH Hot Chili 0.11 ▼ (4%) (31%) 38 6 44
HMX Hammer Metals 0.083 ▼ (2%) 1% 8 1 8
IAU Intrepid Mines 0.11 ▼ (4%) (19%) 41 74 (33)
KDR Kidman Resources 0.046 ▲ 15% (31%) 6 3 5
KGL KGL Resources 0.13 ▼ (11%) (44%) 18 9 9
MEP Minotaur Exploration 0.09 ▼ (1%) (36%) 17 5 11
MNC Metminco 0.005 ▲ 11% (38%) 10 1 9
MTH Mithril Resources 0.006 — 0% (14%) 3 2 1
PEX Peel Mining 0.085 ▲ 16% 23% 11 3 9
RDM Red Metal 0.040 ▼ (2%) (51%) 7 2 3
RER Regal Resources 0.032 ▼ (20%) (30%) 7 2 4
RTG RTG Mining 0.570 ▲ 6% (2%) 77 2 74
RXM Rex Minerals 0.085 ▲ 1% (23%) 19 3 11
SMD Syndicated Metals 0.020 — 0% (38%) 5 2 4
SRI Sipa Resources 0.070 ▼ (7%) 89% 43 4 42
SUH Southern Hemisphere 0.010 — 0% (77%) 2 2 2
THX Thundelarra Resources 0.099 ▲ 11% (10%) 32 7 24
XAM Xanadu Mines 0.093 ▼ (7%) (7%) 35 8 34
Company Name
Close
Price
Week Δ YTD Δ
52 Week
Range
Market Cap
(A$m)
Cash
(A$m)
TEV
(A$m)
Aeon Metals 0.090 ▲ 11% (10%) 27 5 39
DGR Global 0.036 ▼ (10%) 13% 15 0 17
Heron Resources 0.13 ▲ 4% 4% 47 28 22
Ironbark Zinc 0.100 ▲ 6% 25% 44 3 41
Impact Minerals 0.017 ▲ 31% (29%) 10 1 7
Investigator Resources 0.011 — 0% (31%) 5 3 0
MacPhersons Resources 0.120 ▲ 4% (4%) 38 5 33
Phoenix Copper 0.014 ▼ (18%) (53%) 5 3 2
Red Metal 0.040 ▼ (2%) (51%) 7 8 (1)
Red River Resources 0.14 ▼ (4%) 23% 24 4 20
Rox Resources 0.030 — 0% 7% 26 3 23
Terramin Australia 0.105 ▼ (9%) (5%) 159 1 158
Variscan Mines 0.011 ▼ (45%) (55%) 3 2 2
Venturex Resources 0.004 — 0% (20%) 6 1 5
Code Company Name
Close
Price
Week Δ YTD Δ
52 Week
Range
Market Cap
(A$m)
Cash
(A$m)
TEV
(A$m)
TEV/
EBITDA
AGD Austral Gold 0.15 ▲ 85% 15% 72 NA 63 NA
ALK Alkane Resources 0.25 ▼ (11%) 14% 104 16 85 NA
AMI Aurelia Metals 0.26 ▲ 2% 6% 99 22 200 NA
BDR Beadell Resources 0.23 ▲ 7% 0% 180 13 285 4.4x
BOK Black Oak Minerals 0.36 ▼ (10%) 33% 16 11 30 NA
DRM Doray Minerals 0.44 — 0% (8%) 105 16 104 NA
EVN Evolution Mining 0.93 ▲ 5% 44% 667 32 796 3.9x
IGO Independence Group 5.57 ▲ 11% 26% 1,305 57 1,213 NA
KCN Kingsgate Consolidated 0.69 ▼ (3%) 4% 153 54 236 NA
KRM Kingsrose Mining 0.27 ▲ 23% 6% 97 7 107 NA
LSA Lachlan Star 0.024 — 0% 20% 4 2 22 NA
MIZ Minera Gold 0.002 — 0% (33%) 6 0 11 NA
MLX Metals X 1.28 ▼ (2%) 62% 530 57 423 NA
MML Medusa Mining 0.90 ▼ (4%) 38% 186 13 179 NA
MOY Millennium Minerals 0.028 — 0% (24%) 6 2 42 NM
NCM Newcrest Mining 14.18 ▲ 1% 30% 10,869 141 15,286 NA
NGF Norton Gold Fields 0.20 ▼ (15%) 56% 182 19 309 4.8x
NST Northern Star Resources 2.20 ▼ (4%) 48% 1,304 82 1,276 NA
OGC OceanaGold Corp. 2.24 ▼ (12%) 11% 674 NA 756 2.6x
PGI PanTerra Gold 0.170 ▲ 13% (6%) 14 3 77 NM
PRU Perseus Mining 0.30 ▲ 2% 13% 155 37 121 2.1x
RMS Ramelius Resources 0.140 ▼ (3%) 175% 66 12 48 NA
RRL Regis Resources 1.29 ▼ (1%) (33%) 642 7 652 NA
RSG Resolute Mining 0.26 ▼ (2%) (2%) 167 19 198 NA
SAR Saracen Mineral Holdings 0.45 ▲ 5% 76% 357 36 337 NA
SBM St Barbara 0.32 — 0% 200% 156 79 479 NA
SLR Silver Lake Resources 0.18 ▼ (5%) (10%) 88 24 95 NA
TBR Tribune Resources 3.50 ▼ (1%) 32% 175 11 190 11.0x
TRY Troy Resources 0.46 ▼ (1%) 0% 90 43 130 NA
UML Unity Mining 0.011 ▲ 16% 57% 12 7 0 NA
Code Company Name
Close
Price
Week Δ YTD Δ
52 Week
Range
Market Cap
(A$m)
Cash
(A$m)
TEV
(A$m)
AYC A1 Consolidated 0.035 — 0% (13%) 10 0 9
ABU ABM Resources 0.25 ▲ 7% (15%) 84 11 73
AWV Anova Metals 0.046 — 0% 70% 13 1 12
AZM Azumah Resources 0.025 ▼ (7%) 25% 10 4 9
BLK Blackham Resources 0.145 ▼ (6%) 184% 26 3 23
BSR Bassari Resources 0.010 ▼ (9%) (17%) 13 0 13
CHN Chalice Gold Mines 0.12 ▼ (4%) 10% 33 43 (10)
CHZ Chesser Resources 0.033 — 0% (8%) 7 1 3
DCN Dacian Gold 0.50 ▲ 6% 79% 48 8 41
EXC Exterra Resources 0.020 ▲ 67% 54% 4 1 3
EXG Excelsior Gold 0.090 ▼ (9%) 48% 42 2 41
FML Focus Minerals 0.007 — 0% (7%) 59 9 50
GCY Gascoyne Resources 0.087 ▼ (4%) 23% 16 1 15
GMR Golden Rim Resources 0.008 ▼ (6%) 60% 12 1 11
GOR Gold Road Resources 0.36 ▲ 3% 47% 214 21 193
GRY Gryphon Minerals 0.060 — 0% (6%) 24 34 0
IDC Indochine Mining 0.006 — 0% (50%) 8 0 10
KGD Kula Gold 0.042 ▼ (2%) (5%) 11 3 8
MSR Manas Resources 0.014 ▼ (13%) 0% 7 0 7
MUX Mungana Goldmines 0.130 — 0% 4% 31 5 36
OGX Orinoco Gold 0.072 ▼ (3%) 24% 11 1 10
PNR Pacific Niugini 0.075 ▼ (6%) 50% 29 1 28
PXG Phoenix Gold 0.072 ▼ (15%) (27%) 31 6 25
RED Red 5 0.115 ▲ 15% 25% 87 38 70
RNI Resource & Investment 0.040 ▼ (20%) (47%) 20 5 37
RNS Renaissance Minerals 0.040 ▼ (2%) (38%) 16 4 12
SAU Southern Gold 0.012 — 0% 50% 6 1 6
SIH Sihayo Gold 0.015 ▲ 25% 88% 17 0 12
TAM Tanami Gold 0.034 ▲ 6% 143% 40 1 50
WAF West African Resources 0.086 ▲ 26% (14%) 23 3 23
WPG WPG Resources 0.035 — 0% (8%) 10 3 6

More Related Content

What's hot

Oz Metals: How Much Zinc Did Glencore Hide Away?
Oz Metals: How Much Zinc Did Glencore Hide Away?Oz Metals: How Much Zinc Did Glencore Hide Away?
Oz Metals: How Much Zinc Did Glencore Hide Away?J-François Bertincourt
 
Lincoln crowne copper gold report 14102013
Lincoln crowne copper gold report 14102013Lincoln crowne copper gold report 14102013
Lincoln crowne copper gold report 14102013Lincoln Crowne & Company
 
Lincoln crowne copper gold report 20131202
Lincoln crowne copper gold report 20131202Lincoln crowne copper gold report 20131202
Lincoln crowne copper gold report 20131202Lincoln Crowne & Company
 
Tin Market Overview
Tin Market OverviewTin Market Overview
Tin Market OverviewSyrymbet JSC
 
Lincoln crowne resources investorseries_july2013
Lincoln crowne resources investorseries_july2013Lincoln crowne resources investorseries_july2013
Lincoln crowne resources investorseries_july2013Lincoln Crowne & Company
 
16 09-07-slw-presentation-final
16 09-07-slw-presentation-final16 09-07-slw-presentation-final
16 09-07-slw-presentation-finalsilverwheaton2016
 
16 09-13 slw presentation final (for web and print)
16 09-13 slw presentation final (for web and print)16 09-13 slw presentation final (for web and print)
16 09-13 slw presentation final (for web and print)silverwheaton2016
 

What's hot (20)

Ozm 20141116
Ozm 20141116Ozm 20141116
Ozm 20141116
 
Oz Metals: How Much Zinc Did Glencore Hide Away?
Oz Metals: How Much Zinc Did Glencore Hide Away?Oz Metals: How Much Zinc Did Glencore Hide Away?
Oz Metals: How Much Zinc Did Glencore Hide Away?
 
Oz Metals 20150101
Oz Metals 20150101Oz Metals 20150101
Oz Metals 20150101
 
Oz Metals 21 Dec 2014
Oz Metals 21 Dec 2014Oz Metals 21 Dec 2014
Oz Metals 21 Dec 2014
 
Oz Metals 20150412
Oz Metals 20150412Oz Metals 20150412
Oz Metals 20150412
 
Oz Metals 20160327
Oz Metals 20160327Oz Metals 20160327
Oz Metals 20160327
 
Oz Metals 20150808
Oz Metals 20150808Oz Metals 20150808
Oz Metals 20150808
 
Lincoln crowne copper gold report 14102013
Lincoln crowne copper gold report 14102013Lincoln crowne copper gold report 14102013
Lincoln crowne copper gold report 14102013
 
Oz Metals 20150719
Oz Metals 20150719Oz Metals 20150719
Oz Metals 20150719
 
Copper gold report 20140331
Copper gold report 20140331Copper gold report 20140331
Copper gold report 20140331
 
Lincoln crowne copper gold report 20131202
Lincoln crowne copper gold report 20131202Lincoln crowne copper gold report 20131202
Lincoln crowne copper gold report 20131202
 
Lcc copper gold report 20140310
Lcc copper gold report 20140310Lcc copper gold report 20140310
Lcc copper gold report 20140310
 
LCC copper gold report 20140317
LCC copper gold report 20140317LCC copper gold report 20140317
LCC copper gold report 20140317
 
Oz Metals 20141129
Oz Metals 20141129Oz Metals 20141129
Oz Metals 20141129
 
Tin Market Overview
Tin Market OverviewTin Market Overview
Tin Market Overview
 
RCR Quarterly Report- Oct-10-Copper
RCR Quarterly Report- Oct-10-CopperRCR Quarterly Report- Oct-10-Copper
RCR Quarterly Report- Oct-10-Copper
 
Oz Metals 20150215
Oz Metals 20150215Oz Metals 20150215
Oz Metals 20150215
 
Lincoln crowne resources investorseries_july2013
Lincoln crowne resources investorseries_july2013Lincoln crowne resources investorseries_july2013
Lincoln crowne resources investorseries_july2013
 
16 09-07-slw-presentation-final
16 09-07-slw-presentation-final16 09-07-slw-presentation-final
16 09-07-slw-presentation-final
 
16 09-13 slw presentation final (for web and print)
16 09-13 slw presentation final (for web and print)16 09-13 slw presentation final (for web and print)
16 09-13 slw presentation final (for web and print)
 

Similar to Oz Metals 20150419

Oz Metals: Wanted Higher Grade Low Cost Gold Mine...Cheap
Oz Metals: Wanted Higher Grade Low Cost Gold Mine...CheapOz Metals: Wanted Higher Grade Low Cost Gold Mine...Cheap
Oz Metals: Wanted Higher Grade Low Cost Gold Mine...CheapJ-François Bertincourt
 
Oz Metals: Some Positive Moves in the Nickel Sector
Oz Metals:  Some Positive Moves in the Nickel SectorOz Metals:  Some Positive Moves in the Nickel Sector
Oz Metals: Some Positive Moves in the Nickel SectorJ-François Bertincourt
 
Oz Metals: US$5.3b Oyu Tolgoi Expansion Going Ahead
Oz Metals: US$5.3b Oyu Tolgoi Expansion Going AheadOz Metals: US$5.3b Oyu Tolgoi Expansion Going Ahead
Oz Metals: US$5.3b Oyu Tolgoi Expansion Going AheadJ-François Bertincourt
 
Oz Metals: France Lends EUR300m to Nickel Producer
Oz Metals:  France Lends EUR300m to Nickel ProducerOz Metals:  France Lends EUR300m to Nickel Producer
Oz Metals: France Lends EUR300m to Nickel ProducerJ-François Bertincourt
 
The China Slowdown Effect Plus Fundamental Drivers Behind Commodities
The China Slowdown Effect Plus Fundamental Drivers Behind CommoditiesThe China Slowdown Effect Plus Fundamental Drivers Behind Commodities
The China Slowdown Effect Plus Fundamental Drivers Behind CommoditiesInvast Financial Services
 

Similar to Oz Metals 20150419 (19)

Oz Metals 26 Oct 2014
Oz Metals 26 Oct 2014Oz Metals 26 Oct 2014
Oz Metals 26 Oct 2014
 
Oz Metals 20141018
Oz Metals 20141018Oz Metals 20141018
Oz Metals 20141018
 
Oz Metals 6 Oct 2014
Oz Metals 6 Oct 2014Oz Metals 6 Oct 2014
Oz Metals 6 Oct 2014
 
Oz Metals: Wanted Higher Grade Low Cost Gold Mine...Cheap
Oz Metals: Wanted Higher Grade Low Cost Gold Mine...CheapOz Metals: Wanted Higher Grade Low Cost Gold Mine...Cheap
Oz Metals: Wanted Higher Grade Low Cost Gold Mine...Cheap
 
Oz Metals 20150712
Oz Metals 20150712Oz Metals 20150712
Oz Metals 20150712
 
Oz Metals 20150124
Oz Metals 20150124Oz Metals 20150124
Oz Metals 20150124
 
Oz Metals 20150111
Oz Metals 20150111Oz Metals 20150111
Oz Metals 20150111
 
Oz Metals 20150118
Oz Metals 20150118Oz Metals 20150118
Oz Metals 20150118
 
Oz Metals: Some Positive Moves in the Nickel Sector
Oz Metals:  Some Positive Moves in the Nickel SectorOz Metals:  Some Positive Moves in the Nickel Sector
Oz Metals: Some Positive Moves in the Nickel Sector
 
Oz Metals: US$5.3b Oyu Tolgoi Expansion Going Ahead
Oz Metals: US$5.3b Oyu Tolgoi Expansion Going AheadOz Metals: US$5.3b Oyu Tolgoi Expansion Going Ahead
Oz Metals: US$5.3b Oyu Tolgoi Expansion Going Ahead
 
Oz Metals 20160403
Oz Metals 20160403Oz Metals 20160403
Oz Metals 20160403
 
Oz Metals 20150322
Oz Metals 20150322Oz Metals 20150322
Oz Metals 20150322
 
Oz Metals 20150816
Oz Metals 20150816Oz Metals 20150816
Oz Metals 20150816
 
Oz Metals 20150719
Oz Metals 20150719Oz Metals 20150719
Oz Metals 20150719
 
Oz Metals 20160320
Oz Metals 20160320Oz Metals 20160320
Oz Metals 20160320
 
Oz Metals 20150705
Oz Metals 20150705Oz Metals 20150705
Oz Metals 20150705
 
Oz Metals 20150405
Oz Metals 20150405Oz Metals 20150405
Oz Metals 20150405
 
Oz Metals: France Lends EUR300m to Nickel Producer
Oz Metals:  France Lends EUR300m to Nickel ProducerOz Metals:  France Lends EUR300m to Nickel Producer
Oz Metals: France Lends EUR300m to Nickel Producer
 
The China Slowdown Effect Plus Fundamental Drivers Behind Commodities
The China Slowdown Effect Plus Fundamental Drivers Behind CommoditiesThe China Slowdown Effect Plus Fundamental Drivers Behind Commodities
The China Slowdown Effect Plus Fundamental Drivers Behind Commodities
 

Recently uploaded

Abhay Bhutada: Driving Digital Transformation in NBFC Sector
Abhay Bhutada: Driving Digital Transformation in NBFC SectorAbhay Bhutada: Driving Digital Transformation in NBFC Sector
Abhay Bhutada: Driving Digital Transformation in NBFC Sectornickysharmasucks
 
Certified Kala Jadu, Black magic specialist in Rawalpindi and Bangali Amil ba...
Certified Kala Jadu, Black magic specialist in Rawalpindi and Bangali Amil ba...Certified Kala Jadu, Black magic specialist in Rawalpindi and Bangali Amil ba...
Certified Kala Jadu, Black magic specialist in Rawalpindi and Bangali Amil ba...batoole333
 
The Pfandbrief Roundtable 2024 - Covered Bonds
The Pfandbrief Roundtable 2024 - Covered BondsThe Pfandbrief Roundtable 2024 - Covered Bonds
The Pfandbrief Roundtable 2024 - Covered BondsNeil Day
 
Shrambal_Distributors_Newsletter_May-2024.pdf
Shrambal_Distributors_Newsletter_May-2024.pdfShrambal_Distributors_Newsletter_May-2024.pdf
Shrambal_Distributors_Newsletter_May-2024.pdfvikashdidwania1
 
No 1 Top Love marriage specialist baba ji amil baba kala ilam powerful vashik...
No 1 Top Love marriage specialist baba ji amil baba kala ilam powerful vashik...No 1 Top Love marriage specialist baba ji amil baba kala ilam powerful vashik...
No 1 Top Love marriage specialist baba ji amil baba kala ilam powerful vashik...batoole333
 
Webinar on E-Invoicing for Fintech Belgium
Webinar on E-Invoicing for Fintech BelgiumWebinar on E-Invoicing for Fintech Belgium
Webinar on E-Invoicing for Fintech BelgiumFinTech Belgium
 
Current scenario of Energy Retail utilities market in UK
Current scenario of Energy Retail utilities market in UKCurrent scenario of Energy Retail utilities market in UK
Current scenario of Energy Retail utilities market in UKParas Gupta
 
Lion One Corporate Presentation May 2024
Lion One Corporate Presentation May 2024Lion One Corporate Presentation May 2024
Lion One Corporate Presentation May 2024Adnet Communications
 
Solution Manual For Financial Statement Analysis, 13th Edition By Charles H. ...
Solution Manual For Financial Statement Analysis, 13th Edition By Charles H. ...Solution Manual For Financial Statement Analysis, 13th Edition By Charles H. ...
Solution Manual For Financial Statement Analysis, 13th Edition By Charles H. ...rightmanforbloodline
 
TriStar Gold- 05-13-2024 corporate presentation
TriStar Gold- 05-13-2024 corporate presentationTriStar Gold- 05-13-2024 corporate presentation
TriStar Gold- 05-13-2024 corporate presentationAdnet Communications
 
Black magic specialist in Saudi Arabia (Kala jadu expert in UK) Bangali Amil ...
Black magic specialist in Saudi Arabia (Kala jadu expert in UK) Bangali Amil ...Black magic specialist in Saudi Arabia (Kala jadu expert in UK) Bangali Amil ...
Black magic specialist in Saudi Arabia (Kala jadu expert in UK) Bangali Amil ...batoole333
 
Black magic specialist in Canada (Kala ilam specialist in UK) Bangali Amil ba...
Black magic specialist in Canada (Kala ilam specialist in UK) Bangali Amil ba...Black magic specialist in Canada (Kala ilam specialist in UK) Bangali Amil ba...
Black magic specialist in Canada (Kala ilam specialist in UK) Bangali Amil ba...batoole333
 
Q1 2024 Conference Call Presentation vF.pdf
Q1 2024 Conference Call Presentation vF.pdfQ1 2024 Conference Call Presentation vF.pdf
Q1 2024 Conference Call Presentation vF.pdfAdnet Communications
 
najoomi asli amil baba kala jadu expert rawalpindi bangladesh uk usa
najoomi asli amil baba kala jadu expert rawalpindi bangladesh uk usanajoomi asli amil baba kala jadu expert rawalpindi bangladesh uk usa
najoomi asli amil baba kala jadu expert rawalpindi bangladesh uk usamazhshah570
 
Pension dashboards forum 1 May 2024 (1).pdf
Pension dashboards forum 1 May 2024 (1).pdfPension dashboards forum 1 May 2024 (1).pdf
Pension dashboards forum 1 May 2024 (1).pdfHenry Tapper
 
Strategic Resources May 2024 Corporate Presentation
Strategic Resources May 2024 Corporate PresentationStrategic Resources May 2024 Corporate Presentation
Strategic Resources May 2024 Corporate PresentationAdnet Communications
 
Pitch-deck CopyFinancial and MemberForex.ppsx
Pitch-deck CopyFinancial and MemberForex.ppsxPitch-deck CopyFinancial and MemberForex.ppsx
Pitch-deck CopyFinancial and MemberForex.ppsxFuadS2
 
APPLIED ECONOMICS Sept 9FGHFGHFHGFGHFHGFHGFH
APPLIED ECONOMICS Sept 9FGHFGHFHGFGHFHGFHGFHAPPLIED ECONOMICS Sept 9FGHFGHFHGFGHFHGFHGFH
APPLIED ECONOMICS Sept 9FGHFGHFHGFGHFHGFHGFHgeloencina777
 
fundamentals of corporate finance 11th canadian edition test bank.docx
fundamentals of corporate finance 11th canadian edition test bank.docxfundamentals of corporate finance 11th canadian edition test bank.docx
fundamentals of corporate finance 11th canadian edition test bank.docxssuserf63bd7
 
uk-no 1 kala ilam expert specialist in uk and qatar kala ilam expert speciali...
uk-no 1 kala ilam expert specialist in uk and qatar kala ilam expert speciali...uk-no 1 kala ilam expert specialist in uk and qatar kala ilam expert speciali...
uk-no 1 kala ilam expert specialist in uk and qatar kala ilam expert speciali...batoole333
 

Recently uploaded (20)

Abhay Bhutada: Driving Digital Transformation in NBFC Sector
Abhay Bhutada: Driving Digital Transformation in NBFC SectorAbhay Bhutada: Driving Digital Transformation in NBFC Sector
Abhay Bhutada: Driving Digital Transformation in NBFC Sector
 
Certified Kala Jadu, Black magic specialist in Rawalpindi and Bangali Amil ba...
Certified Kala Jadu, Black magic specialist in Rawalpindi and Bangali Amil ba...Certified Kala Jadu, Black magic specialist in Rawalpindi and Bangali Amil ba...
Certified Kala Jadu, Black magic specialist in Rawalpindi and Bangali Amil ba...
 
The Pfandbrief Roundtable 2024 - Covered Bonds
The Pfandbrief Roundtable 2024 - Covered BondsThe Pfandbrief Roundtable 2024 - Covered Bonds
The Pfandbrief Roundtable 2024 - Covered Bonds
 
Shrambal_Distributors_Newsletter_May-2024.pdf
Shrambal_Distributors_Newsletter_May-2024.pdfShrambal_Distributors_Newsletter_May-2024.pdf
Shrambal_Distributors_Newsletter_May-2024.pdf
 
No 1 Top Love marriage specialist baba ji amil baba kala ilam powerful vashik...
No 1 Top Love marriage specialist baba ji amil baba kala ilam powerful vashik...No 1 Top Love marriage specialist baba ji amil baba kala ilam powerful vashik...
No 1 Top Love marriage specialist baba ji amil baba kala ilam powerful vashik...
 
Webinar on E-Invoicing for Fintech Belgium
Webinar on E-Invoicing for Fintech BelgiumWebinar on E-Invoicing for Fintech Belgium
Webinar on E-Invoicing for Fintech Belgium
 
Current scenario of Energy Retail utilities market in UK
Current scenario of Energy Retail utilities market in UKCurrent scenario of Energy Retail utilities market in UK
Current scenario of Energy Retail utilities market in UK
 
Lion One Corporate Presentation May 2024
Lion One Corporate Presentation May 2024Lion One Corporate Presentation May 2024
Lion One Corporate Presentation May 2024
 
Solution Manual For Financial Statement Analysis, 13th Edition By Charles H. ...
Solution Manual For Financial Statement Analysis, 13th Edition By Charles H. ...Solution Manual For Financial Statement Analysis, 13th Edition By Charles H. ...
Solution Manual For Financial Statement Analysis, 13th Edition By Charles H. ...
 
TriStar Gold- 05-13-2024 corporate presentation
TriStar Gold- 05-13-2024 corporate presentationTriStar Gold- 05-13-2024 corporate presentation
TriStar Gold- 05-13-2024 corporate presentation
 
Black magic specialist in Saudi Arabia (Kala jadu expert in UK) Bangali Amil ...
Black magic specialist in Saudi Arabia (Kala jadu expert in UK) Bangali Amil ...Black magic specialist in Saudi Arabia (Kala jadu expert in UK) Bangali Amil ...
Black magic specialist in Saudi Arabia (Kala jadu expert in UK) Bangali Amil ...
 
Black magic specialist in Canada (Kala ilam specialist in UK) Bangali Amil ba...
Black magic specialist in Canada (Kala ilam specialist in UK) Bangali Amil ba...Black magic specialist in Canada (Kala ilam specialist in UK) Bangali Amil ba...
Black magic specialist in Canada (Kala ilam specialist in UK) Bangali Amil ba...
 
Q1 2024 Conference Call Presentation vF.pdf
Q1 2024 Conference Call Presentation vF.pdfQ1 2024 Conference Call Presentation vF.pdf
Q1 2024 Conference Call Presentation vF.pdf
 
najoomi asli amil baba kala jadu expert rawalpindi bangladesh uk usa
najoomi asli amil baba kala jadu expert rawalpindi bangladesh uk usanajoomi asli amil baba kala jadu expert rawalpindi bangladesh uk usa
najoomi asli amil baba kala jadu expert rawalpindi bangladesh uk usa
 
Pension dashboards forum 1 May 2024 (1).pdf
Pension dashboards forum 1 May 2024 (1).pdfPension dashboards forum 1 May 2024 (1).pdf
Pension dashboards forum 1 May 2024 (1).pdf
 
Strategic Resources May 2024 Corporate Presentation
Strategic Resources May 2024 Corporate PresentationStrategic Resources May 2024 Corporate Presentation
Strategic Resources May 2024 Corporate Presentation
 
Pitch-deck CopyFinancial and MemberForex.ppsx
Pitch-deck CopyFinancial and MemberForex.ppsxPitch-deck CopyFinancial and MemberForex.ppsx
Pitch-deck CopyFinancial and MemberForex.ppsx
 
APPLIED ECONOMICS Sept 9FGHFGHFHGFGHFHGFHGFH
APPLIED ECONOMICS Sept 9FGHFGHFHGFGHFHGFHGFHAPPLIED ECONOMICS Sept 9FGHFGHFHGFGHFHGFHGFH
APPLIED ECONOMICS Sept 9FGHFGHFHGFGHFHGFHGFH
 
fundamentals of corporate finance 11th canadian edition test bank.docx
fundamentals of corporate finance 11th canadian edition test bank.docxfundamentals of corporate finance 11th canadian edition test bank.docx
fundamentals of corporate finance 11th canadian edition test bank.docx
 
uk-no 1 kala ilam expert specialist in uk and qatar kala ilam expert speciali...
uk-no 1 kala ilam expert specialist in uk and qatar kala ilam expert speciali...uk-no 1 kala ilam expert specialist in uk and qatar kala ilam expert speciali...
uk-no 1 kala ilam expert specialist in uk and qatar kala ilam expert speciali...
 

Oz Metals 20150419

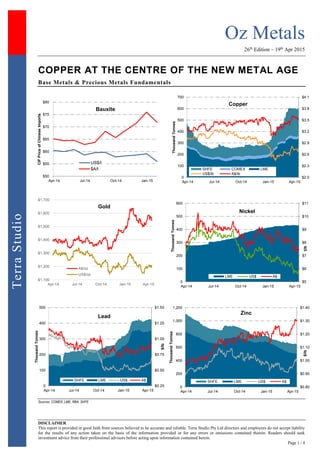
  • 1. Oz Metals 26th Edition – 19th Apr 2015 DISCLAIMER This report is provided in good faith from sources believed to be accurate and reliable. Terra Studio Pty Ltd directors and employees do not accept liability for the results of any action taken on the basis of the information provided or for any errors or omissions contained therein. Readers should seek investment advice from their professional advisors before acting upon information contained herein. Page 1 / 4 TerraStudio COPPER AT THE CENTRE OF THE NEW METAL AGE Base Metals & Precious Metals Fundamentals Sources: COMEX, LME, RBA, SHFE $50 $55 $60 $65 $70 $75 $80 Apr-14 Jul-14 Oct-14 Jan-15 CIFPriceofChineseImports Bauxite US$/t $A/t $2.0 $2.3 $2.6 $2.9 $3.2 $3.5 $3.8 $4.1 0 100 200 300 400 500 600 700 Apr-14 Jul-14 Oct-14 Jan-15 Apr-15 ThousandTonnes Copper SHFE COMEX LME US$/lb A$/lb $1,100 $1,200 $1,300 $1,400 $1,500 $1,600 $1,700 Apr-14 Jul-14 Oct-14 Jan-15 Apr-15 Gold A$/oz US$/oz $5 $6 $7 $8 $9 $10 $11 0 100 200 300 400 500 600 Apr-14 Jul-14 Oct-14 Jan-15 Apr-15 $/lb ThousandTonnes Nickel LME US$ A$ $0.25 $0.50 $0.75 $1.00 $1.25 $1.50 0 100 200 300 400 500 Apr-14 Jul-14 Oct-14 Jan-15 Apr-15 $/lb ThousandTonnes Lead SHFE LME US$ A$ $0.80 $0.90 $1.00 $1.10 $1.20 $1.30 $1.40 0 200 400 600 800 1,000 1,200 Apr-14 Jul-14 Oct-14 Jan-15 Apr-15 $/lb ThousandTonnes Zinc SHFE LME US$ A$
  • 2. Oz Metals 26th Edition – 19th Apr 2015 DISCLAIMER This report is provided in good faith from sources believed to be accurate and reliable. Terra Studio Pty Ltd directors and employees do not accept liability for the results of any action taken on the basis of the information provided or for any errors or omissions contained therein. Readers should seek investment advice from their professional advisors before acting upon information contained herein. Page 2 / 4 TerraStudio Markets & Majors Reuters - The Singapore trading hubs of the world's largest commodity companies are coming under scrutiny from the governments of some resource-producing countries who say they suspect they are using units in the Southeast Asian financial centre to avoid tax. Some of the world's largest oil, mining and soft commodity companies book billions of dollars of revenue in the tiny island state every year, where tax rates can be very low, which is perfectly legal unless they deliberately under-price group transactions so as to shift profit there from units in other countries. The Australian - A report commissioned by the University of Western Australia claims that the mining slump offers a once-in-a-lifetime chance for the Australian state to exploit its huge recent influx of global professionals by transforming into a regional hub for innovation. SNL - Every A$1 million invested in the Western Australia's Exploration Incentive Scheme stimulates exploration activity which generates A$10.3 million in benefits for the state, according to a study conducted by ACIL Allen Consulting for the Department of Mines and Petroleum. Australian Mining - Mining lobbyist Terry Burgess said South Australia will have the potential to build state mining revenues to A$7 billion per annum, but also believes that the Australian state has its work cut out to prepare for the market upswing. According to The Australian Financial Review, fund managers with large interests in Australian resource companies are not adding more funds to the sector, with Pengana Capital and Fidelity as examples. The two firms are using a "wait-and-see” approach after Australian Treasurer Joe Hockey's comments that iron ore prices could fall as low as US$35/t and a warning from Standard & Poor's Ratings Services. SMM - Will Chinese government introduce more stimulus measures following the better-than-expected economic reports? Will copper prices take impetus to extend rebound? “The PPI, though falling more slowly, remained weak, reflecting the real economy has not yet recovered,” an analyst from Dayou Futures told SMM, ”this means more easing policies are still needed to bring funds into real economy, that plus the growing long positions in copper, may herald further rally in copper prices.” Analyst from Shanghai CIFCO Futures also expected continued rise in copper prices, citing the arrival of peak demand season and disrupted production at large copper mines. But the analyst says the rebound may be limited. Reuters – Nearly a quarter of the world’s major copper mines are running in the red, even after producers including Codelco and BHP Billiton engage in the deepest cost-cutting in years, according to a Reuters analysis. A 17% slump since last July has pushed copper futures on the LME to under $6,000/t ($2.72/lb), the lowest since 2009, is the first major test of producers’ margins, since the global economic crisis, forcing a new reckoning after five years of relatively consistent profitability. Antofagasta CEO Diego Hernandez warned that Chile's copper industry may not remain competitive due to tapped out resources at mining projects and rising labour costs, London's Financial Times reported. Since 2004, Chile's investments in mining were about the same as the preceding decade, yet production has hardly registered any increases. Output between 1990 and 2004 jumped 9.2% annually while productivity nearly doubled. Separately, Hernandez told Metal Bulletin that forecasts of a copper surplus fell significantly in the past few months owing to several issues with existing and upcoming projects. The company initially estimated a copper surplus of 400,000 tonnes for 2015 in November 2014, which was reduced to 200,000 tonnes in February this year. Antofagasta now anticipates an even lower 2015 copper surplus of 100,000 tonnes. The CEO added that opportunities for M&A activity in the copper sector are more limited than other commodities while current prices make greenfield expansions less attractive. According to Metal Bulletin, Hernandez noted that "copper is still the best commodity to be in and the companies that own copper assets don't want to dispose of them." Metal Bulletin - Jean-Sébastien Jacques, CEO of Rio Tinto’s copper division, said the world is on the threshold of a new metal age and copper is at the centre. mining.com - Chilean copper giant Codelco is fine-tuning details of a fresh plan to tackle the almost 12-month-long delay in a project to turn its Chuquicamata open pit mine in the country into an underground operation. Reuters – Codelco expects its annual copper production to reach 2 million tonnes by 2016 at it invests US$25 billion in new mines and expansion projects to boost output. Codelco produced 1.67 million tonnes of copper in 2014 from its 100% owned mines, but its position as the world’s No.1 producer is being threatened by declining ore grades, high energy costs and permitting delays for new projects. Peru's biggest mining union has approved an indefinite work stoppage, commencing May 18, in a bid to demand better working conditions for workers, Reuters reported, citing Ricardo Juarez, president of the national mining workers federation.
  • 3. Oz Metals 26th Edition – 19th Apr 2015 DISCLAIMER This report is provided in good faith from sources believed to be accurate and reliable. Terra Studio Pty Ltd directors and employees do not accept liability for the results of any action taken on the basis of the information provided or for any errors or omissions contained therein. Readers should seek investment advice from their professional advisors before acting upon information contained herein. Page 3 / 4 TerraStudio In a bid to prevent looming layoffs and shuttering of operations in the country, Zambia has decided to ditch its initial plans to raise mining royalties by too much, now proposing to set the royalties at 9% for both open-pit and underground mines, Reuters reported, citing "a source in the presidency." The unexpected drop in the price of nickel has prompted Macquarie to lower its price forecasts and downgrade Australian producers, MiningNews reported. "The collapse in nickel prices to six-year lows has taken the market by surprise and certainly was not expected by Macquarie," the report added, citing Macquarie. Reuters – The lead market is on a tear. The least sexy of the industrial metals traded on the LME has surged by over 20% from its March lows to a current $2,049/t ($0.93/lb). It is showing year-to-date gains of almost 10%, making it by some margin the best performance of the core LME metals so far this year. SMM - Zinc prices will have a big chance to rise during the second quarter of the year, Shanghai Metals Market’s interview finds. Production worries from environmental drive and demand expectations following China’s One Belt, One Road policy are a major price driver, Jinyou Futures said to SMM. The ongoing stricter environmental protection inspections across the nation, especially in some regions, will prevent utilisation rate at domestic zinc smelters from rising significantly, and this will serve as a major supporter to zinc price. The US potential hike in its interest rate, however, will be negative to zinc price, but the supply and demand dynamics will remain the leading factor. MiningNews.net reported that MMG is contemplating a revised development plan for its wholly owned Dugald River zinc-lead-silver project in Queensland, with a decision due in the third quarter. Reuters - Members of Indonesia's tin association and PT Timah (Persero) Tbk will not trade the metals at prices below US$17,000/t, Jabin Sufianto — president of the Indonesian Association of Tin Exporters. Tin shipments from Indonesia are forecast to drop by 8% to 14% this year from 75,925 tonnes in 2014. SNL - Cameco Corp. has struck a deal with the Department of Atomic Energy of India to supply 7.1 million pounds of uranium concentrate under a long-term contract through 2020. The Saskatchewan-based uranium giant noted that the contract is its first with India, and that the country is the world's second fastest growing market for nuclear fuel. India is currently operating 21 nuclear reactors to provide 6,000 megawatts of nuclear capacity to meet about 3% of its electricity needs, with 45,000 megawatts of nuclear capacity anticipated by 2032. Australian Mining - Local business lobbyists in Queensland's city of Mt. Isa voiced their support for uranium mining, voting to submit a formal response to the minister for natural resources and mines to say they oppose the re- implementation of the ban on uranium mining. Funding, Mergers & Acquisitions Anglo American is testing market appetite for its copper deposits Mantos Blancos in Antofagasta and Mantoverde in Atacama, two of the assets the miner has earmarked for divestment. Other assets for disposal include the Chagres smelter and the company's 50.1% stake in the El Soldado mine. Reuters - Anglo American is also looking at syndicating its Peru-based Quellaveco copper project and having current partner Mitsubishi Corp. up its current 18.1% interest. Alamos Gold and AuRico Gold are to undertake a US$1.5 billion merger of equals to create an intermediate gold producer with three producing gold mines and strong growth potential, in yet another display of growing investor interest in Canadian and Mexican gold assets. Intermin Resources Ltd entered into a deal with La Mancha Resources Australia Pty Ltd in which the latter could earn up to a 70% interest in the Binduli gold project in Western Australia. Toro Energy is reportedly in discussions with as many as six energy utilities interested in possibly acquiring a stake in the company and funding its A$315 million Wiluna uranium project in Western Australia. Toro is ready to sell even a majority stake in the company under favourable conditions as 22% shareholder OZ Minerals is expected to sell its entire stake in the company. Bauxite Sector Source: Bloomberg, SNL Metals & Mining, Terra Studio Lithium-Tantalum Sector Source: SNL Metals & Mining, Terra Studio Code Company Name Close Price Week Δ YTD Δ 52 Week Range Market Cap (A$m) Cash (A$m) TEV (A$m) ABX Australian Bauxite 0.35 ▲ 1% 13% 44 5 39 BAU Bauxite Resources 0.080 ▲ 4% (18%) 19 25 (6) CAY Canyon Resources 0.042 ▼ (7%) (16%) 5 1 4 MLM Metallica Minerals 0.066 ▼ (6%) 20% 11 1 10 MMI Metro Mining 0.076 ▼ (5%) 181% 22 8 14 Company Name Close Price Week Δ YTD Δ 52 Week Range Market Cap (A$m) Cash (A$m) TEV (A$m) Altura Mining 0.010 ▼ (38%) (85%) 5 3 4 Galaxy Resources 0.030 ▼ (6%) 20% 32 13 125 Neometals 0.080 ▲ 23% 111% 40 7 38 Orocobre 2.15 ▼ (2%) (23%) 326 26 327 Pilbara Minerals 0.038 — 0% (10%) 23 2 20
  • 4. Oz Metals 26th Edition – 19th Apr 2015 DISCLAIMER This report is provided in good faith from sources believed to be accurate and reliable. Terra Studio Pty Ltd directors and employees do not accept liability for the results of any action taken on the basis of the information provided or for any errors or omissions contained therein. Readers should seek investment advice from their professional advisors before acting upon information contained herein. Page 4 / 4 TerraStudio Tin Sector Source: SNL Metals & Mining Nickel Sector Source: SNL Metals & Mining Copper Producers Source: SNL Metals & Mining Copper Developers & Explorers Zinc & Poly-metallic Sector Source: SNL Metals & Mining Gold Producers Source: SNL Metals & Mining Gold Developers & Explorers Source: SNL Metals & Mining For further information, please contact: J-François Bertincourt +61 406 998 779 jf@terrastudio.biz Company Name Close Price Week Δ YTD Δ 52 Week Range Market Cap (A$m) Cash (A$m) TEV (A$m) Consolidated Tin Mines 0.050 ▲ 19% 22% 14 0 14 Elementos 0.008 ▼ (20%) 0% 6 1 5 Kasbah Resources 0.035 — 0% (35%) 16 4 10 Metals X 1.28 ▼ (2%) 62% 530 57 423 Monto Minerals 0.002 ▲ 100% 0% 3 1 2 Stellar Resources 0.035 — 0% 21% 11 4 8 Venture Minerals 0.025 — 0% (19%) 7 7 3 Company Name Close Price Week Δ YTD Δ 52 Week Range Market Cap (A$m) Cash (A$m) TEV (A$m) TEV/ EBITDA Independence Group 5.57 ▲ 11% 26% 1,305 57 1,213 NA Mirabella Nickel 0.130 ▲ 30% 348% 121 18 224 0.4x Mincor Resources 0.58 ▼ (8%) (2%) 108 26 90 NA Panoramic Resources 0.43 ▼ (2%) 2% 138 64 79 1.1x Western Areas 3.47 ▲ 13% (7%) 807 231 756 NA Axiom Mining 0.170 ▲ 3% (24%) 41 2 39 NM Cassini Resources 0.08 ▲ 20% (30%) 10 8 7 NA Duketon Mining 0.17 ▼ (3%) (35%) 13 7 6 NA Legend Mining 0.007 ▼ (13%) 0% 14 7 7 NM Matsa Resources 0.165 ▼ (13%) (3%) 24 3 23 NA Metallica Minerals 0.066 ▼ (6%) 20% 11 1 10 NA Pioneer Resources 0.016 ▼ (11%) 23% 11 1 9 NA Poseidon Nickel 0.10 ▼ (8%) (19%) 66 4 83 NA Segue Resources 0.005 — 0% 0% 10 1 9 NA St George Mining 0.065 ▼ (11%) 3% 7 1 6 NA Sirius Resources 2.62 ▲ 5% 2% 895 59 650 NM Talisman Mining 0.17 ▲ 3% 6% 22 16 7 NA Winward Resources 0.24 ▼ (35%) 47% 25 6 22 NA Code Company Name Close Price Week Δ YTD Δ 52 Week Range Market Cap (A$m) Cash (A$m) TEV (A$m) TEV/ EBITDA ABY Aditya Birla Minerals 0.19 — 0% (5%) 58 137 (46) NA HGO Hillgrove Resources 0.35 ▼ (1%) (23%) 51 9 61 1.3x KBL KBL Mining 0.025 ▲ 14% (17%) 12 7 35 NA MWE Mawson West 0.055 ▲ 38% 10% 22 21 71 NM OZL OZ Minerals 3.91 ▲ 2% 12% 1,187 219 968 2.8x PNA PanAust 1.74 ▼ (1%) 23% 1,124 74 1,346 NM SFR Sandfire Resources 4.38 ▲ 3% (4%) 683 58 768 NA SRQ Straits Resources 0.004 ▼ (20%) (20%) 5 13 162 NA TGS Tiger Resources 0.053 ▼ (4%) (59%) 61 80 269 5.8x 985 CST Mining 0.065 ▲ 18% 48% 1,761 136 668 1.6x 1208 MMG 3.23 ▲ 5% 35% 17,085 251 88,756 15.3x 3993 China Molybdenum 7.86 ▼ (5%) 75% 76,941 9,326 78,502 20.4x Code Company Name Close Price Week Δ YTD Δ 52 Week Range Market Cap (A$m) Cash (A$m) TEV (A$m) AOH Altona Mining 0.105 ▲ 5% (56%) 56 129 (73) ARE Argonaut Resources 0.007 ▼ (22%) (56%) 3 1 2 AVB Avanco Resources 0.083 ▲ 19% 9% 138 20 118 AVI Avalon Minerals 0.025 ▼ (17%) 25% 4 1 3 AZS Azure Minerals 0.014 — 0% (42%) 14 1 0 CDU CuDeco (suspended) 1.41 — 0% (28%) 384 7 439 CVV Caravel Minerals 0.007 — 0% (13%) 5 1 5 ENR Encounter Resources 0.10 ▲ 2% (27%) 13 4 11 ERM Emmerson Resources 0.027 ▲ 8% (13%) 10 2 7 FND Finders Resources 0.15 ▼ (6%) 0% 99 48 99 GCR Golden Cross Resources 0.059 ▼ (2%) (16%) 6 2 5 GPR Geopacific Resources 0.040 ▲ 14% (23%) 15 4 11 HAV Havilah Resources 0.26 ▲ 11% 82% 40 3 37 HCH Hot Chili 0.11 ▼ (4%) (31%) 38 6 44 HMX Hammer Metals 0.083 ▼ (2%) 1% 8 1 8 IAU Intrepid Mines 0.11 ▼ (4%) (19%) 41 74 (33) KDR Kidman Resources 0.046 ▲ 15% (31%) 6 3 5 KGL KGL Resources 0.13 ▼ (11%) (44%) 18 9 9 MEP Minotaur Exploration 0.09 ▼ (1%) (36%) 17 5 11 MNC Metminco 0.005 ▲ 11% (38%) 10 1 9 MTH Mithril Resources 0.006 — 0% (14%) 3 2 1 PEX Peel Mining 0.085 ▲ 16% 23% 11 3 9 RDM Red Metal 0.040 ▼ (2%) (51%) 7 2 3 RER Regal Resources 0.032 ▼ (20%) (30%) 7 2 4 RTG RTG Mining 0.570 ▲ 6% (2%) 77 2 74 RXM Rex Minerals 0.085 ▲ 1% (23%) 19 3 11 SMD Syndicated Metals 0.020 — 0% (38%) 5 2 4 SRI Sipa Resources 0.070 ▼ (7%) 89% 43 4 42 SUH Southern Hemisphere 0.010 — 0% (77%) 2 2 2 THX Thundelarra Resources 0.099 ▲ 11% (10%) 32 7 24 XAM Xanadu Mines 0.093 ▼ (7%) (7%) 35 8 34 Company Name Close Price Week Δ YTD Δ 52 Week Range Market Cap (A$m) Cash (A$m) TEV (A$m) Aeon Metals 0.090 ▲ 11% (10%) 27 5 39 DGR Global 0.036 ▼ (10%) 13% 15 0 17 Heron Resources 0.13 ▲ 4% 4% 47 28 22 Ironbark Zinc 0.100 ▲ 6% 25% 44 3 41 Impact Minerals 0.017 ▲ 31% (29%) 10 1 7 Investigator Resources 0.011 — 0% (31%) 5 3 0 MacPhersons Resources 0.120 ▲ 4% (4%) 38 5 33 Phoenix Copper 0.014 ▼ (18%) (53%) 5 3 2 Red Metal 0.040 ▼ (2%) (51%) 7 8 (1) Red River Resources 0.14 ▼ (4%) 23% 24 4 20 Rox Resources 0.030 — 0% 7% 26 3 23 Terramin Australia 0.105 ▼ (9%) (5%) 159 1 158 Variscan Mines 0.011 ▼ (45%) (55%) 3 2 2 Venturex Resources 0.004 — 0% (20%) 6 1 5 Code Company Name Close Price Week Δ YTD Δ 52 Week Range Market Cap (A$m) Cash (A$m) TEV (A$m) TEV/ EBITDA AGD Austral Gold 0.15 ▲ 85% 15% 72 NA 63 NA ALK Alkane Resources 0.25 ▼ (11%) 14% 104 16 85 NA AMI Aurelia Metals 0.26 ▲ 2% 6% 99 22 200 NA BDR Beadell Resources 0.23 ▲ 7% 0% 180 13 285 4.4x BOK Black Oak Minerals 0.36 ▼ (10%) 33% 16 11 30 NA DRM Doray Minerals 0.44 — 0% (8%) 105 16 104 NA EVN Evolution Mining 0.93 ▲ 5% 44% 667 32 796 3.9x IGO Independence Group 5.57 ▲ 11% 26% 1,305 57 1,213 NA KCN Kingsgate Consolidated 0.69 ▼ (3%) 4% 153 54 236 NA KRM Kingsrose Mining 0.27 ▲ 23% 6% 97 7 107 NA LSA Lachlan Star 0.024 — 0% 20% 4 2 22 NA MIZ Minera Gold 0.002 — 0% (33%) 6 0 11 NA MLX Metals X 1.28 ▼ (2%) 62% 530 57 423 NA MML Medusa Mining 0.90 ▼ (4%) 38% 186 13 179 NA MOY Millennium Minerals 0.028 — 0% (24%) 6 2 42 NM NCM Newcrest Mining 14.18 ▲ 1% 30% 10,869 141 15,286 NA NGF Norton Gold Fields 0.20 ▼ (15%) 56% 182 19 309 4.8x NST Northern Star Resources 2.20 ▼ (4%) 48% 1,304 82 1,276 NA OGC OceanaGold Corp. 2.24 ▼ (12%) 11% 674 NA 756 2.6x PGI PanTerra Gold 0.170 ▲ 13% (6%) 14 3 77 NM PRU Perseus Mining 0.30 ▲ 2% 13% 155 37 121 2.1x RMS Ramelius Resources 0.140 ▼ (3%) 175% 66 12 48 NA RRL Regis Resources 1.29 ▼ (1%) (33%) 642 7 652 NA RSG Resolute Mining 0.26 ▼ (2%) (2%) 167 19 198 NA SAR Saracen Mineral Holdings 0.45 ▲ 5% 76% 357 36 337 NA SBM St Barbara 0.32 — 0% 200% 156 79 479 NA SLR Silver Lake Resources 0.18 ▼ (5%) (10%) 88 24 95 NA TBR Tribune Resources 3.50 ▼ (1%) 32% 175 11 190 11.0x TRY Troy Resources 0.46 ▼ (1%) 0% 90 43 130 NA UML Unity Mining 0.011 ▲ 16% 57% 12 7 0 NA Code Company Name Close Price Week Δ YTD Δ 52 Week Range Market Cap (A$m) Cash (A$m) TEV (A$m) AYC A1 Consolidated 0.035 — 0% (13%) 10 0 9 ABU ABM Resources 0.25 ▲ 7% (15%) 84 11 73 AWV Anova Metals 0.046 — 0% 70% 13 1 12 AZM Azumah Resources 0.025 ▼ (7%) 25% 10 4 9 BLK Blackham Resources 0.145 ▼ (6%) 184% 26 3 23 BSR Bassari Resources 0.010 ▼ (9%) (17%) 13 0 13 CHN Chalice Gold Mines 0.12 ▼ (4%) 10% 33 43 (10) CHZ Chesser Resources 0.033 — 0% (8%) 7 1 3 DCN Dacian Gold 0.50 ▲ 6% 79% 48 8 41 EXC Exterra Resources 0.020 ▲ 67% 54% 4 1 3 EXG Excelsior Gold 0.090 ▼ (9%) 48% 42 2 41 FML Focus Minerals 0.007 — 0% (7%) 59 9 50 GCY Gascoyne Resources 0.087 ▼ (4%) 23% 16 1 15 GMR Golden Rim Resources 0.008 ▼ (6%) 60% 12 1 11 GOR Gold Road Resources 0.36 ▲ 3% 47% 214 21 193 GRY Gryphon Minerals 0.060 — 0% (6%) 24 34 0 IDC Indochine Mining 0.006 — 0% (50%) 8 0 10 KGD Kula Gold 0.042 ▼ (2%) (5%) 11 3 8 MSR Manas Resources 0.014 ▼ (13%) 0% 7 0 7 MUX Mungana Goldmines 0.130 — 0% 4% 31 5 36 OGX Orinoco Gold 0.072 ▼ (3%) 24% 11 1 10 PNR Pacific Niugini 0.075 ▼ (6%) 50% 29 1 28 PXG Phoenix Gold 0.072 ▼ (15%) (27%) 31 6 25 RED Red 5 0.115 ▲ 15% 25% 87 38 70 RNI Resource & Investment 0.040 ▼ (20%) (47%) 20 5 37 RNS Renaissance Minerals 0.040 ▼ (2%) (38%) 16 4 12 SAU Southern Gold 0.012 — 0% 50% 6 1 6 SIH Sihayo Gold 0.015 ▲ 25% 88% 17 0 12 TAM Tanami Gold 0.034 ▲ 6% 143% 40 1 50 WAF West African Resources 0.086 ▲ 26% (14%) 23 3 23 WPG WPG Resources 0.035 — 0% (8%) 10 3 6