Downloaded 31 times

![Resource Capital Research
Contents
Contents .............................................................................................................................. 2
Overview and Investment Comment ........................................................................................ 3
RCR October Featured Copper Company Summary .................................................................... 4
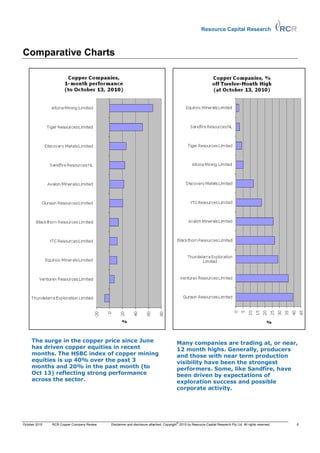
Comparative Charts ............................................................................................................... 6
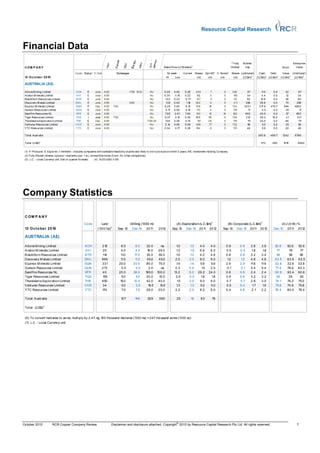
Financial Data ....................................................................................................................... 7
Company Statistics ................................................................................................................ 7
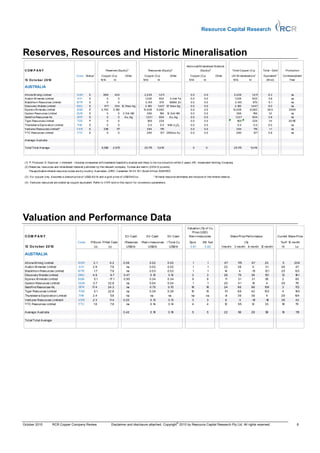
Reserves, Resources and Historic Mineralisation ........................................................................ 8
Valuation and Performance Data ............................................................................................. 8
Exploration, Development and Production Companies
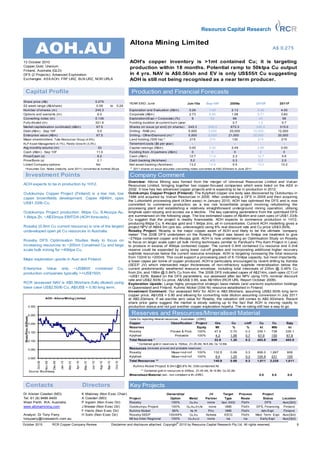
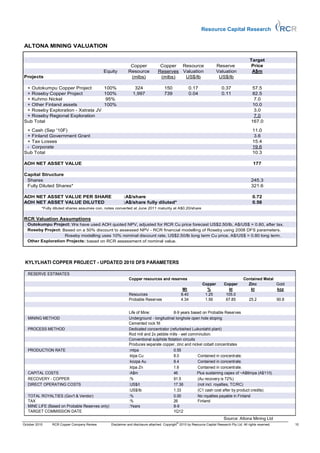
Altona Mining Limited................................................................................................... 9
[Avalon Minerals Limited .....................................................................................………….]
[Blackthorn Resources Limited ......................................................................... ………………]
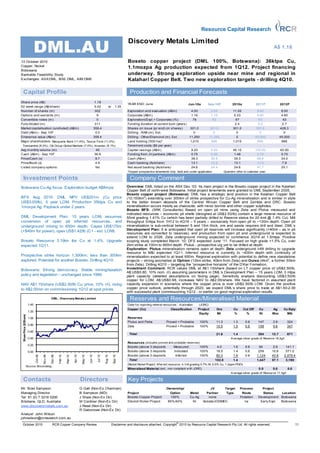
Discovery Metals Limited ............................................................................................ 11
Equinox Minerals Limited* .......................................................................................... 13
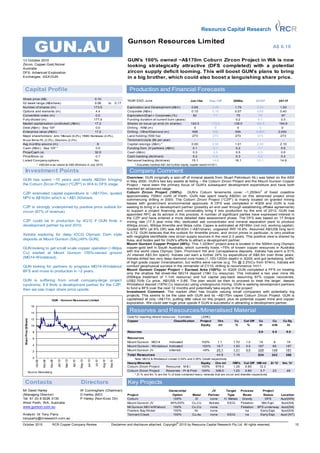
Gunson Resources Limited .......................................................................................... 15
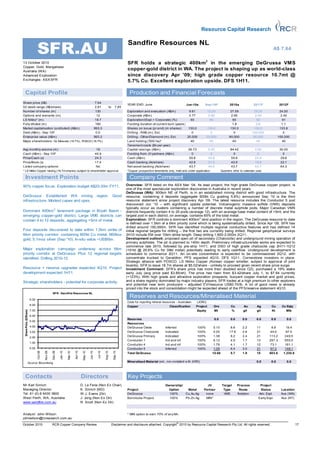
Sandfire Resources NL ............................................................................................... 17
[Thundelarra Exploration Limited............................................................................... …..]
[Tiger Resources Limited ............................................................................................ …]
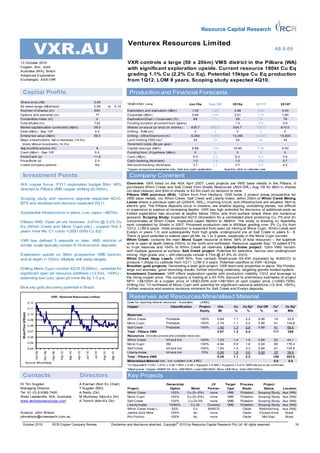
Venturex Resources Limited........................................................................................ 19
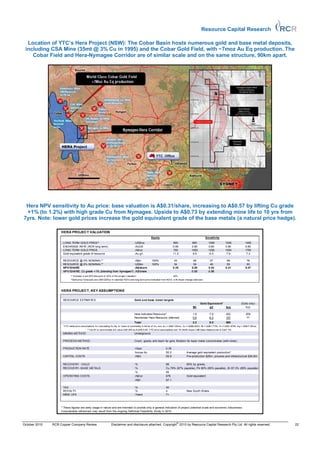
YTC Resources Limited ............................................................................................... 21
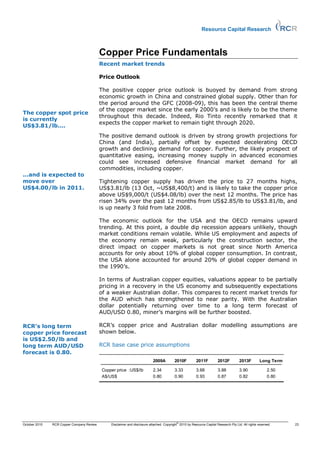
Copper Price Fundamentals................................................................................................... 23
[Smelting and Refining - TC/RCs……………………………………………………………………………………………….….…….37]
[Copper Property Transactions: Global 2010 (January 1 to September 24)…………………………………………]
[Copper Capital Raisings: Global 2010 (January 1 to September 27)……........................................]
[Copper Company Share Price Performance Tables ..................................................................... ]
Report Contributors ............................................................................................................. 33
Disclosure and Disclaimer ..................................................................................................... 34
* Indicates companies with detailed financial projections and valuation available.
[This is the Abridged Report version of the October RCR Copper Company Review. The quarterly purchase price
to all RCR’s Subscriber Reports (uranium, gold, rare and minor metals, and iron ore) is A$110. The annual
subscription rate to all RCR research is A$440 – commodities covered may vary from quarter to quarter.
Purchase details and research services for institutional investors can be found at www.rcresearch.com.au].
©
October 2010 RCR Copper Company Review Disclaimer and disclosure attached. Copyright 2010 by Resource Capital Research Pty Ltd. All rights reserved. 2](https://image.slidesharecdn.com/rcrquarterlyreportoct10abridgedcopper-101018002352-phpapp02/85/RCR-Quarterly-Report-Oct-10-Copper-3-320.jpg)
![Resource Capital Research
[THIS PAGE LEFT BLANK INTENTIONALLY]
©
October 2010 RCR Copper Company Review Disclaimer and disclosure attached. Copyright 2010 by Resource Capital Research Pty Ltd. All rights reserved. 30](https://image.slidesharecdn.com/rcrquarterlyreportoct10abridgedcopper-101018002352-phpapp02/85/RCR-Quarterly-Report-Oct-10-Copper-31-320.jpg)
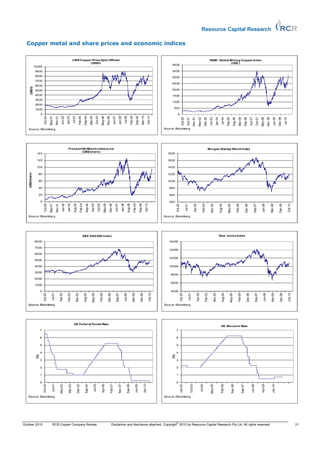
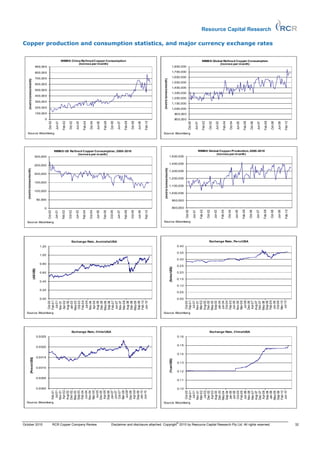

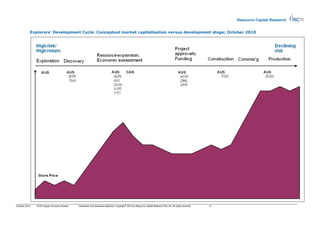
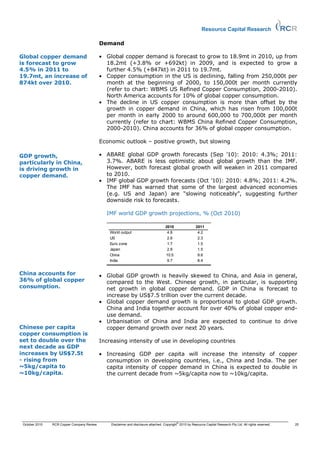
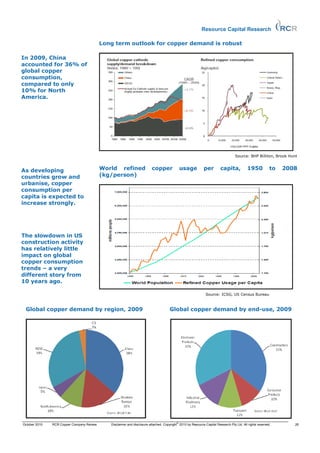
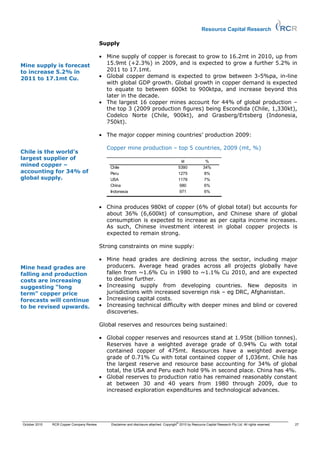
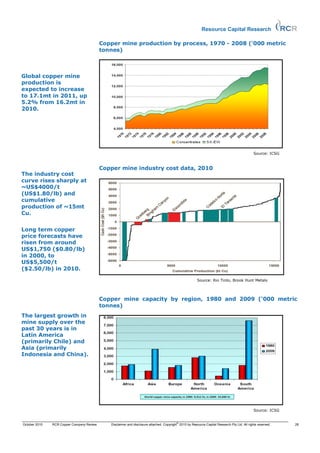
This document provides an overview and analysis of copper mining companies by Resource Capital Research. It includes commentary on the copper price outlook, performance of copper equities, and featured company summaries. 10 Australian copper exploration, development and production companies are reviewed, with details on their share price, market capitalization, cash/debt positions, and project status. The copper price is at a 27-month high and demand is expected to remain strong due to growth in China and a tight supply outlook. [END SUMMARY]


![Outlook for the coke market in 2010 & onward [Met Coke 2009]](https://cdn.slidesharecdn.com/ss_thumbnails/03jonespresentation-110805125247-phpapp01-thumbnail.jpg?width=640&height=640&fit=bounds)


