SlideShare a Scribd company logo
1 of 42
Download to read offline
Key prices in Europe
World Bulk
Ferro-alloys Markets
Contents
Price forecast in key global markets
Metal Expert
Issue 11 (43)
the price trend may only reverse in H2 next year
Monthly report
Region Alloy’s grade
Term
of delivery
Aug 15 Sep 15 Oct 15 Nov 15 Dec 15* Jan 16* Feb 16*
India
SiMn (65% Mn; 16% Si;
2% C max; 0,2-0,3% P)
$/t, fob 807 760 750 703 675 640 640
Europe
SiMn (65% Mn; 17% Si;
2% C max; 0,17% P)
EUR/t, ddp 811 765 690 642 615 600 600
China FeSi (75% Si) $/t, fob 1210 1165 1140 1130 1115 1125 1125
Europe HC FeCr (60-65% Cr; 6-8% C) $/lb Cr, ddp 0,94 0,87 0,88 0,83 0,81 0,81 0,83
*-forecast	
Source: Metal Expert
0,82
0,85
0,88
0,91
0,94
0,97
1,00
1,03
1,06
1,09
1,12
550
650
750
850
950
1050
1150
1250
1350
Jan15
Mar15
May15
Jul15
Sep15
Nov15
USD/lbCr,ddp
EUR/t,ddp
SiMn (65% Mn; 17% Si)
FeSi (75% Si)
HC FeCr (60-65% Cr)
November, 2015
Actual topic	 2
Prices	 4
Manganese
Global market for Mn ore	 6
European SiMn market	 10
European FeMn market	 14
US Mn alloys markets	 17
Turkish Mn alloys markets	 20
Indian Mn alloys markets	 22
Asian Mn alloys market	 25
Silicon
European FeSi market	 30
US, Turkish & Japanese FeSi market	 33
Chrome
European FeCr market	 35
European & US FeCr market	 38
Japanese FeCr market	 40
NOTICE! At the moment of publication, Metal Expert learnt about the completion of investigation of the EEC into SiMn
shipments from Ukraine to Russia. As a result of it, the regulator recommended the countries of the EEU, namely
Russia, Kazakhstan, and Belarus, impose a 26.35% antidumping duty against Ukrainian material. This may cause
notable changes in manganese alloy sales in both the domestic and global markets. Metal Expert’s estimation will
be published as a separate research.
World Bulk Ferro-alloys Markets November, 2015
© Metal Expert
2
Actual topic
Ferroalloy prices set to bottom out
Ferroalloy prices have kept decreasing in the global market this month. Man-
ganese alloy prices have lost 5% in India, 8% in Europe and the USA, and 4%
in Turkey and Asia. Silicon alloys have got some 3% cheaper all over the world
and chrome alloys – 4% cheaper.
The decreasing trend is explained by sluggish demand and oversupply.
According to the WSA, carbon steel production dropped by 3% year-on-year in
October. Chinese output declined by 2.2% and is now falling at a faster pace.
Lower supply should have resulted in the margin recovery, but the oversupply
kept pushing finished steel prices down. Specifically, prices for Chinese HRC
lost $14/t reaching $256‑266/t ex-warehouse VAT excluded and export quota-
tions – $260‑270/t FOB including taxes. No price recovery is possible right now
in light of excessive supply coupled with lowering consumption in the Chinese
domestic market. In order to maintain capacity utilization, the Chinese keep en-
larging exports, offering the material at very low prices. The majority of Chinese
steelmakers keep working at a loss in both the domestic and export markets.
In order to prevent further losses, they tried to push long prices up last month,
but in vain. The only to recover the margin is to reduce raw material prices, but
it will not result in a margin recover as raw materials are already very cheap.
The markets for metallurgical raw materials (excluding ferroalloys) and finished
steel seem to have reached the price bottom already. In December, a slight
decrease is likely to take place, but in general Chinese, Asian, European, and
Turkish steelmakers have been working at a loss for quite a long time, except
for some US companies. Whereas in early 2014 the price dynamics in the global
ferroalloy market was in accordance with the metallurgical price trend, since
May 2015 the decreasing price trend has slowed down because of the temporal
stabilization in manganese ore quotations and some speculations. In H2, global
prices for steel products, billets and scrap have lost some 30%, whereas those
for SiMn – only 16%. In September-October, manganese ore prices slipped
and the quotes for December are already voiced below the level of production
expenses. Thus, ferroalloy prices will inevitably go down, following the decrease
in steel product markets in August-October. Ferroalloy markets will only stabilize
in February, whereas the price trend may only reverse in H2 next year.
World Bulk Ferro-alloys Markets November, 2015
© Metal Expert
3
Mn
Ferroalloy prices seem to have room for decrease further,
$ per tonne
Back to top
0
200
400
600
800
1000
1200
100
200
300
400
500
600
Jan 14 May 14 Sep 14 Jan 15 May 15 Sep 15
HRC Steel scrap billet SiMn, R
World Bulk Ferro-alloys Markets November, 2015
© Metal Expert
4
Mn
Region/alloy
Term
of delivery
Jun 15 Jul 15 Aug 15 Sep 15 Oct 15 Nov 15
SILICOMANGANESE
Europe, contract prices,
65% Mn; 17% Si; 0,17% P
EUR/t, ddp 800 800 800 770 770 770
Europe, spot prices,
65% Mn; 17% Si; 0,17% P
EUR/t, ddp 814 812 811 765 690 642
North, spot prices,
65% Mn; 17% Si; 0,17% P
EUR/t, ddp 812 812 810 762 688 640
South, spot prices,
65% Mn; 16% Si; 0,2-0,3% P
EUR/t, ddp 808 789 788 767 687 621
East, spot prices,
65% Mn; 17% Si; 0,17% P
EUR/t, ddp 816 808 814 775 695 647
USA,
65% Mn; 17% Si
$/t, ddp 1155 1095 1075 985 937 860
China,
65% Mn; 17% Si
$/t, exw 868 848 790 740 715 675
China,
65% Mn; 17% Si
$/t, fob 1520 1520 1520 1520 1520 1520
India,
65% Mn; 16% Si
$/t, fob 820 821 807 760 750 703
South Korea,
65% Mn; 16% Si
$/t, fob - - - - - -
Turkey,
70% Mn; 17% Si from Ukraine
$/t, cif 905 905 890 860 814 785
Turkey,
70% Mn; 17% Si from Georgia
$/t, cif 1025 1025 1010 1005 950 -
Turkey,
65% Mn; 16% Si from India
$/t, cif 847 850 845 810 760 725
Turkey,
60% Mn; 14% Si from India
$/t, cif 775 775 767 745 700 680
Japan,
65% Mn; 16% Si
$/t, cif 835 835 825 770 760 720
HC FERROMANGANESE
Europe, contract prices,
78% Mn
EUR/t, ddp 770 770 770 745 745 745
Europe, spot prices,
78% Mn
EUR/t, ddp 770 760 776 745 700 659
USA,
78% Mn
$/t, ddp 935 900 850 835 825 810
China,
75% Mn
$/t, exw 907 873 800 770 725 632
China,
75% Mn
$/t, fob 1500 1500 1500 1500 1500 1500
India,
75% Mn
$/t, fob 783 770 750 720 700 670
South Korea,
75% Mn
$/t, fob 800 785 740 710 660 640
Japan,
75% Mn
$/t, cif 799 795 765 730 718 660
Prices
Dynamics of bulk ferro-alloys prices in world markets
World Bulk Ferro-alloys Markets November, 2015
© Metal Expert
5
Note: monthly average spot prices unless other mentioned; contract prices effective for delivery period of over three months,
spot ones – for shipments within 1 month
Source: Metal Expert
Region/alloy
Term
of delivery
Jun 15 Jul 15 Aug 15 Sep 15 Oct 15 Nov 15
MC FERROMANGANESE
Europe, contract prices,
82% Mn
EUR/t, ddp 1190 1190 1190 1135 1135 1135
Europe, spot prices,
82% Mn
EUR/t, ddp 1185 1185 1185 1135 1060 1040
FERROSILICON
Europe, contract prices,
75% Si
EUR/t, ddp 1225 1225 1225 1170 1170 1170
Europe, spot prices,
75% Si
EUR/t, ddp 1225 1205 1185 1170 1070 975
China,
75% Si
$/t, fob 1210 1210 1210 1165 1140 1130
USA,
75% Si
$/t, ddp 1390 1380 1370 1330 1275 1150
Turkey,
75% Si from China
$/t, cif 1260 1260 1245 1212 1080 1065
Turkey,
75% Si from Vietnam
$/t, cif 1132 1143 1125 1078 1015 965
Turkey,
72% Si from Vietnam
$/t, cif 1095 1107 1107 1025 960 940
Turkey,
70% Si from Vietnam
$/t, cif 1065 1075 1075 1000 940 915
Turkey,
75% Si from Russia
$/t, cif 1187 1190 1125 1113 1055 1005
Turkey,
65% Si from Russia
$/t, cif 1060 1060 1030 1010 930 905
Turkey,
65% Si from Ukraine
$/t, cif 1085 1085 1085 1085 985 985
Turkey,
70% Si from India
$/t, cif 1120 1135 1175 1138 1110 1090
FERROCHROME
Europe,
Charge chrome
$/lb Cr 1,08 1,08 1,08 1,08 1,04 1,04
Europe,
HC, 60-65% Cr, 6-8% C
$/lb Cr, ddp 0,95 0,94 0,94 0,87 0,88 0,83
Europe,
LC, 68-70% Cr; 0.10% C
$/lb Cr, ddp 2,01 2,00 1,99 1,98 1,96 1,90
Japan,
Charge chrome
$/lb Cr 1,16 1,16 1,16 1,16 1,12 1,12
Japan,
LС, 65% Cr, 0.10% C
$/lb Cr, ddp 2,00 1,98 1,97 1,97 1,95 1,90
India,
HC, 60% Cr, 6-8% C
$/lb Cr, fob 0,82 0,80 0,79 0,74 0,72 0,70
USA,
HC, 60-65% Cr, 6-8% C
$/lb Cr, ddp 1,08 1,08 1,08 1,05 1,03 0,98
USA,
LC, 0.10% C
$/lb Cr, ddp 2,06 2,06 2,06 2,06 2,05 2,01
Back to top
World Bulk Ferro-alloys Markets November, 2015
© Metal Expert
6
Mn
Price forecast for manganese ore (46% Mn)
CIF China
Price forecast for manganese ore (38% Mn)
CIF China
3,20
3,20
3,20
3,10
2,70
2,70*
2,60
2,60
2,60
2,00
2,50
3,00
3,50
Jul15
Aug15
Sep15
Oct15
Nov15
Dec15
Jan16
Feb16
Mar16
USD/dmtu
2,70
2,65
2,65
2,65
2,50*
2,40*
2,40
2,40
2,40
1,50
2,00
2,50
3,00
3,50
Jul15
Aug15
Sep15
Oct15
Nov15
Dec15
Jan16
Feb16
Mar16
USD/dmtu
Global market for Mn ore
Prices for December shipments of manganese ore have not been announced
at the time of publication of this report. South32 cut November prices for the
material (45.5% Mn) to $2.7/dmtu, down $0.4/dmtu from October, and those
for the material (48% Mn) to $2.5/dmtu. Eramet has reduced quotations of the
material (44% Mn) by $2.4/dmtu. According to Metal Expert’s data, the material
(38% Mn) is not shipped to China right now. All prices are CIF China.
Last month, steel output rose by 2% quarter-on-quarter, losing 3% year-
on-year though. In 10 months, the decrease was 2.5% y-o-y against 2.4% y-o-y
in 9 months. Chinese output declined by 2.2% to 672.8 million t in 10 months.
Global output (excluding China) came down by 2.8% to 670.8 million t. Steel
production is believed to keep decreasing together with manganese demand.
According to preliminary data, global manganese ore sales dropped by 5%
year-on-year to 19.6 million t throughout January-September. Imports to China
dropped by 5% to 11.8 million t and those to India – by 34% to 1.7 million t. The
countries that have vertically integrated producers raised imports. Ukraine raised
shipments from abroad by 47% to 1 million t, Norway – by 4% to 900,000 tpy,
and France – by more than 2 times to 400,000 t. Nonetheless, these upturns are
only just for in-house shipments and have no impact on the global free market.
Imports to South Korea and Japan rose by a total of 6% to 1.9 million t.
* - Metal Expert’s estimate
World Bulk Ferro-alloys Markets November, 2015
© Metal Expert
7
Mn
Comparison of global Mn ore trade and steel ouput
1.5
1.7
1.9
2.1
2.3
2.5
2.7
2.9
May14
Jun14
Jul14
Aug14
Sep14
Oct14
Nov14
Dec14
Jan15
Feb15
Mar15
Apr15
May15
Jun15
Jul15
Aug15
Sep15
125
127
129
131
133
135
137
139
141
143
145Mn ore world trade World steel production, R
'000t
'000t
Global manganese ore sales will keep decreasing because steel production is
supposed to keep declining. Over the whole year, sales will reach 26 million t
against 27 million t in 2014.
Low profitability will result in production optimization by the biggest
companies, and some facilities will be stopped. This month, South32 has
closed Mamatwan mine, having plans on bringing it back on stream in Janu-
ary. However, production at the company’s assets will drop by no more than
1.5% to 8.5 million t this year. Eramet raised output by 12% year-on-year and
8% quarter-on-quarter to 1.07 million t in Q3. Vale’s output was unchanged in
annual compassion, adding 18% q-o-q though.
China’s port stocks have almost stopped decreasing. In November, it reached
2.87 million t, down 0.2% m-o-m, which is comparable to 2-month imports.
The stocks have been minimal since February 2014. Demand continues to fall.
Production of SiMn reached 373,000 t in October, down 8.8% m-o-m, and that
of FeMn – 116,000 t, down 15.7%.
World Bulk Ferro-alloys Markets November, 2015
© Metal Expert
8
Mn
China’s port stocks of Mn ore get stabilized
2,0
2,2
2,4
2,6
2,8
3,0
3,2
3,4
3,6
3,8
4,0
2,0
2,5
3,0
3,5
4,0
4,5
5,0
5,5
6,0
6,5
7,0
Apr11
Sep11
Feb12
Jul12
Dec12
May13
Oct13
Mar14
Aug14
Jan15
Jun15
Nov15
mt
USD/dmtu
Mn ore stockpiles in ports
price for Mn ore (48% Mn)
Taking into account Metal Expert’s calculation of the cost of mining for the biggest
producers, it is obvious that the companies with low inputs enlarge manufacture
and the others, on the contrary, reduce it. Thus, the most effective producers
are trying to raise their market share and force the rivals from the business.
The average input cost of the ore (46% Mn), including transportation to Chinese
ports, will be $2.26.dmtu this year.
Manganese ore demand will keep slackening over the period under review.
In January, it will reach its 3-year lowest because of the decrease in global
steel output, so prices will most likely come down.
Back to top
World Bulk Ferro-alloys Markets November, 2015
© Metal Expert
9
Mn
Back to top
Note: in ‘000 tonnes
Note: $/mtu
Source: Metal Expert
Q2 13 Q3 13 Q4 13 Q1 14 Q2 14 Q3 14 Q4 14 Q1 15 Q2 15
South32 (BHP Billiton)
Australia 1307 1182 1256 1019 1319 1210 1289 1136 1268
Africa 939 864 944 782 936 1049 1007 913 820
Assore/ARM (Assmang)
Africa 858 864 864 816 816 744 744 810 780
ENRC
Kazakhstan 1111 1241 942 759 1058 982 888 452 595
Eramet Comilog
Gabon 908 969 966 796 849 961 846 880 997
Vale
Brazil 617 621 638 470 505 654 723 592 554
Privat
Ukraine 326 294 198 183 282 387 390 145 362
MOIL
India 252 231 312 340 273 241 308 317 276
Ghana Manganese Company
Ghana 445 484 458 454 455 436 160 310 396
Consolidated Minerals
Australia 418 407 401 406 416 436 443 404 371
OM Holdings
Australia 208 151 272 222 225 251 192 158 191
Africa 166 226 264 394 535 538 543 474 509
Mineracao Buritirama, Maraba
Brazil 63 63 63 63 63 63 63 63 63
Renova (Kalahari Desert)
Africa 675 675 675 675 675 675 675 675 675
Dynamics of Mn ore prices in world markets
Global manganese ore production
Term
of delivery
May 15 Jun 15 Jul 15 Aug 15 Sep 15 Oct 15 Nov 15
Import to China (Australia, 48% Mn) CIF 3,03 3,03 3,03 3,00 3,00 3,00 2,50
Import to China (Australia, 46% Mn) CIF 3,20 3,20 3,20 3,20 3,20 3,10 2,70
Import to China (South Africa, 38% Mn) CIF 2,70 2,70 2,70 2,65 2,65 2,65 -
World Bulk Ferro-alloys Markets November, 2015
© Metal Expert
10
Mn
European SiMn spot prices forecast
814
812
811
765
690
642
615
600
600
500
600
700
800
900
Jun15
Jul15
Aug15
Sep15
Oct15
Nov15
Dec15
Jan16
Feb16
EUR/t,ddp
European SiMn market
Contrary to expectations, offers have not stabilized this month. The average
weighted benchmark price for SiMn (65% Mn; 17% Si) has dropped from last
month’s EUR 690/t DDP to EUR 642/t DDP on the back of low consumption, the
collapse of manganese ore quotes, and the availability of stockpiles.
SiMn surplus persisted in the European market since May, when imports from
India and Ukraine increased despite comparatively stable end use. Speculations
over the possible imposition of an antidumping duty against Indian material in
September started then, too. It seems like European traders hurried to restock
on the alloy beforehand. Fearing that a duty on Ukrainian shipments in Russia
may be imposed, Ukrainian merchants tried to partially redirect sales to Europe,
although the strengthening of the hryvnia was against them. In May, Europe
raised imports by 68,000 t, which is the 2-year maximum. By September, SiMn
surplus reached 28,000 t (30% of the average monthly consumption). The market
will become balanced in late 2015, Metal Expert believes. The material leftover
will not exceed 5,000-10,000 t.
World Bulk Ferro-alloys Markets November, 2015
© Metal Expert
11
Mn
European SiMn market balance
-60
-40
-20
0
20
40
60
Q314
Q414
Q115
Q215
Q315*
Q415*
Q116*
'000tonnes
Source: Metal Expert*- forecast
SiMn shipments from abroad will come down. Imports reached a local mini-
mum of 40,000 t back in September. Purchases were at this level last September,
but this year steel output dropped by almost 4% (1 million t) year-on-year. Indian
merchants have been working at a loss for quite a long time and they are unable
to compete with Ukrainian and South African suppliers. Besides, the quality of
Indian alloys is worse than that of the analogs. In H2, shipments from India to
Europe reached 10,000-13,000 tpm against 18,000 tpm averagely in H1. The
dynamics of shipments from Ukraine is the quite the same.
Ukraine and South Africa have been forcing India from the European SiMn market
for the past 3 years. In 2013, India was the biggest importer of the alloy, covering
38% of all foreign shipments, whereas the shares of Ukraine and South Africa
were 19% and 6% respectively. Last year, Indian companies lost 9 percentage
points, securing 20% of European imports to themselves, whereas Ukrainian
and South African merchants raised their shares to 27% and 17% respectively.
By Metal Expert’s preliminary estimate, in 2015 Ukraine and India will come in
par, securing 30% each, whereas South African share will approximate 16%. It
will be easier for Ukrainian and South African companies to compete in
the low market as they both have raw material sources of their own and
their national currencies keep devaluating.
World Bulk Ferro-alloys Markets November, 2015
© Metal Expert
12
Mn
India lost its competitiveness in Europe
(production costs comparison), $ per tonne
400
500
600
700
800
900
1000
1100
1200
1300
Jan 14 May 14 Sep 14 Jan 15 May 15 Sep 15
$/tonne
Domestic price
India
Ukraine
RSA
End user activity is unlikely to recover soon. Regional steel output will reach
169.5 million t in 2015 against 171.5 million t last year. In Q1, the output will hardly
exceed 42 million t, which is 5-6% lower than in 2013-2014 and 3% lower than
in the post-crisis first quarter of 2010. China is still the main reason behind the
negative situation in the global steel market. By late November, export prices
for Chinese HRC have reached $260-265/t FOB, $20/t below Ukrainian and
Turkish billet quotations. Besides, it is respectively $100/t and $95/t lower than
prices for European flats and longs. The Chinese keep working with negative
profitability in both the domestic and foreign markets, which is making them
lower production, but not exports. China’s steel manufacture dropped by 2.2%
month-on-month in October, the NBS reports. However, this decrease in not
enough, Metal Expert thinks.
It is still likely that European manganese alloy prices will keep decreas-
ing. Stabilization is possible during the holidays in late December – early
January, yet the price trend is not supposed to reverse until the end of Q1.
Back to top
World Bulk Ferro-alloys Markets November, 2015
© Metal Expert
13
Mn
Back to top
Source: Metal Expert	
* - forecast, ** - preliminary data
Note: in ‘000 gross tonnes 	
Apr 15 May 15 Jun 15 Jul 15 Aug 15 Sep 15** Q4 15* Q1 16*
PRODUCTION 46 47 45 44 43 48 134 129
by company
Ferroatlantica 10 10 10 10 10 10 31 30
Glencore 9 9 9 8 8 8 27 27
Eramet 23 23 23 24 24 24 71 70
OFZ 4 5 3 2 1 5 5 2
Skopski Leguri 0 0 0 0 0 0 0 0
Feral 0 0 0 0 0 0 0 0
Other 0 0 0 0 0 0 0 0
EXPORT 10 8 6 13 2 4 21 19
IMPORT 48 68 52 48 59 40 142 143
by countries
CIS 14 23 16 10 10 10 - -
India 22 18 16 13 20 10 - -
China 0 0 0 0 0 0 - -
Africa 3 7 8 18 17 4 - -
South America 2 1 0 0 0 0 - -
Middle East 0 0 0 0 0 0 - -
Other countries 8 19 12 6 12 15 - -
APPARENT CONSUMPTION 85 107 91 79 100 83 255 253
STEEL PRODUCTION 14460 15552 14746 13810 12361 13761 40166 42131
ESTIMATED CONSUMPTION 89 96 91 85 76 85 248 260
BALANCE -5 11 0 -6 24 -2 7 -7
European silicomanganese market structure
European silicomanganese market [Mn content]
Source: Metal Expert	
* - forecast, ** - preliminary data
Note: in ‘000 tonnes	
Apr 15 May 15 Jun 15 Jul 15 Aug 15 Sep 15** Q4 15* Q1 16*
Production 30 31 30 29 28 31 87 84
Export 6 5 4 8 2 3 14 12
Import 32 45 35 31 39 26 93 94
Apparent Consumption 56 71 60 52 66 55 167 166
Estimated Consumption 59 63 60 56 50 56 163 171
Balance -3 8 1 -4 16 -1 4 -4
World Bulk Ferro-alloys Markets November, 2015
© Metal Expert
14
Mn
European FeMn market
European HC FeMn spot prices forecast
770
760
776
745
700
659
645
640
640
500
600
700
800
Jun15
Jul15
Aug15
Sep15
Oct15
Nov15
Dec15
Jan16
Feb16
EUR/t,ddp
Manganese alloy prices have kept decreasing in Europe this month. The
average weighted benchmark price for HC FeMn (75% Mn) has gone down
from EUR 700/t DDP to EUR 659/t DDP on the back of low consumption and
high competition.
Prices are going down, though there is no surplus. As of late October, the
accumulated shortage has reached 10,000 t (25% of the average monthly
consumption) because of the notable decrease in imports. Imports will
stay low in winter, whereas consumption will most likely stabilize, the
deficit will continue.
European HC FeMn market balance
-60
-40
-20
0
20
40
60
Q314
Q414
Q115
Q215
Q315*
Q415*
Q116*
'000tonnes
Source: Metal Expert
*- forecast
World Bulk Ferro-alloys Markets November, 2015
© Metal Expert
15
Mn
The decrease in SiMn and FeSi prices will impact FeMn quotations. Over
the year, the alloys have got 20% cheaper, whereas FeMn has dropped only by
8%. This month, the cost of the alternative blend of HC FeMn and FeSi has been
EUR 150/t above that of SiMn (EUR 100/t over the year and EUR 65/t in Q1).
FeMn imports are unlikely to come up in the near future. At South Af-
rica’s South32, three out of the four installed furnaces are still idle. Assmang’s
equipment is out of operation, too. Besides, South32 has suspended mining
at Mamatwan until January at least. The material from Wessels mine will most
likely be exported and the ore to cover the company’s own needs will be limited.
FeMn production is unlikely to change in Europe. Production cutbacks mean
an increase the fixed costs in the inputs, which is unacceptable for pro-
ducers right now. Such a strategy is only useful when prices bottom out and
the least effective suppliers are forced out from the market. Then, additional
cutbacks may push prices up.
Next month, the price decrease, if any, will moderate in the European FeMn
market. Prices will stabilize after Christmas holidays.
Back to top
World Bulk Ferro-alloys Markets November, 2015
© Metal Expert
16
Mn
Back to top
Source: Metal Expert. * - forecast, ** - preliminary data. Note: in ‘000 gross tonnes
European HC FeMn market structure
Apr 15 May 15 Jun 15 Jul 15 Aug 15 Sep 15** Q4 15* Q1 16*
PRODUCTION 26 25 27 28 29 24 77 76
by company
Glencore 11 11 11 11 11 11 28 30
Eramet 5 5 5 5 5 5 17 15
Ferroatlantica 8 8 8 8 8 8 23 23
OFZ 1 0 3 4 6 0 9 8
Others 0 0 0 0 0 0 0 0
EXPORT 2 1 3 0 0 1 3 2
IMPORT 17 20 16 18 18 14 34 40
by countries
CIS 3 2 3 4 4 6 - -
India 0 0 0 1 3 3 - -
China 0 0 0 0 0 0 - -
Africa 13 17 12 13 10 5 - -
South America 0 0 0 0 0 0 - -
Other countries of the world 0 0 0 1 1 1 - -
APPARENT CONSUMPTION 41 44 40 46 47 38 108 114
STEEL PRODUCTION 14460 15552 14746 13810 12361 13761 40166 42131
ESTIMATED CONSUMPTION OF HC
FEMN 44 47 45 42 37 42 122 128
BALANCE -3 -4 -4 4 9 -4 -14 -14
European MC&LC FeMn market structure
Apr 15 May 15 Jun 15 Jul 15 Aug 15 Sep 15** Q4 15* Q1 16*
PRODUCTION 24 24 24 24 24 24 67 68
by company
Eramet 21 21 21 21 21 21 59 60
Ferroatlantica 3 3 3 3 3 3 8 8
Others 0 0 0 0 0 0 0 0
EXPORT 1 1 2 1 1 1 4 4
IMPORT 4 12 4 3 4 2 14 12
by countries
CIS 0 1 0 0 0 0 - -
India 0 0 0 0 0 0 - -
China 0 0 0 0 0 0 - -
Africa 4 11 4 3 4 2 - -
South America 0 0 0 0 0 0 - -
Middle East 0 0 0 0 0 0 - -
Other countries of the world 0 0 0 0 0 0 - -
APPARENT CONSUMPTION 26 35 26 25 27 25 77 76
STEEL PRODUCTION 14460 15552 14746 13810 12361 13761 40166 42131
ESTIMATED CONSUMPTION OF MC&LC
FEMN 28 30 28 27 24 27 78 81
BALANCE -2 5 -3 -2 3 -2 -1 -5
World Bulk Ferro-alloys Markets November, 2015
© Metal Expert
17
Mn
US Mn alloys markets
US SiMn spot prices forecast US HC FeMn spot prices forecast
1155
1095
1075
985
937
860
730
720
710
500
600
700
800
900
1000
1100
1200
1300
1400
Jun15
Jul15
Aug15
Sep15
Oct15
Nov15
Dec15
Jan16
Feb16
USD/t,ddp
935
900
850
835
825
810
800
780
780
500
600
700
800
900
1000
1100
1200
Jun15
Jul15
Aug15
Sep15
Oct15
Nov15
Dec15
Jan16
Feb16
USD/t,ddp
The US spot market for manganese alloys has been weak this month. SiMn (65%
Mn; 17% Si) has been available at $0.39/lb ($860/t) DDP, down 8.2% month-
on-month, and HC FeMn (75% Mn) – at $810/t DDP, down 1.7% from October.
The recession in the global steelmaking industry still has a bad influence on the
ferroalloy market. By Metal Expert’s estimate, US carbon steel production
will reach 79.79 million t in 2015, which is a 6-year minimum. The output is
unlikely to increase in Q1, given that some local producers have stopped manu-
facture until the market strengthens. In January-March, the output will drop by
3.4% quorter-on-qourter and 6.3% year-on-year to 18.62 million t.
SiMn is still oversupplied, although the decrease in supply has been 18.5%
y-o-y over January-November and that in consumption – 9.3% y-o-y. By Metal
Expert’s estimate, SiMn stocks will reach 15,000 t by late December (some
40% of the average monthly consumption), so the market balance will be hardly
reachable during Q1.
World Bulk Ferro-alloys Markets November, 2015
© Metal Expert
18
Mn
US SiMn market balance
-50,0
-30,0
-10,0
10,0
30,0
50,0
Q214
Q314
Q414
Q115
Q215
Q315
Q415*
Q116*
'000tonnes
Source: Metal Expert
*- forecast
Imports structure is likely to change in the near future. Next quarter,
SiMn production is going to be launched at Malaysian plants Pertama Fer-
roalloys, OM Sarawak, and Sakura Ferroalloys, which will possibly ship their
material to the USA. By Metal Expert’s estimate, Malaysia will be putting out
10,000-15,000 tpm and 30,000-35,000 tpm by end-2016. From the other hand,
imports from Australia will minimize in early 2016, whereas in November its
share was 16.7%.
The price decrease may speed up in the near future. Given that the Novem-
ber decrease in European quotations has been bigger than that in the USA, the
premium value of the American market has increased by 10% month-on-month.
The strengthening of the US dollar will result in lower inputs and higher competi-
tion. The Georgian lari is unlikely to keep devaluating in the future, whereas the
South African rand will keep getting weaker. In particular, since mid-May the lari
has got a mere 2% against the dollar and rand – 20% cheaper.
SiMn prices will keep decreasing in the USA amid sluggish consumption
and tough competition among foreign suppliers.
Back to top
World Bulk Ferro-alloys Markets November, 2015
© Metal Expert
19
Mn
Back to top
Source: Metal Expert	
* - forecast, ** - preliminary data
Note: in ‘000 gross tonnes 	
Source: Metal Expert	
* - forecast, ** - preliminary data
Note: in ‘000 gross tonnes 	
Apr 15 May 15 Jun 15 Jul 15 Aug 15 Sep 15 Q4 15* Q1 16*
PRODUCTION 7 7 7 7 7 9 28 29
EXPORT 0,7 1,7 1,0 0,6 0,7 0,8 1,7 1,6
IMPORT 39 45 25 33 19 27 76 72
by countries
Georgia 14 14 0 16 2 17 13 22
Africa 12 9 12 8 7 0 36 30
Norway 2 2 5 2 3 0 1 1
Other countries 11 20 9 7 8 10 26 19
APPARENT CONSUMPTION 45 50 32 40 26 35 102 99
STEEL PRODUCTION 6413 6844 6843 7032 6936 6557 19282 18619
ESTIMATED CONSUMPTION 34 36 36 37 37 35 102 99
BALANCE 11 14 -5 2 -11 0 0 0
Apr 15 May 15 Jun 15 Jul 15 Aug 15 Sep 15 Q4 15* Q1 16*
PRODUCTION 1 1 1 1 1 1 3 3
EXPORT 2,1 1,7 1,0 1,1 1,2 1,8 4,0 4,0
IMPORT 7 36 14 10 14 9 33 43
by countries
Africa 1 22 12 6 8 5 13 12
Australia 5 0 1 0 7 0 3 9
Norway 1 0 0 1 0 0 7 7
Other countries 0 2 1 3 0 4 0 6
APPARENT CONSUMPTION 6 35 14 10 14 8 32 42
STEEL PRODUCTION 6413 6844 6843 7032 6936 6557 19282 18619
ESTIMATED CONSUMPTION 19 20 20 21 20 19 56 54
BALANCE -13 15 -6 -10 -6 -11 -24 -12
USA silicomanganese market structure
USA ferromanganese market structure
World Bulk Ferro-alloys Markets November, 2015
© Metal Expert
20
Mn
Note: in ‘000 tonnes
* - Metal Expert estimation
Turkish Mn alloys markets
Apr 15 May 15 Jun 15 Jul 15 Aug 15 Sep 15
PRODUCTION* 0,0 0,0 0,0 0,0 0,0 0,0
EXPORT 0,0 0,0 0,2 0,3 0,1 0,0
IMPORT 25,0 15,5 22,3 20,4 9,5 13,5
by suppliers
Ukraine 18,6 8,0 16,5 16,9 8,8 11,4
India 5,3 6,0 4,7 3,0 0,5 1,6
Georgia 0,1 0,5 0,1 0,4 0,2 0,5
Norway 1,0 1,0 1,0 0,1 0,0 0,0
Others 0,0 0,0 0,0 0,0 0,0 0,0
DOMESTIC MARKET 25,0 15,5 22,2 20,1 9,4 13,4
STEEL PRODUCTION 2775 2919 2844 2539 2563 2489
ESTIMATED CONSUMPTION 21,5 22,6 22,0 19,7 19,9 19,3
BALANCE 3,5 -7,1 0,2 0,4 -10,4 -5,8
Turkish SiMn market structure
Back to top
World Bulk Ferro-alloys Markets November, 2015
© Metal Expert
21
Mn
Turkish FeMn market structure
Note: in ‘000 tonnes
Back to top
Apr 15 May 15 Jun 15 Jul 15 Aug 15 Sep 15
DOMESTIC MARKET
by products and suppliers
HC FeMn 1,5 0,5 2,2 4,4 4,8 3,1
Russia 0,0 0,0 0,0 0,0 0,0 0,0
India 0,0 0,0 0,0 0,6 0,1 0,1
South Africa 0,7 0,0 0,0 0,3 0,0 0,2
Ukraine 0,3 0,0 2,1 2,6 2,2 2,2
Others 0,5 0,5 0,1 0,8 2,5 0,7
MC and LC FeMn 1,7 2,4 1,9 1,6 1,2 0,0
Norway 1,3 2,1 1,1 0,2 0,6 0,1
South Africa 0,0 0,0 0,0 0,0 0,0 0,0
South Korea 0,0 0,1 0,5 1,1 0,5 0,1
Ukraine 0,0 0,0 0,0 0,0 0,0 0,0
Others 0,3 0,2 0,3 0,3 0,1 -0,2
STEEL PRODUCTION 2775 2919 2844 2539 2563 2489
ESTIMATED HC FeMn CONSUMPTION 2,7 2,8 2,8 2,5 2,5 2,4
BALANCE -1,2 -2,3 -0,6 1,9 2,3 0,7
ESTIMATED MC FeMn and LC FeMn
CONSUMPTION
1,0 1,1 1,1 1,0 1,0 0,9
BALANCE 0,6 1,3 0,8 0,6 0,3 -1,0
World Bulk Ferro-alloys Markets November, 2015
© Metal Expert
22
Mn
Indian Mn alloys markets
SiMn spot prices forecast in India
820
821
807
760
750
703
675
640
640
600
650
700
750
800
850
Jun15
Jul15
Aug15
Sep15
Oct15
Nov15
Dec15
Jan16
Feb16
USD/t,fob
This month, Indian SiMn (65% Mn; 16% Si) has been available at $680-700/t
FOB India, down $60/t month-on-month, and the material (60% Mn; 14% Si) –
at $625-650/t FOB India, down $60/t.
Indian merchants are still pressured by sluggish demand in the global
market and intense competition. Their positions are still quite shaky in Europe
and Turkey. Despite the equalization of the chances in the competition with
the Ukrainians, the competition with the Europeans is still rather intense. The
Europeans try to offload stocks before the end of the year and thus are keener
to grant discounts. The gap between Indian and European prices could reach
EUR 50/t at times during this month. Demand will possibly burst in the middle
of Q1 as the Europeans will try to restock on the alloy before the imposition of
an antidumping duty in March. However, demand will not be strong enough for
a price recovery, taking into account the negative market picture.
The situation may be aggravated by the appearance of a new rival, Malay-
sia. A number of ferroalloy plants are going to be launched there in the future.
In Q1, SiMn production will possibly be commenced in Pertama Ferroalloys,
OM Sarawak, and Sakura Ferroalloys. At first, Malaysia is estimated to be pro-
ducing 10,000-15,000 tpm, but the output may increase to 30,000-35,000 tpm
by the end of 2016. New players plan to embrace the markets of Europe, Asia,
and the USA, low electricity tariffs and cheap raw materials to be their main
competitive advantage.
In the meantime, a lot of Indian suppliers lose their ability to further cut
offers. Most of the country’s producers have been working at a loss for the
third consecutive month. Production expenses declined by $29/t as a result of
the decrease in cost of both import and local manganese ore. Nevertheless,
the losses have increased by $19/t to $39/t this month (including all possible
World Bulk Ferro-alloys Markets November, 2015
© Metal Expert
23
Mn
compensations). Although there are no incentives for shipments to Europe, some
sellers are entering the competitive struggle there, thus suffering huge losses
(some $74/t). Within the next few months, the decrease in the alloy prices will
be faster than that in raw material quotations, so the profitability will also be on
the way down (to $30/t monthly). Only financially strong companies and those
few who have their own raw material sources will manage to survive under these
circumstances. However, they may soon reach the edge of profitability as well,
for their pricing bottom is estimated to be at $700/t FOB India.
Under the circumstances, Indian producers will either have to reduce or
stop manufacture. This year, SiMn production may total 1.47 million t (down
9.4% year-on-year) on the back of excessive supply resulting from bad de-
mand. In Q1, producers will have to cut output again because of the worsening
financial state, some will leave the market. Production may be decreased by
20,000-25,000 t as compared to the previous period to 320,000 t; the volumes
of SiMn available for export is estimated to amount to 100,000 t, down 22.5%.
However, these measures are likely to show some positive results only in mid-
or long-term perspective.
In the coming months, Indian suppliers will not be able to recover prices
because of the negative trend in the global market. However, the capabil-
ity for price cuts will be limited in view of the difficult financial state of
Indian producers.
Back to top
World Bulk Ferro-alloys Markets November, 2015
© Metal Expert
24
Mn
Back to top
Source: Metal Expert
* - forecast, ** - preliminary data
*** - volumes available for export
Note: in ‘000 gross tonnes
Indian SiMn market structure
Q1 15 Q2 15 Q3 15 Q4 15* Q1 16*
PRODUCTION 401 372 351 345 320
by company
Abhijeet Group 22 13 21 - -
Bhaskar Group 5 6 5 - -
Cosmic Ferro Alloys 5 3 3 - -
Nava Bharat Ventures Ltd. 25 7 5 - -
Other 345 345 317 - -
IMPORT 0 0 0 0 0
DOMESTIC CONSUMPTION 224 201 231 216 220
EXPORT 177 171 120 129*** 100***
by countries
Japan 41 36 27 - -
Taiwan 26 22 14 - -
Turkey 14 16 5 - -
Netherlands 10 9 5 - -
South Korea 9 7 6 - -
Thailand 8 7 7 - -
Germany 5 5 1 - -
Ukraine 1 1 1 - -
Others 63 68 54 - -
STEEL PRODUCTION 22504 22724 22347 22450 22850
World Bulk Ferro-alloys Markets November, 2015
© Metal Expert
25
Mn
Asian Mn alloys market
Japanese SiMn spot prices forecast Japanese HC FeMn spot prices forecast
835
835
825
770
760
720
700
680
680
600
650
700
750
800
850
Jun15
Jul15
Aug15
Sep15
Oct15
Nov15
Dec15
Jan16
Feb16
USD/t,CIF
799
795
765
730
718
660
630
620
620
550
600
650
700
750
800
Jun15
Jul15
Aug15
Sep15
Oct15
Nov15
Dec15
Jan16
Feb16
USD/t,CIF
The Japan’s market for manganese alloys has again collapsed this month.
Prices for Indian SiMn (65% Mn; 16% Si) have dipped by $50/t to $710-730/t
CIF Japan. Korean HC FeMn (75% Mn) has been available at $640-660/t CIF
Japan, down $65/t, and Indian material – at $660-680/t CIF Japan, down $35/t.
Like earlier, there will be no support from the consuming industry. Japan
is going to produce 106 million t of steel in FY 2016 (ends in March 2016), down
3.5% from FY 2015. As a result, consumption of SiMn will drop to 340,000 t and
that of FeMn – to 426,000 t.
Supply of FeMn is going to increase in December-February, whereas
that of SiMn will decline. Japan will produce 59,600 t of FeMn in winter (up
14.3%); SiMn production will remain at 9,300 t. Due to the usual production
cutbacks, South Korea will be able to export only 26,000 t of HC FeMn (down
17%), of which 20-30% may be shipped to Japan. Low profits make Indian
producers reduce manufacture, which is why the amount of SiMn available
for export will be at about 100,000 t in Q1 (down 29,000 t), of which 20-30%
may be supplied to Japan.
SiMn supply structure is changing in Japan and the competition in the seg-
ment is getting tougher. As expected, TEMCO has enlarged shipments to Japan.
Last quarter, imports from Australia increased by 8,300 t quarter-on-quarter to
10,000 t, its share in the Japanese market coming up from 2.1% to 13%. The
share of the alloy imported from Vietnam rose from 13% to 20%. Meanwhile,
Indian merchants lost 17% of the Japanese market over April-September, cov-
ering only 35% of it. The situation is likely to stay difficult for Indian suppliers,
given the expected launch of manganese alloy manufacture in Malaysia. The
competition in the Japanese market is going to strengthen in the near future,
and Indians will possibly be the ones to yield their market share.
World Bulk Ferro-alloys Markets November, 2015
© Metal Expert
26
Mn
Japan SiMn market structure
46% 49% 52% 46% 35%
Q3 14 Q4 14 Q1 15 Q2 15 Q3 15
India Asian countries Domestic production CIS countries Australia Others
The competition is also getting intense for Indian FeMn exporters. South
Korean suppliers reduced prices by $65/t and still keep the bottom end of the
price range in the Japanese market, their prices being $30/t lower than Indian
quotations ($5/t in October). Thus, the Indians will have to accept the price de-
crease, or they will lose their market share in Japan. However, Indian suppliers
are losing their ability to give considerable discounts as their profitability has
been negative over the past few months.
HC FeMn spot prices in Japan
630
680
730
780
830
880
930
980
1030
1080
Oct14
Nov14
Dec14
Jan15
Feb15
Mar15
Apr15
May15
Jun15
Jul15
Aug15
Sep15
Oct15
Nov15
USD/t,CIF
Source: Metal Expert
HC FeMn (75% Mn) origin India
HC FeMn (75% Mn) origin South Korea
Sellers will have to do business in a rather narrow market within the next
several months, given that consumption is going to decrease further and
the Malaysians will enter the market soon. High competition will eventually
result in further price decrease.
Back to top
World Bulk Ferro-alloys Markets November, 2015
© Metal Expert
27
Mn
SiMn market structure in Japan
Apr 15 May 15 Jun 15 Jul 15 Aug 15 Sep 15
PRODUCTION 4,8 3,7 4,4 3,2 3,6 3,1
EXPORT 0,00 0,01 0,00 0,00 0,01 0,00
IMPORT 24,7 23,1 17,3 22,9 19,7 24,1
by country
India 16,2 11,2 8,4 8,1 9,0 9,7
Vietnam 1,1 6,2 2,8 5,4 4,3 5,3
Kazachstan 5,7 1,5 4,6 2,6 3,9 2,2
Ukraine 0,0 1,6 0,0 0,0 0,0 0,0
Indonesia 0,6 0,2 0,4 1,0 0,6 0,8
Australia 0,5 0,5 0,6 4,1 0,5 5,2
Others 0,7 1,8 0,4 1,6 1,4 0,9
APPARENT CONSUMPTION 30 27 22 26 23 27
CARBON STEEL PRODUCTION 8 402 8 918 8 535 8 841 8 796 8 575
ESTIMATED CONSUMPTION 26 27 23 24 23 24
BALANCE 4 0 -2 3 0 3
Back to top
Source: Metal Expert
Note: in ‘000 gross tonnes
HC FeMn market structure in Japan
Apr 15 May 15 Jun 15 Jul 15 Aug 15 Sep 15
PRODUCTION 19,1 23,2 19,7 19,3 14,5 14,3
EXPORT 0,07 0,03 0,03 0,07 0,04 0,06
IMPORT 6,8 8,1 3,9 3,7 9,2 3,5
by country
South Korea 2,0 4,9 1,3 1,8 4,2 0,8
Australia 0,0 1,5 0,5 0,5 2,5 0,5
India 2,0 1,4 1,6 0,9 1,5 0,7
South Africa 2,8 0,3 0,5 0,5 1,0 1,0
Norway 0,0 0,0 0,0 0,0 0,0 0,5
Others 0,0 0,0 0,0 0,0 0,0 0,0
APPARENT CONSUMPTION 26 31 24 23 24 18
CARBON STEEL PRODUCTION 8 402 8 918 8 535 8 841 8 796 8 575
ESTIMATED CONSUMPTION 34 36 35 36 36 35
BALANCE -8 -5 -11 -13 -12 -17
Back to top
World Bulk Ferro-alloys Markets November, 2015
© Metal Expert
28
Mn
South Korea SiMn market structure
Apr 15 May 15 Jun 15 Jul 15 Aug 15 Sep 15
PRODUCTION 15,7 17,0 16,4 15,2 14,5 17,7
EXPORT 2,1 1,3 1,7 2,4 2,4 3,6
IMPORT 9,4 10,3 6,6 6,9 5,0 7,5
by country
Ukraine 4,4 5,9 3,7 4,7 1,4 3,2
India 2,9 2,9 0,9 1,2 1,9 2,7
Vietnam 2,0 1,4 2,0 1,0 1,7 0,6
Others 0,1 0,1 0,0 0,0 0,0 1,0
APPARENT CONSUMPTION 23 26 21 20 17 22
CARBON STEEL PRODUCTION 5745 6019 5859 5919 5749 5643
ESTIMATED CONSUMPTION 24 25 25 25 24 24
BALANCE -1 0 -3 -5 -7 -2
Back to top
Source: Metal Expert
Note: in ‘000 gross tonnes
World Bulk Ferro-alloys Markets November, 2015
© Metal Expert
29
Mn
Source: Metal Expert
Note: in ‘000 gross tonnes
South Korea HC FeMn market structure
Apr 15 May 15 Jun 15 Jul 15 Aug 15 Sep 15
PRODUCTION 19,1 22,1 19,1 16,1 16,1 18,1
EXPORT 10,7 13,9 13,1 10,9 10,7 12,7
by country
Japan 4,0 3,2 2,2 3,8 1,1 1,9
Taiwan 1,6 1,7 0,1 0,3 2,3 3,4
United Arab Emirates 1,8 1,2 1,3 1,2 1,2 1,5
Saudi Arabia 0,5 2,0 1,0 1,0 1,0 1,4
Netherlands 0,0 1,0 1,8 1,7 0,8 1,6
Turkey 0,0 0,0 2,5 0,6 2,5 1,0
Others 2,9 4,7 4,1 2,2 1,9 1,9
IMPORT 0,2 0,3 1,3 0,6 0,6 0,0
Australia 0,0 0,0 0,0 0,0 0,0 0,0
India 0,2 0,3 1,3 0,6 0,6 0,0
APPARENT CONSUMPTION 9 9 7 6 6 5
CARBON STEEL PRODUCTION 5745 6019 5859 5919 5749 5643
ESTIMATED CONSUMPTION 9 10 9 9 9 9
BALANCE -1 -1 -2 -4 -3 -4
Back to top
30
Mn World Bulk Ferro-alloys Markets November, 2015
© Metal Expert
30
Si
European FeSi market
European FeSi spot prices forecast Chinese FeSi export prices forecast
1225
1205
1185
1170
1070
975
940
920
900
600
700
800
900
1000
1100
1200
1300
1400
Jun15
Jul15
Aug15
Sep15
Oct15
Nov15
Dec15
Jan16
Feb16
EUR/t,ddp
1210
1210
1210
1165
1140
1130
1115
1125
1125
1000
1050
1100
1150
1200
1250
Jun15
Jul15
Aug15
Sep15
Oct15
Nov15
Dec15
Jan16
Feb16
USD/t,fob
This month, European merchants have had to reduce FeSi quotes once again
due to low demand and intense competition. The average monthly price for the
alloy (75% Si) has dropped by EUR 95/t month-on-month to EUR 975/t DDP,
reaching its 6-year minimum. The US dollar price has dropped by $166/t due
to the 5.3% euro devaluation.
Supply has remained excessive in Europe this month. Merchants will most likely
fail to offload stocks without losses until the year end. Over the whole year, the
surplus may reach 25,000 t, which is 44% of the average monthly consump-
tion. In January-February, the market balance is unlikely to recover amid low
consumption and the inflow of import material.
Balance of European FeSi market
-30
-20
-10
0
10
20
30
Q314
Q414
Q115
Q215
Q315
Q415*
Q116*
'000tonnes
Source: Metal Expert
*- forecast
31
Mn World Bulk Ferro-alloys Markets November, 2015
© Metal Expert
31
Si
Shipments from Malaysia keep depressing the European market. Supply
of Malaysian material increases gradually, at the moment accounting for some
4% in the supply structure. Besides, the EUR 20-100/t competitive advantage
over European prices (in terms of European quality) allows Malaysians to further
strengthen their positions. Soon, Malaysia may cover 7-10% of the European
market, and the only measure the Europeans can take to prevent it is to initiate
an antidumping investigation against Malaysian material.
There will be no support from the consuming industry within the next
few months. The situation in the steelmaking industry is unfavourable due to
the upturn in purchases of cheap steel from China (this year, exports from the
country may add 17% reaching 110 million t) and constant decrease in domestic
quotations. The problem is unlikely to be resolved soon, as the European authori-
ties delay making the decision on protective measures. As a result, European
steelmakers will keep pressuring raw material prices in order to maintain profit-
ability. Besides, steel output will drop by 5.6% year-on-year to 42.1 million t in
Q1, so FeSi consumption will approximate 60,000-64,000 tpm.
European FeSi production may be enlarged. Next quarter, it will add 6.4%
quarter-on-quarter to 123,000 t, owing to recovery of operations at Icelandic
Alloys (120,000 tpy). However, some companies may lower output in view of
the unfavourable market environment.
FeSi prices will inevitably keep falling amid excessive supply and the
negative conditions in the steelmaking segment.
Back to top
32
Mn World Bulk Ferro-alloys Markets November, 2015
© Metal Expert
32
Si
Back to top
Source: Metal Expert	
* - forecast, ** - preliminary data
Note: in ‘000 tonnes 	
Source: Metal Expert
* - forecast, ** - preliminary data
Note: in ‘000 tonnes
Apr 15 May 15 Jun 15 Jul 15 Aug 15 Sep 15** Q4 15* Q1 16*
PRODUCTION 40 42 42 43 43 43 116 123
by company
Elkem 11 11 11 12 12 12 26 35
Ferroatlantica 6 6 6 5 5 5 16 16
Finnfjord 7 7 7 7 7 7 22 22
Fesil 7 7 7 7 7 7 20 20
Other 10 11 11 12 12 12 32 31
EXPORT 4 4 4 5 3 3 10 10
IMPORT 23 33 24 26 20 27 73 76
by countries
CIS 4 8 5 4 5 5 - -
India 3 3 3 4 2 2 - -
China 0 0 0 0 0 0 - -
Africa 5 3 4 4 1 1 - -
South America 0 7 2 2 2 5 - -
Middle East 0 2 1 1 1 2 - -
APPARENT CONSUMPTION 59 70 62 64 60 67 179 190
STEEL PRODUCTION 14460 15552 14746 13810 12361 13761 40166 42131
ESTIMATED CONSUMPTION 62 67 63 59 53 59 173 181
BALANCE -3 3 -1 5 7 7 6 8
European ferrosilicon market structure
European ferrosilicon market [Si content]
Apr 15 May 15 Jun 15 Jul 15 Aug 15 Sep 15** Q4 15* Q1 16*
Production 30 31 32 32 32 32 87 92
Export 3 3 3 4 2 2 7 7
Import 17 24 18 19 15 20 54 56
Apparent Consumption 44 53 46 48 45 50 134 141
Estimated Consumption 46 50 47 44 40 44 129 135
Balance -2 3 -1 3 5 6 5 6
33
Mn World Bulk Ferro-alloys Markets November, 2015
© Metal Expert
33
Si
US, Turkish & Japanese FeSi market
Back to top
Source: Metal Expert
* - forecast, ** - preliminary data
Note: in ‘000 gross tonnes
USA FeSi market structure
Apr 15 May 15 Jun 15 Jul 15 Aug 15 Sep 15 Q4 15* Q1 16*
PRODUCTION 7,5 7 6,2 3,5 3,5 3,5 21 21
EXPORT 1,1 0,9 0,9 0,7 0,6 0,6 2,4 2,2
IMPORT 32,5 24,1 8,8 6,8 30,7 20,0 46,5 38,0
by country
Russia 16,0 16,2 0,0 0,0 16,2 0,5 19,0 17,0
China 9,3 4,6 5,3 3,9 7,4 8,4 16,0 9,0
Venezuela 2,9 0,0 0,0 0,0 3,3 4,8 0,0 0,0
Others 4,3 3,4 3,5 2,8 3,8 6,3 11,5 12,0
APPARENT CONSUMPTION 39 30 14 10 34 23 65 57
STAINLESS STEEL PRODUC-
TION
6413 6844 6843 7032 6936 6557 19282 18619
ESTIMATED CONSUMPTION 20,9 22,3 22,3 22,9 22,6 21,3 62,7 60,6
BALANCE 18,1 8,0 -8,1 -13,4 11,1 1,6 2,4 -3,8
34
Mn World Bulk Ferro-alloys Markets November, 2015
© Metal Expert
34
Si
Back to top
Note: in ‘000 tonnes
* - Metal Expert estimation
Source: Metal Expert
Note: in ‘000 gross tonnes
Apr 15 May 15 Jun 15 Jul 15 Aug 15 Sep 15
EXPORT 0,1 0,1 0,1 0,2 0,1 0,1
IMPORT 4,7 6,3 7,8 10,1 8,1 4,2
by suppliers
China 0,7 2,9 2,5 2,4 2,6 2,0
Russia 3,0 1,9 2,6 3,5 1,8 0,8
Egypt 0,0 0,0 0,0 0,0 0,0 0,0
Macedonia 0,0 0,0 1,0 1,0 0,0 0,0
Ukraine 0,0 0,1 0,4 1,4 0,0 0,0
Others 0,9 1,3 1,3 1,8 3,7 1,3
DOMESTIC MARKET 4,6 6,2 7,6 10,0 8,0 4,1
STEEL PRODUCTION 2775 2919 2844 2539 2563 2489
ESTIMATED CONSUMPTION 7,3 7,7 7,5 6,7 6,8 6,6
BALANCE -2,7 -1,5 0,1 3,3 1,2 -2,5
Apr 15 May 15 Jun 15 Jul 15 Aug 15 Sep 15
EXPORT 0,2 0,2 0,3 0,1 0,2 0,4
IMPORT 50,1 39,0 31,8 48,7 30,3 29,5
by country
China 31,9 21,2 20,6 28,3 15,9 12,4
Russia 10,7 9,1 1,5 10,8 5,4 10,2
Brazil 2,3 4,2 5,9 5,2 4,8 3,7
Vietnam 1,0 0,4 0,5 0,6 0,0 0,1
Others 4,2 4,2 3,2 3,9 4,2 3,1
APPARENT CONSUMPTION 50 39 31 49 30 29
CARBON STEEL PRODUCTION 8 402 8 918 8 535 8 841 8 796 8 575
ESTIMATED CONSUMPTION 34 36 34 36 35 34
BALANCE 16 3 -3 13 -5 -5
Turkish FeSi market structure
FeSi market structure in Japan
35
Mn World Bulk Ferro-alloys Markets November, 2015
© Metal Expert
35
Cr
European FeCr market
HC FeCr (60-65%) spot price forecast
in Europe, DDP
LC FeCr (65-70%) spot price forecast
in Europe, DDP
0,95
0,94
0,94
0,87
0,88
0,83
0,81
0,81
0,83
0,60
0,70
0,80
0,90
1,00
1,10
Jun15
Jul15
Aug15
Sep15
Oct15
Nov15
Dec15
Jan16
Feb16
USD/lbCr
2,01
2,00
1,99
1,98
1,96
1,90
1,88
1,88
1,88
1,20
1,40
1,60
1,80
2,00
2,20
Jun15
Jul15
Aug15
Sep15
Oct15
Nov15
Dec15
Jan16
Feb16
USD/lbCr
This month, European prices for HC FeCr (60-65% Cr; 6-8% C) have dropped
by around 5% month-on-month to $0.83/lb Cr DDP and those for LC material
(65-70% Cr; 0.1% C) – by 1.5% to $1.90/lb Cr DDP.
Supply is still excessive in Europe. By the end of November, the accumulated
surplus reached 7,500 t of FeCr in content, some 16% of the average monthly
consumption.
European FeCr market balance, in content
-15,0
-10,0
-5,0
0,0
5,0
10,0
15,0
20,0
25,0
Q214
Q314
Q414
Q115
Q215
Q315
Q415*
Q116*
'000tonnes
Source: Metal Expert*-forecast
36
Mn World Bulk Ferro-alloys Markets November, 2015
© Metal Expert
36
Cr
Demand will stay low and will prevent the price increase in short-run.
Steelmakers are forced to reduce capacity utilization amid intense competition
with foreign suppliers and the consequent price decrease. Over January-
November, a total of 6.7 million t of stainless steel was melted in Europe,
down 3.3% year-on-year. In December, sellers will be trying to minimize
their finished steel inventories, so the output is going to lose another 8-10%
m-o-m reaching 450,000 t. The usual recover in Q1 will not exceed 10%
(25% in 2015, 19% in 2014).
Although South African merchants are having financial problems, the 5% rand
devaluation in November will make them increase discounts. The surplus
is unlikely to lessen in the global market, although charge chrome production
will drop by 2.5% this year as South Africa’s IFM (200,000 tpy) and Tata Steel
KZN (150,000 tpy) are still idle. Eskom, a local energy producer, insist on an
increase in electricity tariffs during the next financial year by 16.6% against the
approved 8%. Coupled with the falling chrome alloy prices, it will make produc-
ers cut manufacture.
Three out of the four European FeCr plants are still running at 100% capac-
ity utilization. This year, Europe is going to put out 612,000 t of chrome alloys,
up 8% year-on-year. Most producers do not plan any production cutbacks in Q1.
Chrome ore prices are on the way down, too. Prices for South African material
(40-42% Cr2O3) and (42-44% Cr2O3) have gone down by 13% to $127/t CIF
China and $143/t CIF China respectively. Turkish prices have gone down by 11%
to $177/t CIF China for lump ore (40-42% Cr2O3) and $193/t CIF China for the
material (46-48% Cr2O3). Prices seems to be close to the bottom as the major-
ity of local miners are forced to reduce manufacture due to substantial losses.
The price trend in the chrome alloy market is not going to reverse soon
because of high supply and low consumption. Yet, the decrease may slow
down, given that prices are already too close to production cost.
Back to top
37
Mn World Bulk Ferro-alloys Markets November, 2015
© Metal Expert
37
Cr
Source: Metal Expert
* - forecast, ** - preliminary data
Note: in ‘000 gross tonnes
Source: Metal Expert
* - forecast, ** - preliminary data
Note: in ‘000 gross tonnes
Apr 15 May 15 Jun 15 Jul 15 Aug 15 Sep 15 Q4 15** Q1 16*
PRODUCTION 36 48 52 49 49 50 155 164
by company
Outokumpu 24 36 40 42 42 42 125 125
Vargon Alloys 8,3 8,3 8,3 5,0 5,0 6,0 21 30
Albanian Chrome 3,0 3,5 3,2 2,7 2,0 2,5 9 9
Other 0 0 0 0 0 0 0 0
EXPORT 1,3 4,9 9,7 21,7 13,6 14,5 20 24
IMPORT 77 85 76 75 49 68 185 211
by countries
South Africa 44 57 58 58 34 49 138 148
Zimbabwe 13,8 5,0 0,4 2,5 0,8 6,0 7 8
Russia 1,2 0,5 0,7 0,7 0,2 0,5 2 8
Kazakhstan 4,3 6,9 2,8 1,9 2,1 0,5 5 7
Turkey 3,9 2,2 2,8 1,7 2,0 1,9 9 8
India 4,7 3,7 4,8 4,9 3,3 5,1 10 9
Other 4,3 9,5 6,9 4,9 7,0 5,1 16 24
APPARENT CONSUMPTION 111 127 118 102 84 104 319 385
STAINLESS STEEL PRODUCTION 630 665 666 553 420 600 1490 1750
Apr 15 May 15 Jun 15 Jul 15 Aug 15 Sep 15 Q4 15** Q1 16*
PRODUCTION 2,5 2,5 2,7 2,7 2,7 2,7 8 8
by producers
Elektrowerk Weisweiler GmbH 2,7 2,7 2,7 2,7 2,7 2,7 8 8
EXPORT 0,7 0,9 1,4 1,5 0,5 0,7 4 4
IMPORT 5,0 7,0 6,6 5,9 4,3 6,7 20 16
by countries
Russia 2,0 2,4 1,9 1,9 1,4 3,1 8 9
Other 3,0 4,6 4,7 4,0 2,8 3,6 12 7
APPARENT CONSUMPTION 6,8 8,6 7,9 7,1 6,4 8,7 23,5 19,5
STAINLESS STEEL PRODUCTION 630 665 666 553 420 600 1560 1750
European HC FeCr & Charge Chrome market structure
European LC and MC FeCr market structure
Back to top
38
Mn World Bulk Ferro-alloys Markets November, 2015
© Metal Expert
38
Cr
European & US FeCr market
Source: Metal Expert
* - forecast, ** - preliminary data
Note: in ‘000 gross tonnes
Source: Metal Expert
* - forecast, ** - preliminary data
Note: in ‘000 tonnes
Apr 15 May 15 Jun 15 Jul 15 Aug 15 Sep 15 Q4 15* Q4 15*
DLA sales 2,5 0,3 0,5 0,0 0,0 0,0 0,2 0,1
EXPORT 0,6 0,5 0,8 0,8 0,7 0,5 2,0 2,0
Canada 0,5 0,5 0,8 0,8 0,6 0,5 - -
IMPORT 65 41 16 25 46 38 105 109
by country
South Africa 42,6 30,7 8,4 1,5 16,8 16,0 - -
Finland 0,0 0,0 0,0 7,5 7,1 16,1 - -
Kazakhstan 0,0 0,0 0,0 11,0 0,0 0,0 - -
Zimbabwe 1,8 1,0 1,7 4,2 3,1 3,9 - -
APPARENT CONSUMPTION 66,6 40,8 15,4 24,4 44,8 37,9 103,6 107,6
USA HC FeCr & Charge Chrome market structure
European FeCr market structure [in Cr content]
Back to top
Apr 15 May 15 Jun 15 Jul 15 Aug 15 Sep 15 Q4 15* Q1 16*
Production 22 29 31 30 29 30 92 96
Export 1,2 3,4 6,4 13,2 8,1 8,6 14 16
Import 46 51 45 44 29 41 112 124
Apparent Consumption 67 76 70 60 50 63 191 207
Estimated Consumption 70 74 74 61 47 67 173 194
Balance -3 3 -4 -1 4 -4 18 13
39
Mn World Bulk Ferro-alloys Markets November, 2015
© Metal Expert
39
Cr
USA FeCr market structure [in Cr content]
Source: Metal Expert, 100% Mn weight basis
* - forecast, ** - preliminary data
Note: in ‘000 tonnes
Apr 15 May 15 Jun 15 Jul 15 Aug 15 Sep 15 Q4 15* Q4 15*
DLA sales 1,8 2,6 0,4 0,1 0,1 0,0 1,0 0,7
Export 0,5 0,5 0,7 0,6 1,0 0,5 2,0 2,0
Import 44,0 26,2 10,3 17,5 31,2 23,4 71,3 72,8
Apparent Consumption 45 28 10 17 30 23 70 71
Estimated Consumption 27 27 27 27 27 27 74 80
Source: Metal Expert
* - forecast, ** - preliminary data
Note: in ‘000 gross tonnes
Apr 15 May 15 Jun 15 Jul 15 Aug 15 Sep 15 Q4 15* Q4 15*
DLA sales 0,3 3,6 0,1 0,1 0,2 0,0 1,2 0,9
EXPORT 0,2 0,3 0,3 0,1 0,8 0,2 1,0 1,1
Canada 0,2 0,3 0,3 0,1 0,1 0,2 0,0 0,0
IMPORT 12,4 6,1 2,1 4,4 6,1 1,3 13,5 12,3
by country
Russia 9,6 5,0 0,3 1,3 3,5 0,1 - -
Germany 0,5 0,5 0,9 0,6 0,3 0,4 - -
China 0,9 0,3 0,2 0,9 0,8 0,4 - -
Kazakhstan 0,6 0,0 0,0 1,2 0,0 0,0 - -
APPARENT CONSUMPTION 12 9 2 4 6 1 14 12
USA LC and MC FeCr market structure
Back to top
40
Mn World Bulk Ferro-alloys Markets November, 2015
© Metal Expert
40
Cr
Source: Metal Expert
Note: in ‘000 gross tonnes
Japanese FeCr market
Japanese HC FeCr & Charge Chrome market structure
Back to top
Apr 15 May 15 Jun 15 Jul 15 Aug 15 Sep 15
EXPORT 0,01 0,00 0,01 0,00 0,01 0,01
IMPORT 51 62 62 38 64 51
by countries
Kazakhstan 33,3 21,8 34,9 22,0 20,3 16,5
South Africa 12,3 33,1 19,8 9,8 40,2 25,9
India 3,8 3,1 5,5 5,0 2,3 4,3
Finland 1,0 1,4 1,2 1,1 1,1 1,2
TURKEY 0,0 2,6 0,0 0,0 0,1 0,0
Others 0,7 0,1 0,4 0,4 0,3 3,5
APPARENT CONSUMPTION 51 62 62 38 64 51
SPECIAL STEEL PRODUCTION 1 549 1 593 1 536 1 562 1 496 1 597
by types
Stainless steel 205 220 225 231 232 246
Other specialty steel 1 345 1 372 1 311 1 331 1 265 1 352
ESTIMATED CONSUMPTION 50 53 53 54 54 57
BALANCE 2 9 9 -16 11 -6
41
Mn World Bulk Ferro-alloys Markets November, 2015
© Metal Expert
41
Cr
Source: Metal Expert
Note: in ‘000 gross tonnes
Japanese FeCr market structure [in Cr content]
Source: Metal Expert
Note: in ‘000 gross tonnes
Apr 15 May 15 Jun 15 Jul 15 Aug 15 Sep 15
Production 1,3 1,3 1,3 1,3 1,3 1,3
Export 0,2 0,2 0,2 0,2 0,1 0,1
Import 34,3 39,6 41,0 26,1 38,8 32,8
Apparent Consumption 35 41 42 27 40 34
Estimated Consumption 33 35 35 36 35 37
Balance 3 6 7 -8 5 -3
Japanese LC FeCr market structure
Back to top
Apr 15 May 15 Jun 15 Jul 15 Aug 15 Sep 15
PRODUCTION 2,0 2,0 2,0 2,0 2,0 2,0
EXPORT 0,3 0,3 0,3 0,3 0,2 0,2
IMPORT 3,7 6,2 5,1 3,9 3,8 4,7
by countries
Russia 1,2 1,2 1,2 1,6 0,9 2,2
South Africa 0,8 2,0 2,5 1,1 1,4 0,3
China 0,9 1,2 0,4 0,2 0,8 0,6
Kazakhstan 0,7 1,4 1,1 0,6 0,5 1,3
Others 0,1 0,4 0,0 0,3 0,2 0,2
APPARENT CONSUMPTION 5 8 7 6 6 7
SPECIAL STEEL PRODUCTION 1 549 1 593 1 536 1 562 1 496 1 597
by types
Stainless steel 205 220 225 231 232 246
Other specialty steel 1 345 1 372 1 311 1 331 1 265 1 352
ESTIMATED CONSUMPTION 5 5 5 5 5 6
BALANCE 0 3 2 0 0 1
This publication is for information purposes only. The information contained in this document has been compiled from sources
believed to be reliable. Metal Expert cannot be made liable for any loss no matter how it may arise.
© Metal Expert 2004-2015. All rights reserved. No part of this publication (text, data or graphic) may be reproduced, stored in
corporate data retrieval systems or transmitted in any form without obtaining Metal Expert’s prior written consent.
Metal Expert News	Analytics	Forecasts	Consulting	Advertising	 Conferences
www.metalexpert-group.com
tel	 +38 056 239 88 50, 370 12 06, 370 12 07
e-mail	 subscriptions@metalexpert-group.com
World Bulk Ferro-alloys Markets
on-line access to publications, statistics and archives
pdf-version and excel-version of statistics
consultations of leading experts
Subscription / Trials:
Chief Editor:
Alexandr Andreev
e-mail	 a.andreev@metalexpert-group.com
Metal Expert Ukraine:
48-b Naberezhnaya Pobedy,
Dnepropetrovsk 49094, Ukraine
tel	 +38 056 239 88 50
	 +38 056 370 12 06, 370 12 07
e-mail 	 subscriptions@metalexpert-group.com
Metal Expert Russia:
Metal Expert LLC
office 403, 73 Volokolamskoye shosse
Moscow, 125424
tel / fax	 +7 499 346 09 35, +7 495 775 60 55
e-mail 	 subscriptions@metalexpert-group.com
Metal Expert LLC:
2470 Hodges Bend Cir.,
Sugar Land, TX 77479, USA
tel 	 +1 832 545 50 23
e-mail	 s.sadikhov@metalexpert-group.com
	 k.hashimova@metalexpert-group.com
Metal Expert Group AG:
Todistrasse 38, Zurich, Switzerland, 8002
tel 	 +41 44 735 6015, +41 43 523 0098
e-mail	 office@unikomag.com
Offices

More Related Content

What's hot

Commodity weekly-technical-report-by-trifid research
Commodity weekly-technical-report-by-trifid researchCommodity weekly-technical-report-by-trifid research
Commodity weekly-technical-report-by-trifid researchtrifid research
 
Commodity Research Report 26 October 2015 Ways2Capital
Commodity Research Report 26 October 2015 Ways2CapitalCommodity Research Report 26 October 2015 Ways2Capital
Commodity Research Report 26 October 2015 Ways2Capitalways2capitalindore
 
Mn ore market report
Mn ore market reportMn ore market report
Mn ore market reportArtem Segen
 
Weekly Commodity Market Report
Weekly Commodity Market ReportWeekly Commodity Market Report
Weekly Commodity Market ReportRahul Solanki
 
Diwali dhamaka commodity news
Diwali dhamaka commodity newsDiwali dhamaka commodity news
Diwali dhamaka commodity newsRiya jain
 
Commodity Research Report 07 December 2015 Ways2Capital
Commodity Research Report 07 December 2015 Ways2CapitalCommodity Research Report 07 December 2015 Ways2Capital
Commodity Research Report 07 December 2015 Ways2Capitalways2capitalindore
 
Gold is plunging - or is there still good news?
Gold is plunging  -  or is there still good news?Gold is plunging  -  or is there still good news?
Gold is plunging - or is there still good news?Pierre A Pienaar
 
Commodity Research Report 23 November 2015 Ways2Capital
Commodity Research Report 23 November 2015 Ways2CapitalCommodity Research Report 23 November 2015 Ways2Capital
Commodity Research Report 23 November 2015 Ways2Capitalways2capitalindore
 
Tsi weekly steel reference prices 28 may 13
Tsi weekly steel reference prices   28 may 13Tsi weekly steel reference prices   28 may 13
Tsi weekly steel reference prices 28 may 13Tim Hard
 

What's hot (19)

Commodity weekly-technical-report-by-trifid research
Commodity weekly-technical-report-by-trifid researchCommodity weekly-technical-report-by-trifid research
Commodity weekly-technical-report-by-trifid research
 
Economic and Ferrous Metal Market Trends
Economic and Ferrous Metal Market TrendsEconomic and Ferrous Metal Market Trends
Economic and Ferrous Metal Market Trends
 
Commodity Research Report 26 October 2015 Ways2Capital
Commodity Research Report 26 October 2015 Ways2CapitalCommodity Research Report 26 October 2015 Ways2Capital
Commodity Research Report 26 October 2015 Ways2Capital
 
Nonferrous Scrap Metal Market Trends
Nonferrous Scrap Metal Market TrendsNonferrous Scrap Metal Market Trends
Nonferrous Scrap Metal Market Trends
 
Commodity Research Report 24 august 2015 Ways2capital
Commodity Research Report 24 august 2015 Ways2capitalCommodity Research Report 24 august 2015 Ways2capital
Commodity Research Report 24 august 2015 Ways2capital
 
Mn ore market report
Mn ore market reportMn ore market report
Mn ore market report
 
Weekly Commodity Market Report
Weekly Commodity Market ReportWeekly Commodity Market Report
Weekly Commodity Market Report
 
Diwali dhamaka commodity news
Diwali dhamaka commodity newsDiwali dhamaka commodity news
Diwali dhamaka commodity news
 
Commodity Research Report 07 December 2015 Ways2Capital
Commodity Research Report 07 December 2015 Ways2CapitalCommodity Research Report 07 December 2015 Ways2Capital
Commodity Research Report 07 December 2015 Ways2Capital
 
Commodity Research Report Ways2Capital 27 july 2015
Commodity Research Report Ways2Capital 27 july 2015Commodity Research Report Ways2Capital 27 july 2015
Commodity Research Report Ways2Capital 27 july 2015
 
Gold is plunging - or is there still good news?
Gold is plunging  -  or is there still good news?Gold is plunging  -  or is there still good news?
Gold is plunging - or is there still good news?
 
Commodity report ways2capital 13 june 2016
Commodity report ways2capital 13 june 2016Commodity report ways2capital 13 june 2016
Commodity report ways2capital 13 june 2016
 
Commodity Research Report 12 September 2017 Ways2Capital
Commodity Research Report 12 September 2017 Ways2CapitalCommodity Research Report 12 September 2017 Ways2Capital
Commodity Research Report 12 September 2017 Ways2Capital
 
баукли платтс
баукли платтсбаукли платтс
баукли платтс
 
Commodity Research Report 14 September 2015 Ways2Capital
Commodity Research Report 14 September 2015 Ways2CapitalCommodity Research Report 14 September 2015 Ways2Capital
Commodity Research Report 14 September 2015 Ways2Capital
 
Commodity Research Report 23 November 2015 Ways2Capital
Commodity Research Report 23 November 2015 Ways2CapitalCommodity Research Report 23 November 2015 Ways2Capital
Commodity Research Report 23 November 2015 Ways2Capital
 
Commodity Research Report 7 September 2015 Ways2Capital
Commodity Research Report 7 September 2015 Ways2CapitalCommodity Research Report 7 September 2015 Ways2Capital
Commodity Research Report 7 September 2015 Ways2Capital
 
Tsi weekly steel reference prices 28 may 13
Tsi weekly steel reference prices   28 may 13Tsi weekly steel reference prices   28 may 13
Tsi weekly steel reference prices 28 may 13
 
Commodity Research Report 22 August 2016 Ways2Capital
Commodity Research Report 22 August 2016 Ways2CapitalCommodity Research Report 22 August 2016 Ways2Capital
Commodity Research Report 22 August 2016 Ways2Capital
 

Viewers also liked

mw webstudio 0407 booklet
mw webstudio 0407 bookletmw webstudio 0407 booklet
mw webstudio 0407 bookletMilène Bloemer
 
Veenendaal Kan template krachtportret
Veenendaal Kan template krachtportretVeenendaal Kan template krachtportret
Veenendaal Kan template krachtportretMilène Bloemer
 
Trends Mobile Marketing
Trends Mobile MarketingTrends Mobile Marketing
Trends Mobile Marketingklasrock
 
無標題文件
無標題文件無標題文件
無標題文件子庭 洪
 
300MKT Dissertation Master Copy PDF
300MKT Dissertation Master Copy PDF300MKT Dissertation Master Copy PDF
300MKT Dissertation Master Copy PDFRhiannon Owen
 
Protein folding
Protein foldingProtein folding
Protein foldingsaba naeem
 
2014 -BUSINESS PROFILE
2014 -BUSINESS PROFILE2014 -BUSINESS PROFILE
2014 -BUSINESS PROFILEMURALI MENON
 
2015 Upload Campaigns Calendar - SlideShare
2015 Upload Campaigns Calendar - SlideShare2015 Upload Campaigns Calendar - SlideShare
2015 Upload Campaigns Calendar - SlideShareSlideShare
 
What to Upload to SlideShare
What to Upload to SlideShareWhat to Upload to SlideShare
What to Upload to SlideShareSlideShare
 
Getting Started With SlideShare
Getting Started With SlideShareGetting Started With SlideShare
Getting Started With SlideShareSlideShare
 

Viewers also liked (13)

mw webstudio 0407 booklet
mw webstudio 0407 bookletmw webstudio 0407 booklet
mw webstudio 0407 booklet
 
Step Ahead Digital
Step Ahead Digital Step Ahead Digital
Step Ahead Digital
 
Veenendaal Kan template krachtportret
Veenendaal Kan template krachtportretVeenendaal Kan template krachtportret
Veenendaal Kan template krachtportret
 
Trends Mobile Marketing
Trends Mobile MarketingTrends Mobile Marketing
Trends Mobile Marketing
 
無標題文件
無標題文件無標題文件
無標題文件
 
300MKT Dissertation Master Copy PDF
300MKT Dissertation Master Copy PDF300MKT Dissertation Master Copy PDF
300MKT Dissertation Master Copy PDF
 
scriptieaf
scriptieafscriptieaf
scriptieaf
 
Data Exploration & BI
Data Exploration & BIData Exploration & BI
Data Exploration & BI
 
Protein folding
Protein foldingProtein folding
Protein folding
 
2014 -BUSINESS PROFILE
2014 -BUSINESS PROFILE2014 -BUSINESS PROFILE
2014 -BUSINESS PROFILE
 
2015 Upload Campaigns Calendar - SlideShare
2015 Upload Campaigns Calendar - SlideShare2015 Upload Campaigns Calendar - SlideShare
2015 Upload Campaigns Calendar - SlideShare
 
What to Upload to SlideShare
What to Upload to SlideShareWhat to Upload to SlideShare
What to Upload to SlideShare
 
Getting Started With SlideShare
Getting Started With SlideShareGetting Started With SlideShare
Getting Started With SlideShare
 

Similar to Wfm 1115

Metals: Steel prices ski jumping off steepened Chinese slope - Motilal Oswal
Metals: Steel prices ski jumping off steepened Chinese slope - Motilal OswalMetals: Steel prices ski jumping off steepened Chinese slope - Motilal Oswal
Metals: Steel prices ski jumping off steepened Chinese slope - Motilal OswalIndiaNotes.com
 
Ferrous scrap
Ferrous scrapFerrous scrap
Ferrous scrapnmjkl
 
Commodity mcx-weekly-trifidresearch
Commodity mcx-weekly-trifidresearchCommodity mcx-weekly-trifidresearch
Commodity mcx-weekly-trifidresearchtrifid research
 
Lincoln crowne copper gold weekly report 15072013
Lincoln crowne copper gold weekly report   15072013Lincoln crowne copper gold weekly report   15072013
Lincoln crowne copper gold weekly report 15072013Lincoln Crowne & Company
 
Base Metals One Year Forecast November 2009 All Metals
Base Metals One Year Forecast   November 2009   All MetalsBase Metals One Year Forecast   November 2009   All Metals
Base Metals One Year Forecast November 2009 All MetalsChristopher R Anderson
 
Quo vadis eu steel by Marcel Genet Laplace Conseil
Quo vadis eu steel by Marcel Genet Laplace ConseilQuo vadis eu steel by Marcel Genet Laplace Conseil
Quo vadis eu steel by Marcel Genet Laplace ConseilAudrey Bayard
 
Lincoln crowne copper gold report 30092013
Lincoln crowne copper gold report 30092013Lincoln crowne copper gold report 30092013
Lincoln crowne copper gold report 30092013Lincoln Crowne & Company
 
MENA Billet Market Development & Outlook
MENA Billet Market Development & OutlookMENA Billet Market Development & Outlook
MENA Billet Market Development & OutlookAndrey Pupchenko
 
Two markets
Two marketsTwo markets
Two marketsTim Hard
 
Iron ore vs scrap imparity hit mini-mills in Turkey
Iron ore vs scrap imparity hit mini-mills in TurkeyIron ore vs scrap imparity hit mini-mills in Turkey
Iron ore vs scrap imparity hit mini-mills in TurkeyAndrey Pupchenko
 
Weekly mcx newsletter 29 april2013
Weekly mcx newsletter 29 april2013Weekly mcx newsletter 29 april2013
Weekly mcx newsletter 29 april2013Rehana Kapoor
 

Similar to Wfm 1115 (20)

Copper gold report 20140331
Copper gold report 20140331Copper gold report 20140331
Copper gold report 20140331
 
Metals: Steel prices ski jumping off steepened Chinese slope - Motilal Oswal
Metals: Steel prices ski jumping off steepened Chinese slope - Motilal OswalMetals: Steel prices ski jumping off steepened Chinese slope - Motilal Oswal
Metals: Steel prices ski jumping off steepened Chinese slope - Motilal Oswal
 
Metals: Steel prices ski jumping off steepened Chinese slope - Motilal Oswal
Metals: Steel prices ski jumping off steepened Chinese slope - Motilal OswalMetals: Steel prices ski jumping off steepened Chinese slope - Motilal Oswal
Metals: Steel prices ski jumping off steepened Chinese slope - Motilal Oswal
 
Nickel & Stainless Steel Data Monthly
Nickel & Stainless Steel Data MonthlyNickel & Stainless Steel Data Monthly
Nickel & Stainless Steel Data Monthly
 
LCC copper gold report 20140324
LCC copper gold report 20140324LCC copper gold report 20140324
LCC copper gold report 20140324
 
Ferrous scrap
Ferrous scrapFerrous scrap
Ferrous scrap
 
LCC copper gold report 20140317
LCC copper gold report 20140317LCC copper gold report 20140317
LCC copper gold report 20140317
 
Commodity mcx-weekly-trifidresearch
Commodity mcx-weekly-trifidresearchCommodity mcx-weekly-trifidresearch
Commodity mcx-weekly-trifidresearch
 
Lincoln crowne copper gold weekly report 15072013
Lincoln crowne copper gold weekly report   15072013Lincoln crowne copper gold weekly report   15072013
Lincoln crowne copper gold weekly report 15072013
 
Base Metals One Year Forecast November 2009 All Metals
Base Metals One Year Forecast   November 2009   All MetalsBase Metals One Year Forecast   November 2009   All Metals
Base Metals One Year Forecast November 2009 All Metals
 
Quo vadis eu steel by Marcel Genet Laplace Conseil
Quo vadis eu steel by Marcel Genet Laplace ConseilQuo vadis eu steel by Marcel Genet Laplace Conseil
Quo vadis eu steel by Marcel Genet Laplace Conseil
 
Lincoln crowne copper gold report 30092013
Lincoln crowne copper gold report 30092013Lincoln crowne copper gold report 30092013
Lincoln crowne copper gold report 30092013
 
MENA Billet Market Development & Outlook
MENA Billet Market Development & OutlookMENA Billet Market Development & Outlook
MENA Billet Market Development & Outlook
 
Two markets
Two marketsTwo markets
Two markets
 
Iron ore vs scrap imparity hit mini-mills in Turkey
Iron ore vs scrap imparity hit mini-mills in TurkeyIron ore vs scrap imparity hit mini-mills in Turkey
Iron ore vs scrap imparity hit mini-mills in Turkey
 
Lincoln crowne gold copper 23092013
Lincoln crowne gold copper 23092013Lincoln crowne gold copper 23092013
Lincoln crowne gold copper 23092013
 
Weekly mcx newsletter 29 april2013
Weekly mcx newsletter 29 april2013Weekly mcx newsletter 29 april2013
Weekly mcx newsletter 29 april2013
 
Commodity Research Report 12 October 2015 Ways2Capital
Commodity Research Report 12 October 2015 Ways2CapitalCommodity Research Report 12 October 2015 Ways2Capital
Commodity Research Report 12 October 2015 Ways2Capital
 
Commodity Research Report 17 July 2018 Ways2Capital
Commodity Research Report  17  July 2018  Ways2CapitalCommodity Research Report  17  July 2018  Ways2Capital
Commodity Research Report 17 July 2018 Ways2Capital
 
Oz Metals 20141018
Oz Metals 20141018Oz Metals 20141018
Oz Metals 20141018
 

Recently uploaded

rishikeshgirls.in- Rishikesh call girl.pdf
rishikeshgirls.in- Rishikesh call girl.pdfrishikeshgirls.in- Rishikesh call girl.pdf
rishikeshgirls.in- Rishikesh call girl.pdfmuskan1121w
 
Call Girls In Panjim North Goa 9971646499 Genuine Service
Call Girls In Panjim North Goa 9971646499 Genuine ServiceCall Girls In Panjim North Goa 9971646499 Genuine Service
Call Girls In Panjim North Goa 9971646499 Genuine Serviceritikaroy0888
 
A DAY IN THE LIFE OF A SALESMAN / WOMAN
A DAY IN THE LIFE OF A  SALESMAN / WOMANA DAY IN THE LIFE OF A  SALESMAN / WOMAN
A DAY IN THE LIFE OF A SALESMAN / WOMANIlamathiKannappan
 
Eni 2024 1Q Results - 24.04.24 business.
Eni 2024 1Q Results - 24.04.24 business.Eni 2024 1Q Results - 24.04.24 business.
Eni 2024 1Q Results - 24.04.24 business.Eni
 
GD Birla and his contribution in management
GD Birla and his contribution in managementGD Birla and his contribution in management
GD Birla and his contribution in managementchhavia330
 
Call Girls in Mehrauli Delhi 💯Call Us 🔝8264348440🔝
Call Girls in Mehrauli Delhi 💯Call Us 🔝8264348440🔝Call Girls in Mehrauli Delhi 💯Call Us 🔝8264348440🔝
Call Girls in Mehrauli Delhi 💯Call Us 🔝8264348440🔝soniya singh
 
Intro to BCG's Carbon Emissions Benchmark_vF.pdf
Intro to BCG's Carbon Emissions Benchmark_vF.pdfIntro to BCG's Carbon Emissions Benchmark_vF.pdf
Intro to BCG's Carbon Emissions Benchmark_vF.pdfpollardmorgan
 
Lucknow 💋 Escorts in Lucknow - 450+ Call Girl Cash Payment 8923113531 Neha Th...
Lucknow 💋 Escorts in Lucknow - 450+ Call Girl Cash Payment 8923113531 Neha Th...Lucknow 💋 Escorts in Lucknow - 450+ Call Girl Cash Payment 8923113531 Neha Th...
Lucknow 💋 Escorts in Lucknow - 450+ Call Girl Cash Payment 8923113531 Neha Th...anilsa9823
 
VIP Call Girl Jamshedpur Aashi 8250192130 Independent Escort Service Jamshedpur
VIP Call Girl Jamshedpur Aashi 8250192130 Independent Escort Service JamshedpurVIP Call Girl Jamshedpur Aashi 8250192130 Independent Escort Service Jamshedpur
VIP Call Girl Jamshedpur Aashi 8250192130 Independent Escort Service JamshedpurSuhani Kapoor
 
BEST Call Girls In Old Faridabad ✨ 9773824855 ✨ Escorts Service In Delhi Ncr,
BEST Call Girls In Old Faridabad ✨ 9773824855 ✨ Escorts Service In Delhi Ncr,BEST Call Girls In Old Faridabad ✨ 9773824855 ✨ Escorts Service In Delhi Ncr,
BEST Call Girls In Old Faridabad ✨ 9773824855 ✨ Escorts Service In Delhi Ncr,noida100girls
 
Call Girls In Radisson Blu Hotel New Delhi Paschim Vihar ❤️8860477959 Escorts...
Call Girls In Radisson Blu Hotel New Delhi Paschim Vihar ❤️8860477959 Escorts...Call Girls In Radisson Blu Hotel New Delhi Paschim Vihar ❤️8860477959 Escorts...
Call Girls In Radisson Blu Hotel New Delhi Paschim Vihar ❤️8860477959 Escorts...lizamodels9
 
Call Girls Navi Mumbai Just Call 9907093804 Top Class Call Girl Service Avail...
Call Girls Navi Mumbai Just Call 9907093804 Top Class Call Girl Service Avail...Call Girls Navi Mumbai Just Call 9907093804 Top Class Call Girl Service Avail...
Call Girls Navi Mumbai Just Call 9907093804 Top Class Call Girl Service Avail...Dipal Arora
 
0183760ssssssssssssssssssssssssssss00101011 (27).pdf
0183760ssssssssssssssssssssssssssss00101011 (27).pdf0183760ssssssssssssssssssssssssssss00101011 (27).pdf
0183760ssssssssssssssssssssssssssss00101011 (27).pdfRenandantas16
 
Russian Faridabad Call Girls(Badarpur) : ☎ 8168257667, @4999
Russian Faridabad Call Girls(Badarpur) : ☎ 8168257667, @4999Russian Faridabad Call Girls(Badarpur) : ☎ 8168257667, @4999
Russian Faridabad Call Girls(Badarpur) : ☎ 8168257667, @4999Tina Ji
 
Regression analysis: Simple Linear Regression Multiple Linear Regression
Regression analysis:  Simple Linear Regression Multiple Linear RegressionRegression analysis:  Simple Linear Regression Multiple Linear Regression
Regression analysis: Simple Linear Regression Multiple Linear RegressionRavindra Nath Shukla
 
VIP Kolkata Call Girl Howrah 👉 8250192130 Available With Room
VIP Kolkata Call Girl Howrah 👉 8250192130  Available With RoomVIP Kolkata Call Girl Howrah 👉 8250192130  Available With Room
VIP Kolkata Call Girl Howrah 👉 8250192130 Available With Roomdivyansh0kumar0
 
Call Girls In Sikandarpur Gurgaon ❤️8860477959_Russian 100% Genuine Escorts I...
Call Girls In Sikandarpur Gurgaon ❤️8860477959_Russian 100% Genuine Escorts I...Call Girls In Sikandarpur Gurgaon ❤️8860477959_Russian 100% Genuine Escorts I...
Call Girls In Sikandarpur Gurgaon ❤️8860477959_Russian 100% Genuine Escorts I...lizamodels9
 
Enhancing and Restoring Safety & Quality Cultures - Dave Litwiller - May 2024...
Enhancing and Restoring Safety & Quality Cultures - Dave Litwiller - May 2024...Enhancing and Restoring Safety & Quality Cultures - Dave Litwiller - May 2024...
Enhancing and Restoring Safety & Quality Cultures - Dave Litwiller - May 2024...Dave Litwiller
 
Vip Female Escorts Noida 9711199171 Greater Noida Escorts Service
Vip Female Escorts Noida 9711199171 Greater Noida Escorts ServiceVip Female Escorts Noida 9711199171 Greater Noida Escorts Service
Vip Female Escorts Noida 9711199171 Greater Noida Escorts Serviceankitnayak356677
 

Recently uploaded (20)

rishikeshgirls.in- Rishikesh call girl.pdf
rishikeshgirls.in- Rishikesh call girl.pdfrishikeshgirls.in- Rishikesh call girl.pdf
rishikeshgirls.in- Rishikesh call girl.pdf
 
KestrelPro Flyer Japan IT Week 2024 (English)
KestrelPro Flyer Japan IT Week 2024 (English)KestrelPro Flyer Japan IT Week 2024 (English)
KestrelPro Flyer Japan IT Week 2024 (English)
 
Call Girls In Panjim North Goa 9971646499 Genuine Service
Call Girls In Panjim North Goa 9971646499 Genuine ServiceCall Girls In Panjim North Goa 9971646499 Genuine Service
Call Girls In Panjim North Goa 9971646499 Genuine Service
 
A DAY IN THE LIFE OF A SALESMAN / WOMAN
A DAY IN THE LIFE OF A  SALESMAN / WOMANA DAY IN THE LIFE OF A  SALESMAN / WOMAN
A DAY IN THE LIFE OF A SALESMAN / WOMAN
 
Eni 2024 1Q Results - 24.04.24 business.
Eni 2024 1Q Results - 24.04.24 business.Eni 2024 1Q Results - 24.04.24 business.
Eni 2024 1Q Results - 24.04.24 business.
 
GD Birla and his contribution in management
GD Birla and his contribution in managementGD Birla and his contribution in management
GD Birla and his contribution in management
 
Call Girls in Mehrauli Delhi 💯Call Us 🔝8264348440🔝
Call Girls in Mehrauli Delhi 💯Call Us 🔝8264348440🔝Call Girls in Mehrauli Delhi 💯Call Us 🔝8264348440🔝
Call Girls in Mehrauli Delhi 💯Call Us 🔝8264348440🔝
 
Intro to BCG's Carbon Emissions Benchmark_vF.pdf
Intro to BCG's Carbon Emissions Benchmark_vF.pdfIntro to BCG's Carbon Emissions Benchmark_vF.pdf
Intro to BCG's Carbon Emissions Benchmark_vF.pdf
 
Lucknow 💋 Escorts in Lucknow - 450+ Call Girl Cash Payment 8923113531 Neha Th...
Lucknow 💋 Escorts in Lucknow - 450+ Call Girl Cash Payment 8923113531 Neha Th...Lucknow 💋 Escorts in Lucknow - 450+ Call Girl Cash Payment 8923113531 Neha Th...
Lucknow 💋 Escorts in Lucknow - 450+ Call Girl Cash Payment 8923113531 Neha Th...
 
VIP Call Girl Jamshedpur Aashi 8250192130 Independent Escort Service Jamshedpur
VIP Call Girl Jamshedpur Aashi 8250192130 Independent Escort Service JamshedpurVIP Call Girl Jamshedpur Aashi 8250192130 Independent Escort Service Jamshedpur
VIP Call Girl Jamshedpur Aashi 8250192130 Independent Escort Service Jamshedpur
 
BEST Call Girls In Old Faridabad ✨ 9773824855 ✨ Escorts Service In Delhi Ncr,
BEST Call Girls In Old Faridabad ✨ 9773824855 ✨ Escorts Service In Delhi Ncr,BEST Call Girls In Old Faridabad ✨ 9773824855 ✨ Escorts Service In Delhi Ncr,
BEST Call Girls In Old Faridabad ✨ 9773824855 ✨ Escorts Service In Delhi Ncr,
 
Call Girls In Radisson Blu Hotel New Delhi Paschim Vihar ❤️8860477959 Escorts...
Call Girls In Radisson Blu Hotel New Delhi Paschim Vihar ❤️8860477959 Escorts...Call Girls In Radisson Blu Hotel New Delhi Paschim Vihar ❤️8860477959 Escorts...
Call Girls In Radisson Blu Hotel New Delhi Paschim Vihar ❤️8860477959 Escorts...
 
Call Girls Navi Mumbai Just Call 9907093804 Top Class Call Girl Service Avail...
Call Girls Navi Mumbai Just Call 9907093804 Top Class Call Girl Service Avail...Call Girls Navi Mumbai Just Call 9907093804 Top Class Call Girl Service Avail...
Call Girls Navi Mumbai Just Call 9907093804 Top Class Call Girl Service Avail...
 
0183760ssssssssssssssssssssssssssss00101011 (27).pdf
0183760ssssssssssssssssssssssssssss00101011 (27).pdf0183760ssssssssssssssssssssssssssss00101011 (27).pdf
0183760ssssssssssssssssssssssssssss00101011 (27).pdf
 
Russian Faridabad Call Girls(Badarpur) : ☎ 8168257667, @4999
Russian Faridabad Call Girls(Badarpur) : ☎ 8168257667, @4999Russian Faridabad Call Girls(Badarpur) : ☎ 8168257667, @4999
Russian Faridabad Call Girls(Badarpur) : ☎ 8168257667, @4999
 
Regression analysis: Simple Linear Regression Multiple Linear Regression
Regression analysis:  Simple Linear Regression Multiple Linear RegressionRegression analysis:  Simple Linear Regression Multiple Linear Regression
Regression analysis: Simple Linear Regression Multiple Linear Regression
 
VIP Kolkata Call Girl Howrah 👉 8250192130 Available With Room
VIP Kolkata Call Girl Howrah 👉 8250192130  Available With RoomVIP Kolkata Call Girl Howrah 👉 8250192130  Available With Room
VIP Kolkata Call Girl Howrah 👉 8250192130 Available With Room
 
Call Girls In Sikandarpur Gurgaon ❤️8860477959_Russian 100% Genuine Escorts I...
Call Girls In Sikandarpur Gurgaon ❤️8860477959_Russian 100% Genuine Escorts I...Call Girls In Sikandarpur Gurgaon ❤️8860477959_Russian 100% Genuine Escorts I...
Call Girls In Sikandarpur Gurgaon ❤️8860477959_Russian 100% Genuine Escorts I...
 
Enhancing and Restoring Safety & Quality Cultures - Dave Litwiller - May 2024...
Enhancing and Restoring Safety & Quality Cultures - Dave Litwiller - May 2024...Enhancing and Restoring Safety & Quality Cultures - Dave Litwiller - May 2024...
Enhancing and Restoring Safety & Quality Cultures - Dave Litwiller - May 2024...
 
Vip Female Escorts Noida 9711199171 Greater Noida Escorts Service
Vip Female Escorts Noida 9711199171 Greater Noida Escorts ServiceVip Female Escorts Noida 9711199171 Greater Noida Escorts Service
Vip Female Escorts Noida 9711199171 Greater Noida Escorts Service
 

Wfm 1115

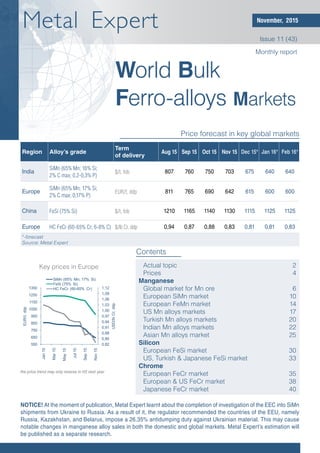
  • 1. Key prices in Europe World Bulk Ferro-alloys Markets Contents Price forecast in key global markets Metal Expert Issue 11 (43) the price trend may only reverse in H2 next year Monthly report Region Alloy’s grade Term of delivery Aug 15 Sep 15 Oct 15 Nov 15 Dec 15* Jan 16* Feb 16* India SiMn (65% Mn; 16% Si; 2% C max; 0,2-0,3% P) $/t, fob 807 760 750 703 675 640 640 Europe SiMn (65% Mn; 17% Si; 2% C max; 0,17% P) EUR/t, ddp 811 765 690 642 615 600 600 China FeSi (75% Si) $/t, fob 1210 1165 1140 1130 1115 1125 1125 Europe HC FeCr (60-65% Cr; 6-8% C) $/lb Cr, ddp 0,94 0,87 0,88 0,83 0,81 0,81 0,83 *-forecast Source: Metal Expert 0,82 0,85 0,88 0,91 0,94 0,97 1,00 1,03 1,06 1,09 1,12 550 650 750 850 950 1050 1150 1250 1350 Jan15 Mar15 May15 Jul15 Sep15 Nov15 USD/lbCr,ddp EUR/t,ddp SiMn (65% Mn; 17% Si) FeSi (75% Si) HC FeCr (60-65% Cr) November, 2015 Actual topic 2 Prices 4 Manganese Global market for Mn ore 6 European SiMn market 10 European FeMn market 14 US Mn alloys markets 17 Turkish Mn alloys markets 20 Indian Mn alloys markets 22 Asian Mn alloys market 25 Silicon European FeSi market 30 US, Turkish & Japanese FeSi market 33 Chrome European FeCr market 35 European & US FeCr market 38 Japanese FeCr market 40 NOTICE! At the moment of publication, Metal Expert learnt about the completion of investigation of the EEC into SiMn shipments from Ukraine to Russia. As a result of it, the regulator recommended the countries of the EEU, namely Russia, Kazakhstan, and Belarus, impose a 26.35% antidumping duty against Ukrainian material. This may cause notable changes in manganese alloy sales in both the domestic and global markets. Metal Expert’s estimation will be published as a separate research.
  • 2. World Bulk Ferro-alloys Markets November, 2015 © Metal Expert 2 Actual topic Ferroalloy prices set to bottom out Ferroalloy prices have kept decreasing in the global market this month. Man- ganese alloy prices have lost 5% in India, 8% in Europe and the USA, and 4% in Turkey and Asia. Silicon alloys have got some 3% cheaper all over the world and chrome alloys – 4% cheaper. The decreasing trend is explained by sluggish demand and oversupply. According to the WSA, carbon steel production dropped by 3% year-on-year in October. Chinese output declined by 2.2% and is now falling at a faster pace. Lower supply should have resulted in the margin recovery, but the oversupply kept pushing finished steel prices down. Specifically, prices for Chinese HRC lost $14/t reaching $256‑266/t ex-warehouse VAT excluded and export quota- tions – $260‑270/t FOB including taxes. No price recovery is possible right now in light of excessive supply coupled with lowering consumption in the Chinese domestic market. In order to maintain capacity utilization, the Chinese keep en- larging exports, offering the material at very low prices. The majority of Chinese steelmakers keep working at a loss in both the domestic and export markets. In order to prevent further losses, they tried to push long prices up last month, but in vain. The only to recover the margin is to reduce raw material prices, but it will not result in a margin recover as raw materials are already very cheap. The markets for metallurgical raw materials (excluding ferroalloys) and finished steel seem to have reached the price bottom already. In December, a slight decrease is likely to take place, but in general Chinese, Asian, European, and Turkish steelmakers have been working at a loss for quite a long time, except for some US companies. Whereas in early 2014 the price dynamics in the global ferroalloy market was in accordance with the metallurgical price trend, since May 2015 the decreasing price trend has slowed down because of the temporal stabilization in manganese ore quotations and some speculations. In H2, global prices for steel products, billets and scrap have lost some 30%, whereas those for SiMn – only 16%. In September-October, manganese ore prices slipped and the quotes for December are already voiced below the level of production expenses. Thus, ferroalloy prices will inevitably go down, following the decrease in steel product markets in August-October. Ferroalloy markets will only stabilize in February, whereas the price trend may only reverse in H2 next year.
  • 3. World Bulk Ferro-alloys Markets November, 2015 © Metal Expert 3 Mn Ferroalloy prices seem to have room for decrease further, $ per tonne Back to top 0 200 400 600 800 1000 1200 100 200 300 400 500 600 Jan 14 May 14 Sep 14 Jan 15 May 15 Sep 15 HRC Steel scrap billet SiMn, R
  • 4. World Bulk Ferro-alloys Markets November, 2015 © Metal Expert 4 Mn Region/alloy Term of delivery Jun 15 Jul 15 Aug 15 Sep 15 Oct 15 Nov 15 SILICOMANGANESE Europe, contract prices, 65% Mn; 17% Si; 0,17% P EUR/t, ddp 800 800 800 770 770 770 Europe, spot prices, 65% Mn; 17% Si; 0,17% P EUR/t, ddp 814 812 811 765 690 642 North, spot prices, 65% Mn; 17% Si; 0,17% P EUR/t, ddp 812 812 810 762 688 640 South, spot prices, 65% Mn; 16% Si; 0,2-0,3% P EUR/t, ddp 808 789 788 767 687 621 East, spot prices, 65% Mn; 17% Si; 0,17% P EUR/t, ddp 816 808 814 775 695 647 USA, 65% Mn; 17% Si $/t, ddp 1155 1095 1075 985 937 860 China, 65% Mn; 17% Si $/t, exw 868 848 790 740 715 675 China, 65% Mn; 17% Si $/t, fob 1520 1520 1520 1520 1520 1520 India, 65% Mn; 16% Si $/t, fob 820 821 807 760 750 703 South Korea, 65% Mn; 16% Si $/t, fob - - - - - - Turkey, 70% Mn; 17% Si from Ukraine $/t, cif 905 905 890 860 814 785 Turkey, 70% Mn; 17% Si from Georgia $/t, cif 1025 1025 1010 1005 950 - Turkey, 65% Mn; 16% Si from India $/t, cif 847 850 845 810 760 725 Turkey, 60% Mn; 14% Si from India $/t, cif 775 775 767 745 700 680 Japan, 65% Mn; 16% Si $/t, cif 835 835 825 770 760 720 HC FERROMANGANESE Europe, contract prices, 78% Mn EUR/t, ddp 770 770 770 745 745 745 Europe, spot prices, 78% Mn EUR/t, ddp 770 760 776 745 700 659 USA, 78% Mn $/t, ddp 935 900 850 835 825 810 China, 75% Mn $/t, exw 907 873 800 770 725 632 China, 75% Mn $/t, fob 1500 1500 1500 1500 1500 1500 India, 75% Mn $/t, fob 783 770 750 720 700 670 South Korea, 75% Mn $/t, fob 800 785 740 710 660 640 Japan, 75% Mn $/t, cif 799 795 765 730 718 660 Prices Dynamics of bulk ferro-alloys prices in world markets
  • 5. World Bulk Ferro-alloys Markets November, 2015 © Metal Expert 5 Note: monthly average spot prices unless other mentioned; contract prices effective for delivery period of over three months, spot ones – for shipments within 1 month Source: Metal Expert Region/alloy Term of delivery Jun 15 Jul 15 Aug 15 Sep 15 Oct 15 Nov 15 MC FERROMANGANESE Europe, contract prices, 82% Mn EUR/t, ddp 1190 1190 1190 1135 1135 1135 Europe, spot prices, 82% Mn EUR/t, ddp 1185 1185 1185 1135 1060 1040 FERROSILICON Europe, contract prices, 75% Si EUR/t, ddp 1225 1225 1225 1170 1170 1170 Europe, spot prices, 75% Si EUR/t, ddp 1225 1205 1185 1170 1070 975 China, 75% Si $/t, fob 1210 1210 1210 1165 1140 1130 USA, 75% Si $/t, ddp 1390 1380 1370 1330 1275 1150 Turkey, 75% Si from China $/t, cif 1260 1260 1245 1212 1080 1065 Turkey, 75% Si from Vietnam $/t, cif 1132 1143 1125 1078 1015 965 Turkey, 72% Si from Vietnam $/t, cif 1095 1107 1107 1025 960 940 Turkey, 70% Si from Vietnam $/t, cif 1065 1075 1075 1000 940 915 Turkey, 75% Si from Russia $/t, cif 1187 1190 1125 1113 1055 1005 Turkey, 65% Si from Russia $/t, cif 1060 1060 1030 1010 930 905 Turkey, 65% Si from Ukraine $/t, cif 1085 1085 1085 1085 985 985 Turkey, 70% Si from India $/t, cif 1120 1135 1175 1138 1110 1090 FERROCHROME Europe, Charge chrome $/lb Cr 1,08 1,08 1,08 1,08 1,04 1,04 Europe, HC, 60-65% Cr, 6-8% C $/lb Cr, ddp 0,95 0,94 0,94 0,87 0,88 0,83 Europe, LC, 68-70% Cr; 0.10% C $/lb Cr, ddp 2,01 2,00 1,99 1,98 1,96 1,90 Japan, Charge chrome $/lb Cr 1,16 1,16 1,16 1,16 1,12 1,12 Japan, LС, 65% Cr, 0.10% C $/lb Cr, ddp 2,00 1,98 1,97 1,97 1,95 1,90 India, HC, 60% Cr, 6-8% C $/lb Cr, fob 0,82 0,80 0,79 0,74 0,72 0,70 USA, HC, 60-65% Cr, 6-8% C $/lb Cr, ddp 1,08 1,08 1,08 1,05 1,03 0,98 USA, LC, 0.10% C $/lb Cr, ddp 2,06 2,06 2,06 2,06 2,05 2,01 Back to top
  • 6. World Bulk Ferro-alloys Markets November, 2015 © Metal Expert 6 Mn Price forecast for manganese ore (46% Mn) CIF China Price forecast for manganese ore (38% Mn) CIF China 3,20 3,20 3,20 3,10 2,70 2,70* 2,60 2,60 2,60 2,00 2,50 3,00 3,50 Jul15 Aug15 Sep15 Oct15 Nov15 Dec15 Jan16 Feb16 Mar16 USD/dmtu 2,70 2,65 2,65 2,65 2,50* 2,40* 2,40 2,40 2,40 1,50 2,00 2,50 3,00 3,50 Jul15 Aug15 Sep15 Oct15 Nov15 Dec15 Jan16 Feb16 Mar16 USD/dmtu Global market for Mn ore Prices for December shipments of manganese ore have not been announced at the time of publication of this report. South32 cut November prices for the material (45.5% Mn) to $2.7/dmtu, down $0.4/dmtu from October, and those for the material (48% Mn) to $2.5/dmtu. Eramet has reduced quotations of the material (44% Mn) by $2.4/dmtu. According to Metal Expert’s data, the material (38% Mn) is not shipped to China right now. All prices are CIF China. Last month, steel output rose by 2% quarter-on-quarter, losing 3% year- on-year though. In 10 months, the decrease was 2.5% y-o-y against 2.4% y-o-y in 9 months. Chinese output declined by 2.2% to 672.8 million t in 10 months. Global output (excluding China) came down by 2.8% to 670.8 million t. Steel production is believed to keep decreasing together with manganese demand. According to preliminary data, global manganese ore sales dropped by 5% year-on-year to 19.6 million t throughout January-September. Imports to China dropped by 5% to 11.8 million t and those to India – by 34% to 1.7 million t. The countries that have vertically integrated producers raised imports. Ukraine raised shipments from abroad by 47% to 1 million t, Norway – by 4% to 900,000 tpy, and France – by more than 2 times to 400,000 t. Nonetheless, these upturns are only just for in-house shipments and have no impact on the global free market. Imports to South Korea and Japan rose by a total of 6% to 1.9 million t. * - Metal Expert’s estimate
  • 7. World Bulk Ferro-alloys Markets November, 2015 © Metal Expert 7 Mn Comparison of global Mn ore trade and steel ouput 1.5 1.7 1.9 2.1 2.3 2.5 2.7 2.9 May14 Jun14 Jul14 Aug14 Sep14 Oct14 Nov14 Dec14 Jan15 Feb15 Mar15 Apr15 May15 Jun15 Jul15 Aug15 Sep15 125 127 129 131 133 135 137 139 141 143 145Mn ore world trade World steel production, R '000t '000t Global manganese ore sales will keep decreasing because steel production is supposed to keep declining. Over the whole year, sales will reach 26 million t against 27 million t in 2014. Low profitability will result in production optimization by the biggest companies, and some facilities will be stopped. This month, South32 has closed Mamatwan mine, having plans on bringing it back on stream in Janu- ary. However, production at the company’s assets will drop by no more than 1.5% to 8.5 million t this year. Eramet raised output by 12% year-on-year and 8% quarter-on-quarter to 1.07 million t in Q3. Vale’s output was unchanged in annual compassion, adding 18% q-o-q though. China’s port stocks have almost stopped decreasing. In November, it reached 2.87 million t, down 0.2% m-o-m, which is comparable to 2-month imports. The stocks have been minimal since February 2014. Demand continues to fall. Production of SiMn reached 373,000 t in October, down 8.8% m-o-m, and that of FeMn – 116,000 t, down 15.7%.
  • 8. World Bulk Ferro-alloys Markets November, 2015 © Metal Expert 8 Mn China’s port stocks of Mn ore get stabilized 2,0 2,2 2,4 2,6 2,8 3,0 3,2 3,4 3,6 3,8 4,0 2,0 2,5 3,0 3,5 4,0 4,5 5,0 5,5 6,0 6,5 7,0 Apr11 Sep11 Feb12 Jul12 Dec12 May13 Oct13 Mar14 Aug14 Jan15 Jun15 Nov15 mt USD/dmtu Mn ore stockpiles in ports price for Mn ore (48% Mn) Taking into account Metal Expert’s calculation of the cost of mining for the biggest producers, it is obvious that the companies with low inputs enlarge manufacture and the others, on the contrary, reduce it. Thus, the most effective producers are trying to raise their market share and force the rivals from the business. The average input cost of the ore (46% Mn), including transportation to Chinese ports, will be $2.26.dmtu this year. Manganese ore demand will keep slackening over the period under review. In January, it will reach its 3-year lowest because of the decrease in global steel output, so prices will most likely come down. Back to top
  • 9. World Bulk Ferro-alloys Markets November, 2015 © Metal Expert 9 Mn Back to top Note: in ‘000 tonnes Note: $/mtu Source: Metal Expert Q2 13 Q3 13 Q4 13 Q1 14 Q2 14 Q3 14 Q4 14 Q1 15 Q2 15 South32 (BHP Billiton) Australia 1307 1182 1256 1019 1319 1210 1289 1136 1268 Africa 939 864 944 782 936 1049 1007 913 820 Assore/ARM (Assmang) Africa 858 864 864 816 816 744 744 810 780 ENRC Kazakhstan 1111 1241 942 759 1058 982 888 452 595 Eramet Comilog Gabon 908 969 966 796 849 961 846 880 997 Vale Brazil 617 621 638 470 505 654 723 592 554 Privat Ukraine 326 294 198 183 282 387 390 145 362 MOIL India 252 231 312 340 273 241 308 317 276 Ghana Manganese Company Ghana 445 484 458 454 455 436 160 310 396 Consolidated Minerals Australia 418 407 401 406 416 436 443 404 371 OM Holdings Australia 208 151 272 222 225 251 192 158 191 Africa 166 226 264 394 535 538 543 474 509 Mineracao Buritirama, Maraba Brazil 63 63 63 63 63 63 63 63 63 Renova (Kalahari Desert) Africa 675 675 675 675 675 675 675 675 675 Dynamics of Mn ore prices in world markets Global manganese ore production Term of delivery May 15 Jun 15 Jul 15 Aug 15 Sep 15 Oct 15 Nov 15 Import to China (Australia, 48% Mn) CIF 3,03 3,03 3,03 3,00 3,00 3,00 2,50 Import to China (Australia, 46% Mn) CIF 3,20 3,20 3,20 3,20 3,20 3,10 2,70 Import to China (South Africa, 38% Mn) CIF 2,70 2,70 2,70 2,65 2,65 2,65 -
  • 10. World Bulk Ferro-alloys Markets November, 2015 © Metal Expert 10 Mn European SiMn spot prices forecast 814 812 811 765 690 642 615 600 600 500 600 700 800 900 Jun15 Jul15 Aug15 Sep15 Oct15 Nov15 Dec15 Jan16 Feb16 EUR/t,ddp European SiMn market Contrary to expectations, offers have not stabilized this month. The average weighted benchmark price for SiMn (65% Mn; 17% Si) has dropped from last month’s EUR 690/t DDP to EUR 642/t DDP on the back of low consumption, the collapse of manganese ore quotes, and the availability of stockpiles. SiMn surplus persisted in the European market since May, when imports from India and Ukraine increased despite comparatively stable end use. Speculations over the possible imposition of an antidumping duty against Indian material in September started then, too. It seems like European traders hurried to restock on the alloy beforehand. Fearing that a duty on Ukrainian shipments in Russia may be imposed, Ukrainian merchants tried to partially redirect sales to Europe, although the strengthening of the hryvnia was against them. In May, Europe raised imports by 68,000 t, which is the 2-year maximum. By September, SiMn surplus reached 28,000 t (30% of the average monthly consumption). The market will become balanced in late 2015, Metal Expert believes. The material leftover will not exceed 5,000-10,000 t.
  • 11. World Bulk Ferro-alloys Markets November, 2015 © Metal Expert 11 Mn European SiMn market balance -60 -40 -20 0 20 40 60 Q314 Q414 Q115 Q215 Q315* Q415* Q116* '000tonnes Source: Metal Expert*- forecast SiMn shipments from abroad will come down. Imports reached a local mini- mum of 40,000 t back in September. Purchases were at this level last September, but this year steel output dropped by almost 4% (1 million t) year-on-year. Indian merchants have been working at a loss for quite a long time and they are unable to compete with Ukrainian and South African suppliers. Besides, the quality of Indian alloys is worse than that of the analogs. In H2, shipments from India to Europe reached 10,000-13,000 tpm against 18,000 tpm averagely in H1. The dynamics of shipments from Ukraine is the quite the same. Ukraine and South Africa have been forcing India from the European SiMn market for the past 3 years. In 2013, India was the biggest importer of the alloy, covering 38% of all foreign shipments, whereas the shares of Ukraine and South Africa were 19% and 6% respectively. Last year, Indian companies lost 9 percentage points, securing 20% of European imports to themselves, whereas Ukrainian and South African merchants raised their shares to 27% and 17% respectively. By Metal Expert’s preliminary estimate, in 2015 Ukraine and India will come in par, securing 30% each, whereas South African share will approximate 16%. It will be easier for Ukrainian and South African companies to compete in the low market as they both have raw material sources of their own and their national currencies keep devaluating.
  • 12. World Bulk Ferro-alloys Markets November, 2015 © Metal Expert 12 Mn India lost its competitiveness in Europe (production costs comparison), $ per tonne 400 500 600 700 800 900 1000 1100 1200 1300 Jan 14 May 14 Sep 14 Jan 15 May 15 Sep 15 $/tonne Domestic price India Ukraine RSA End user activity is unlikely to recover soon. Regional steel output will reach 169.5 million t in 2015 against 171.5 million t last year. In Q1, the output will hardly exceed 42 million t, which is 5-6% lower than in 2013-2014 and 3% lower than in the post-crisis first quarter of 2010. China is still the main reason behind the negative situation in the global steel market. By late November, export prices for Chinese HRC have reached $260-265/t FOB, $20/t below Ukrainian and Turkish billet quotations. Besides, it is respectively $100/t and $95/t lower than prices for European flats and longs. The Chinese keep working with negative profitability in both the domestic and foreign markets, which is making them lower production, but not exports. China’s steel manufacture dropped by 2.2% month-on-month in October, the NBS reports. However, this decrease in not enough, Metal Expert thinks. It is still likely that European manganese alloy prices will keep decreas- ing. Stabilization is possible during the holidays in late December – early January, yet the price trend is not supposed to reverse until the end of Q1. Back to top
  • 13. World Bulk Ferro-alloys Markets November, 2015 © Metal Expert 13 Mn Back to top Source: Metal Expert * - forecast, ** - preliminary data Note: in ‘000 gross tonnes Apr 15 May 15 Jun 15 Jul 15 Aug 15 Sep 15** Q4 15* Q1 16* PRODUCTION 46 47 45 44 43 48 134 129 by company Ferroatlantica 10 10 10 10 10 10 31 30 Glencore 9 9 9 8 8 8 27 27 Eramet 23 23 23 24 24 24 71 70 OFZ 4 5 3 2 1 5 5 2 Skopski Leguri 0 0 0 0 0 0 0 0 Feral 0 0 0 0 0 0 0 0 Other 0 0 0 0 0 0 0 0 EXPORT 10 8 6 13 2 4 21 19 IMPORT 48 68 52 48 59 40 142 143 by countries CIS 14 23 16 10 10 10 - - India 22 18 16 13 20 10 - - China 0 0 0 0 0 0 - - Africa 3 7 8 18 17 4 - - South America 2 1 0 0 0 0 - - Middle East 0 0 0 0 0 0 - - Other countries 8 19 12 6 12 15 - - APPARENT CONSUMPTION 85 107 91 79 100 83 255 253 STEEL PRODUCTION 14460 15552 14746 13810 12361 13761 40166 42131 ESTIMATED CONSUMPTION 89 96 91 85 76 85 248 260 BALANCE -5 11 0 -6 24 -2 7 -7 European silicomanganese market structure European silicomanganese market [Mn content] Source: Metal Expert * - forecast, ** - preliminary data Note: in ‘000 tonnes Apr 15 May 15 Jun 15 Jul 15 Aug 15 Sep 15** Q4 15* Q1 16* Production 30 31 30 29 28 31 87 84 Export 6 5 4 8 2 3 14 12 Import 32 45 35 31 39 26 93 94 Apparent Consumption 56 71 60 52 66 55 167 166 Estimated Consumption 59 63 60 56 50 56 163 171 Balance -3 8 1 -4 16 -1 4 -4
  • 14. World Bulk Ferro-alloys Markets November, 2015 © Metal Expert 14 Mn European FeMn market European HC FeMn spot prices forecast 770 760 776 745 700 659 645 640 640 500 600 700 800 Jun15 Jul15 Aug15 Sep15 Oct15 Nov15 Dec15 Jan16 Feb16 EUR/t,ddp Manganese alloy prices have kept decreasing in Europe this month. The average weighted benchmark price for HC FeMn (75% Mn) has gone down from EUR 700/t DDP to EUR 659/t DDP on the back of low consumption and high competition. Prices are going down, though there is no surplus. As of late October, the accumulated shortage has reached 10,000 t (25% of the average monthly consumption) because of the notable decrease in imports. Imports will stay low in winter, whereas consumption will most likely stabilize, the deficit will continue. European HC FeMn market balance -60 -40 -20 0 20 40 60 Q314 Q414 Q115 Q215 Q315* Q415* Q116* '000tonnes Source: Metal Expert *- forecast
  • 15. World Bulk Ferro-alloys Markets November, 2015 © Metal Expert 15 Mn The decrease in SiMn and FeSi prices will impact FeMn quotations. Over the year, the alloys have got 20% cheaper, whereas FeMn has dropped only by 8%. This month, the cost of the alternative blend of HC FeMn and FeSi has been EUR 150/t above that of SiMn (EUR 100/t over the year and EUR 65/t in Q1). FeMn imports are unlikely to come up in the near future. At South Af- rica’s South32, three out of the four installed furnaces are still idle. Assmang’s equipment is out of operation, too. Besides, South32 has suspended mining at Mamatwan until January at least. The material from Wessels mine will most likely be exported and the ore to cover the company’s own needs will be limited. FeMn production is unlikely to change in Europe. Production cutbacks mean an increase the fixed costs in the inputs, which is unacceptable for pro- ducers right now. Such a strategy is only useful when prices bottom out and the least effective suppliers are forced out from the market. Then, additional cutbacks may push prices up. Next month, the price decrease, if any, will moderate in the European FeMn market. Prices will stabilize after Christmas holidays. Back to top
  • 16. World Bulk Ferro-alloys Markets November, 2015 © Metal Expert 16 Mn Back to top Source: Metal Expert. * - forecast, ** - preliminary data. Note: in ‘000 gross tonnes European HC FeMn market structure Apr 15 May 15 Jun 15 Jul 15 Aug 15 Sep 15** Q4 15* Q1 16* PRODUCTION 26 25 27 28 29 24 77 76 by company Glencore 11 11 11 11 11 11 28 30 Eramet 5 5 5 5 5 5 17 15 Ferroatlantica 8 8 8 8 8 8 23 23 OFZ 1 0 3 4 6 0 9 8 Others 0 0 0 0 0 0 0 0 EXPORT 2 1 3 0 0 1 3 2 IMPORT 17 20 16 18 18 14 34 40 by countries CIS 3 2 3 4 4 6 - - India 0 0 0 1 3 3 - - China 0 0 0 0 0 0 - - Africa 13 17 12 13 10 5 - - South America 0 0 0 0 0 0 - - Other countries of the world 0 0 0 1 1 1 - - APPARENT CONSUMPTION 41 44 40 46 47 38 108 114 STEEL PRODUCTION 14460 15552 14746 13810 12361 13761 40166 42131 ESTIMATED CONSUMPTION OF HC FEMN 44 47 45 42 37 42 122 128 BALANCE -3 -4 -4 4 9 -4 -14 -14 European MC&LC FeMn market structure Apr 15 May 15 Jun 15 Jul 15 Aug 15 Sep 15** Q4 15* Q1 16* PRODUCTION 24 24 24 24 24 24 67 68 by company Eramet 21 21 21 21 21 21 59 60 Ferroatlantica 3 3 3 3 3 3 8 8 Others 0 0 0 0 0 0 0 0 EXPORT 1 1 2 1 1 1 4 4 IMPORT 4 12 4 3 4 2 14 12 by countries CIS 0 1 0 0 0 0 - - India 0 0 0 0 0 0 - - China 0 0 0 0 0 0 - - Africa 4 11 4 3 4 2 - - South America 0 0 0 0 0 0 - - Middle East 0 0 0 0 0 0 - - Other countries of the world 0 0 0 0 0 0 - - APPARENT CONSUMPTION 26 35 26 25 27 25 77 76 STEEL PRODUCTION 14460 15552 14746 13810 12361 13761 40166 42131 ESTIMATED CONSUMPTION OF MC&LC FEMN 28 30 28 27 24 27 78 81 BALANCE -2 5 -3 -2 3 -2 -1 -5
  • 17. World Bulk Ferro-alloys Markets November, 2015 © Metal Expert 17 Mn US Mn alloys markets US SiMn spot prices forecast US HC FeMn spot prices forecast 1155 1095 1075 985 937 860 730 720 710 500 600 700 800 900 1000 1100 1200 1300 1400 Jun15 Jul15 Aug15 Sep15 Oct15 Nov15 Dec15 Jan16 Feb16 USD/t,ddp 935 900 850 835 825 810 800 780 780 500 600 700 800 900 1000 1100 1200 Jun15 Jul15 Aug15 Sep15 Oct15 Nov15 Dec15 Jan16 Feb16 USD/t,ddp The US spot market for manganese alloys has been weak this month. SiMn (65% Mn; 17% Si) has been available at $0.39/lb ($860/t) DDP, down 8.2% month- on-month, and HC FeMn (75% Mn) – at $810/t DDP, down 1.7% from October. The recession in the global steelmaking industry still has a bad influence on the ferroalloy market. By Metal Expert’s estimate, US carbon steel production will reach 79.79 million t in 2015, which is a 6-year minimum. The output is unlikely to increase in Q1, given that some local producers have stopped manu- facture until the market strengthens. In January-March, the output will drop by 3.4% quorter-on-qourter and 6.3% year-on-year to 18.62 million t. SiMn is still oversupplied, although the decrease in supply has been 18.5% y-o-y over January-November and that in consumption – 9.3% y-o-y. By Metal Expert’s estimate, SiMn stocks will reach 15,000 t by late December (some 40% of the average monthly consumption), so the market balance will be hardly reachable during Q1.
  • 18. World Bulk Ferro-alloys Markets November, 2015 © Metal Expert 18 Mn US SiMn market balance -50,0 -30,0 -10,0 10,0 30,0 50,0 Q214 Q314 Q414 Q115 Q215 Q315 Q415* Q116* '000tonnes Source: Metal Expert *- forecast Imports structure is likely to change in the near future. Next quarter, SiMn production is going to be launched at Malaysian plants Pertama Fer- roalloys, OM Sarawak, and Sakura Ferroalloys, which will possibly ship their material to the USA. By Metal Expert’s estimate, Malaysia will be putting out 10,000-15,000 tpm and 30,000-35,000 tpm by end-2016. From the other hand, imports from Australia will minimize in early 2016, whereas in November its share was 16.7%. The price decrease may speed up in the near future. Given that the Novem- ber decrease in European quotations has been bigger than that in the USA, the premium value of the American market has increased by 10% month-on-month. The strengthening of the US dollar will result in lower inputs and higher competi- tion. The Georgian lari is unlikely to keep devaluating in the future, whereas the South African rand will keep getting weaker. In particular, since mid-May the lari has got a mere 2% against the dollar and rand – 20% cheaper. SiMn prices will keep decreasing in the USA amid sluggish consumption and tough competition among foreign suppliers. Back to top
  • 19. World Bulk Ferro-alloys Markets November, 2015 © Metal Expert 19 Mn Back to top Source: Metal Expert * - forecast, ** - preliminary data Note: in ‘000 gross tonnes Source: Metal Expert * - forecast, ** - preliminary data Note: in ‘000 gross tonnes Apr 15 May 15 Jun 15 Jul 15 Aug 15 Sep 15 Q4 15* Q1 16* PRODUCTION 7 7 7 7 7 9 28 29 EXPORT 0,7 1,7 1,0 0,6 0,7 0,8 1,7 1,6 IMPORT 39 45 25 33 19 27 76 72 by countries Georgia 14 14 0 16 2 17 13 22 Africa 12 9 12 8 7 0 36 30 Norway 2 2 5 2 3 0 1 1 Other countries 11 20 9 7 8 10 26 19 APPARENT CONSUMPTION 45 50 32 40 26 35 102 99 STEEL PRODUCTION 6413 6844 6843 7032 6936 6557 19282 18619 ESTIMATED CONSUMPTION 34 36 36 37 37 35 102 99 BALANCE 11 14 -5 2 -11 0 0 0 Apr 15 May 15 Jun 15 Jul 15 Aug 15 Sep 15 Q4 15* Q1 16* PRODUCTION 1 1 1 1 1 1 3 3 EXPORT 2,1 1,7 1,0 1,1 1,2 1,8 4,0 4,0 IMPORT 7 36 14 10 14 9 33 43 by countries Africa 1 22 12 6 8 5 13 12 Australia 5 0 1 0 7 0 3 9 Norway 1 0 0 1 0 0 7 7 Other countries 0 2 1 3 0 4 0 6 APPARENT CONSUMPTION 6 35 14 10 14 8 32 42 STEEL PRODUCTION 6413 6844 6843 7032 6936 6557 19282 18619 ESTIMATED CONSUMPTION 19 20 20 21 20 19 56 54 BALANCE -13 15 -6 -10 -6 -11 -24 -12 USA silicomanganese market structure USA ferromanganese market structure
  • 20. World Bulk Ferro-alloys Markets November, 2015 © Metal Expert 20 Mn Note: in ‘000 tonnes * - Metal Expert estimation Turkish Mn alloys markets Apr 15 May 15 Jun 15 Jul 15 Aug 15 Sep 15 PRODUCTION* 0,0 0,0 0,0 0,0 0,0 0,0 EXPORT 0,0 0,0 0,2 0,3 0,1 0,0 IMPORT 25,0 15,5 22,3 20,4 9,5 13,5 by suppliers Ukraine 18,6 8,0 16,5 16,9 8,8 11,4 India 5,3 6,0 4,7 3,0 0,5 1,6 Georgia 0,1 0,5 0,1 0,4 0,2 0,5 Norway 1,0 1,0 1,0 0,1 0,0 0,0 Others 0,0 0,0 0,0 0,0 0,0 0,0 DOMESTIC MARKET 25,0 15,5 22,2 20,1 9,4 13,4 STEEL PRODUCTION 2775 2919 2844 2539 2563 2489 ESTIMATED CONSUMPTION 21,5 22,6 22,0 19,7 19,9 19,3 BALANCE 3,5 -7,1 0,2 0,4 -10,4 -5,8 Turkish SiMn market structure Back to top
  • 21. World Bulk Ferro-alloys Markets November, 2015 © Metal Expert 21 Mn Turkish FeMn market structure Note: in ‘000 tonnes Back to top Apr 15 May 15 Jun 15 Jul 15 Aug 15 Sep 15 DOMESTIC MARKET by products and suppliers HC FeMn 1,5 0,5 2,2 4,4 4,8 3,1 Russia 0,0 0,0 0,0 0,0 0,0 0,0 India 0,0 0,0 0,0 0,6 0,1 0,1 South Africa 0,7 0,0 0,0 0,3 0,0 0,2 Ukraine 0,3 0,0 2,1 2,6 2,2 2,2 Others 0,5 0,5 0,1 0,8 2,5 0,7 MC and LC FeMn 1,7 2,4 1,9 1,6 1,2 0,0 Norway 1,3 2,1 1,1 0,2 0,6 0,1 South Africa 0,0 0,0 0,0 0,0 0,0 0,0 South Korea 0,0 0,1 0,5 1,1 0,5 0,1 Ukraine 0,0 0,0 0,0 0,0 0,0 0,0 Others 0,3 0,2 0,3 0,3 0,1 -0,2 STEEL PRODUCTION 2775 2919 2844 2539 2563 2489 ESTIMATED HC FeMn CONSUMPTION 2,7 2,8 2,8 2,5 2,5 2,4 BALANCE -1,2 -2,3 -0,6 1,9 2,3 0,7 ESTIMATED MC FeMn and LC FeMn CONSUMPTION 1,0 1,1 1,1 1,0 1,0 0,9 BALANCE 0,6 1,3 0,8 0,6 0,3 -1,0
  • 22. World Bulk Ferro-alloys Markets November, 2015 © Metal Expert 22 Mn Indian Mn alloys markets SiMn spot prices forecast in India 820 821 807 760 750 703 675 640 640 600 650 700 750 800 850 Jun15 Jul15 Aug15 Sep15 Oct15 Nov15 Dec15 Jan16 Feb16 USD/t,fob This month, Indian SiMn (65% Mn; 16% Si) has been available at $680-700/t FOB India, down $60/t month-on-month, and the material (60% Mn; 14% Si) – at $625-650/t FOB India, down $60/t. Indian merchants are still pressured by sluggish demand in the global market and intense competition. Their positions are still quite shaky in Europe and Turkey. Despite the equalization of the chances in the competition with the Ukrainians, the competition with the Europeans is still rather intense. The Europeans try to offload stocks before the end of the year and thus are keener to grant discounts. The gap between Indian and European prices could reach EUR 50/t at times during this month. Demand will possibly burst in the middle of Q1 as the Europeans will try to restock on the alloy before the imposition of an antidumping duty in March. However, demand will not be strong enough for a price recovery, taking into account the negative market picture. The situation may be aggravated by the appearance of a new rival, Malay- sia. A number of ferroalloy plants are going to be launched there in the future. In Q1, SiMn production will possibly be commenced in Pertama Ferroalloys, OM Sarawak, and Sakura Ferroalloys. At first, Malaysia is estimated to be pro- ducing 10,000-15,000 tpm, but the output may increase to 30,000-35,000 tpm by the end of 2016. New players plan to embrace the markets of Europe, Asia, and the USA, low electricity tariffs and cheap raw materials to be their main competitive advantage. In the meantime, a lot of Indian suppliers lose their ability to further cut offers. Most of the country’s producers have been working at a loss for the third consecutive month. Production expenses declined by $29/t as a result of the decrease in cost of both import and local manganese ore. Nevertheless, the losses have increased by $19/t to $39/t this month (including all possible
  • 23. World Bulk Ferro-alloys Markets November, 2015 © Metal Expert 23 Mn compensations). Although there are no incentives for shipments to Europe, some sellers are entering the competitive struggle there, thus suffering huge losses (some $74/t). Within the next few months, the decrease in the alloy prices will be faster than that in raw material quotations, so the profitability will also be on the way down (to $30/t monthly). Only financially strong companies and those few who have their own raw material sources will manage to survive under these circumstances. However, they may soon reach the edge of profitability as well, for their pricing bottom is estimated to be at $700/t FOB India. Under the circumstances, Indian producers will either have to reduce or stop manufacture. This year, SiMn production may total 1.47 million t (down 9.4% year-on-year) on the back of excessive supply resulting from bad de- mand. In Q1, producers will have to cut output again because of the worsening financial state, some will leave the market. Production may be decreased by 20,000-25,000 t as compared to the previous period to 320,000 t; the volumes of SiMn available for export is estimated to amount to 100,000 t, down 22.5%. However, these measures are likely to show some positive results only in mid- or long-term perspective. In the coming months, Indian suppliers will not be able to recover prices because of the negative trend in the global market. However, the capabil- ity for price cuts will be limited in view of the difficult financial state of Indian producers. Back to top
  • 24. World Bulk Ferro-alloys Markets November, 2015 © Metal Expert 24 Mn Back to top Source: Metal Expert * - forecast, ** - preliminary data *** - volumes available for export Note: in ‘000 gross tonnes Indian SiMn market structure Q1 15 Q2 15 Q3 15 Q4 15* Q1 16* PRODUCTION 401 372 351 345 320 by company Abhijeet Group 22 13 21 - - Bhaskar Group 5 6 5 - - Cosmic Ferro Alloys 5 3 3 - - Nava Bharat Ventures Ltd. 25 7 5 - - Other 345 345 317 - - IMPORT 0 0 0 0 0 DOMESTIC CONSUMPTION 224 201 231 216 220 EXPORT 177 171 120 129*** 100*** by countries Japan 41 36 27 - - Taiwan 26 22 14 - - Turkey 14 16 5 - - Netherlands 10 9 5 - - South Korea 9 7 6 - - Thailand 8 7 7 - - Germany 5 5 1 - - Ukraine 1 1 1 - - Others 63 68 54 - - STEEL PRODUCTION 22504 22724 22347 22450 22850
  • 25. World Bulk Ferro-alloys Markets November, 2015 © Metal Expert 25 Mn Asian Mn alloys market Japanese SiMn spot prices forecast Japanese HC FeMn spot prices forecast 835 835 825 770 760 720 700 680 680 600 650 700 750 800 850 Jun15 Jul15 Aug15 Sep15 Oct15 Nov15 Dec15 Jan16 Feb16 USD/t,CIF 799 795 765 730 718 660 630 620 620 550 600 650 700 750 800 Jun15 Jul15 Aug15 Sep15 Oct15 Nov15 Dec15 Jan16 Feb16 USD/t,CIF The Japan’s market for manganese alloys has again collapsed this month. Prices for Indian SiMn (65% Mn; 16% Si) have dipped by $50/t to $710-730/t CIF Japan. Korean HC FeMn (75% Mn) has been available at $640-660/t CIF Japan, down $65/t, and Indian material – at $660-680/t CIF Japan, down $35/t. Like earlier, there will be no support from the consuming industry. Japan is going to produce 106 million t of steel in FY 2016 (ends in March 2016), down 3.5% from FY 2015. As a result, consumption of SiMn will drop to 340,000 t and that of FeMn – to 426,000 t. Supply of FeMn is going to increase in December-February, whereas that of SiMn will decline. Japan will produce 59,600 t of FeMn in winter (up 14.3%); SiMn production will remain at 9,300 t. Due to the usual production cutbacks, South Korea will be able to export only 26,000 t of HC FeMn (down 17%), of which 20-30% may be shipped to Japan. Low profits make Indian producers reduce manufacture, which is why the amount of SiMn available for export will be at about 100,000 t in Q1 (down 29,000 t), of which 20-30% may be supplied to Japan. SiMn supply structure is changing in Japan and the competition in the seg- ment is getting tougher. As expected, TEMCO has enlarged shipments to Japan. Last quarter, imports from Australia increased by 8,300 t quarter-on-quarter to 10,000 t, its share in the Japanese market coming up from 2.1% to 13%. The share of the alloy imported from Vietnam rose from 13% to 20%. Meanwhile, Indian merchants lost 17% of the Japanese market over April-September, cov- ering only 35% of it. The situation is likely to stay difficult for Indian suppliers, given the expected launch of manganese alloy manufacture in Malaysia. The competition in the Japanese market is going to strengthen in the near future, and Indians will possibly be the ones to yield their market share.
  • 26. World Bulk Ferro-alloys Markets November, 2015 © Metal Expert 26 Mn Japan SiMn market structure 46% 49% 52% 46% 35% Q3 14 Q4 14 Q1 15 Q2 15 Q3 15 India Asian countries Domestic production CIS countries Australia Others The competition is also getting intense for Indian FeMn exporters. South Korean suppliers reduced prices by $65/t and still keep the bottom end of the price range in the Japanese market, their prices being $30/t lower than Indian quotations ($5/t in October). Thus, the Indians will have to accept the price de- crease, or they will lose their market share in Japan. However, Indian suppliers are losing their ability to give considerable discounts as their profitability has been negative over the past few months. HC FeMn spot prices in Japan 630 680 730 780 830 880 930 980 1030 1080 Oct14 Nov14 Dec14 Jan15 Feb15 Mar15 Apr15 May15 Jun15 Jul15 Aug15 Sep15 Oct15 Nov15 USD/t,CIF Source: Metal Expert HC FeMn (75% Mn) origin India HC FeMn (75% Mn) origin South Korea Sellers will have to do business in a rather narrow market within the next several months, given that consumption is going to decrease further and the Malaysians will enter the market soon. High competition will eventually result in further price decrease. Back to top
  • 27. World Bulk Ferro-alloys Markets November, 2015 © Metal Expert 27 Mn SiMn market structure in Japan Apr 15 May 15 Jun 15 Jul 15 Aug 15 Sep 15 PRODUCTION 4,8 3,7 4,4 3,2 3,6 3,1 EXPORT 0,00 0,01 0,00 0,00 0,01 0,00 IMPORT 24,7 23,1 17,3 22,9 19,7 24,1 by country India 16,2 11,2 8,4 8,1 9,0 9,7 Vietnam 1,1 6,2 2,8 5,4 4,3 5,3 Kazachstan 5,7 1,5 4,6 2,6 3,9 2,2 Ukraine 0,0 1,6 0,0 0,0 0,0 0,0 Indonesia 0,6 0,2 0,4 1,0 0,6 0,8 Australia 0,5 0,5 0,6 4,1 0,5 5,2 Others 0,7 1,8 0,4 1,6 1,4 0,9 APPARENT CONSUMPTION 30 27 22 26 23 27 CARBON STEEL PRODUCTION 8 402 8 918 8 535 8 841 8 796 8 575 ESTIMATED CONSUMPTION 26 27 23 24 23 24 BALANCE 4 0 -2 3 0 3 Back to top Source: Metal Expert Note: in ‘000 gross tonnes HC FeMn market structure in Japan Apr 15 May 15 Jun 15 Jul 15 Aug 15 Sep 15 PRODUCTION 19,1 23,2 19,7 19,3 14,5 14,3 EXPORT 0,07 0,03 0,03 0,07 0,04 0,06 IMPORT 6,8 8,1 3,9 3,7 9,2 3,5 by country South Korea 2,0 4,9 1,3 1,8 4,2 0,8 Australia 0,0 1,5 0,5 0,5 2,5 0,5 India 2,0 1,4 1,6 0,9 1,5 0,7 South Africa 2,8 0,3 0,5 0,5 1,0 1,0 Norway 0,0 0,0 0,0 0,0 0,0 0,5 Others 0,0 0,0 0,0 0,0 0,0 0,0 APPARENT CONSUMPTION 26 31 24 23 24 18 CARBON STEEL PRODUCTION 8 402 8 918 8 535 8 841 8 796 8 575 ESTIMATED CONSUMPTION 34 36 35 36 36 35 BALANCE -8 -5 -11 -13 -12 -17 Back to top
  • 28. World Bulk Ferro-alloys Markets November, 2015 © Metal Expert 28 Mn South Korea SiMn market structure Apr 15 May 15 Jun 15 Jul 15 Aug 15 Sep 15 PRODUCTION 15,7 17,0 16,4 15,2 14,5 17,7 EXPORT 2,1 1,3 1,7 2,4 2,4 3,6 IMPORT 9,4 10,3 6,6 6,9 5,0 7,5 by country Ukraine 4,4 5,9 3,7 4,7 1,4 3,2 India 2,9 2,9 0,9 1,2 1,9 2,7 Vietnam 2,0 1,4 2,0 1,0 1,7 0,6 Others 0,1 0,1 0,0 0,0 0,0 1,0 APPARENT CONSUMPTION 23 26 21 20 17 22 CARBON STEEL PRODUCTION 5745 6019 5859 5919 5749 5643 ESTIMATED CONSUMPTION 24 25 25 25 24 24 BALANCE -1 0 -3 -5 -7 -2 Back to top Source: Metal Expert Note: in ‘000 gross tonnes
  • 29. World Bulk Ferro-alloys Markets November, 2015 © Metal Expert 29 Mn Source: Metal Expert Note: in ‘000 gross tonnes South Korea HC FeMn market structure Apr 15 May 15 Jun 15 Jul 15 Aug 15 Sep 15 PRODUCTION 19,1 22,1 19,1 16,1 16,1 18,1 EXPORT 10,7 13,9 13,1 10,9 10,7 12,7 by country Japan 4,0 3,2 2,2 3,8 1,1 1,9 Taiwan 1,6 1,7 0,1 0,3 2,3 3,4 United Arab Emirates 1,8 1,2 1,3 1,2 1,2 1,5 Saudi Arabia 0,5 2,0 1,0 1,0 1,0 1,4 Netherlands 0,0 1,0 1,8 1,7 0,8 1,6 Turkey 0,0 0,0 2,5 0,6 2,5 1,0 Others 2,9 4,7 4,1 2,2 1,9 1,9 IMPORT 0,2 0,3 1,3 0,6 0,6 0,0 Australia 0,0 0,0 0,0 0,0 0,0 0,0 India 0,2 0,3 1,3 0,6 0,6 0,0 APPARENT CONSUMPTION 9 9 7 6 6 5 CARBON STEEL PRODUCTION 5745 6019 5859 5919 5749 5643 ESTIMATED CONSUMPTION 9 10 9 9 9 9 BALANCE -1 -1 -2 -4 -3 -4 Back to top
  • 30. 30 Mn World Bulk Ferro-alloys Markets November, 2015 © Metal Expert 30 Si European FeSi market European FeSi spot prices forecast Chinese FeSi export prices forecast 1225 1205 1185 1170 1070 975 940 920 900 600 700 800 900 1000 1100 1200 1300 1400 Jun15 Jul15 Aug15 Sep15 Oct15 Nov15 Dec15 Jan16 Feb16 EUR/t,ddp 1210 1210 1210 1165 1140 1130 1115 1125 1125 1000 1050 1100 1150 1200 1250 Jun15 Jul15 Aug15 Sep15 Oct15 Nov15 Dec15 Jan16 Feb16 USD/t,fob This month, European merchants have had to reduce FeSi quotes once again due to low demand and intense competition. The average monthly price for the alloy (75% Si) has dropped by EUR 95/t month-on-month to EUR 975/t DDP, reaching its 6-year minimum. The US dollar price has dropped by $166/t due to the 5.3% euro devaluation. Supply has remained excessive in Europe this month. Merchants will most likely fail to offload stocks without losses until the year end. Over the whole year, the surplus may reach 25,000 t, which is 44% of the average monthly consump- tion. In January-February, the market balance is unlikely to recover amid low consumption and the inflow of import material. Balance of European FeSi market -30 -20 -10 0 10 20 30 Q314 Q414 Q115 Q215 Q315 Q415* Q116* '000tonnes Source: Metal Expert *- forecast
  • 31. 31 Mn World Bulk Ferro-alloys Markets November, 2015 © Metal Expert 31 Si Shipments from Malaysia keep depressing the European market. Supply of Malaysian material increases gradually, at the moment accounting for some 4% in the supply structure. Besides, the EUR 20-100/t competitive advantage over European prices (in terms of European quality) allows Malaysians to further strengthen their positions. Soon, Malaysia may cover 7-10% of the European market, and the only measure the Europeans can take to prevent it is to initiate an antidumping investigation against Malaysian material. There will be no support from the consuming industry within the next few months. The situation in the steelmaking industry is unfavourable due to the upturn in purchases of cheap steel from China (this year, exports from the country may add 17% reaching 110 million t) and constant decrease in domestic quotations. The problem is unlikely to be resolved soon, as the European authori- ties delay making the decision on protective measures. As a result, European steelmakers will keep pressuring raw material prices in order to maintain profit- ability. Besides, steel output will drop by 5.6% year-on-year to 42.1 million t in Q1, so FeSi consumption will approximate 60,000-64,000 tpm. European FeSi production may be enlarged. Next quarter, it will add 6.4% quarter-on-quarter to 123,000 t, owing to recovery of operations at Icelandic Alloys (120,000 tpy). However, some companies may lower output in view of the unfavourable market environment. FeSi prices will inevitably keep falling amid excessive supply and the negative conditions in the steelmaking segment. Back to top
  • 32. 32 Mn World Bulk Ferro-alloys Markets November, 2015 © Metal Expert 32 Si Back to top Source: Metal Expert * - forecast, ** - preliminary data Note: in ‘000 tonnes Source: Metal Expert * - forecast, ** - preliminary data Note: in ‘000 tonnes Apr 15 May 15 Jun 15 Jul 15 Aug 15 Sep 15** Q4 15* Q1 16* PRODUCTION 40 42 42 43 43 43 116 123 by company Elkem 11 11 11 12 12 12 26 35 Ferroatlantica 6 6 6 5 5 5 16 16 Finnfjord 7 7 7 7 7 7 22 22 Fesil 7 7 7 7 7 7 20 20 Other 10 11 11 12 12 12 32 31 EXPORT 4 4 4 5 3 3 10 10 IMPORT 23 33 24 26 20 27 73 76 by countries CIS 4 8 5 4 5 5 - - India 3 3 3 4 2 2 - - China 0 0 0 0 0 0 - - Africa 5 3 4 4 1 1 - - South America 0 7 2 2 2 5 - - Middle East 0 2 1 1 1 2 - - APPARENT CONSUMPTION 59 70 62 64 60 67 179 190 STEEL PRODUCTION 14460 15552 14746 13810 12361 13761 40166 42131 ESTIMATED CONSUMPTION 62 67 63 59 53 59 173 181 BALANCE -3 3 -1 5 7 7 6 8 European ferrosilicon market structure European ferrosilicon market [Si content] Apr 15 May 15 Jun 15 Jul 15 Aug 15 Sep 15** Q4 15* Q1 16* Production 30 31 32 32 32 32 87 92 Export 3 3 3 4 2 2 7 7 Import 17 24 18 19 15 20 54 56 Apparent Consumption 44 53 46 48 45 50 134 141 Estimated Consumption 46 50 47 44 40 44 129 135 Balance -2 3 -1 3 5 6 5 6
  • 33. 33 Mn World Bulk Ferro-alloys Markets November, 2015 © Metal Expert 33 Si US, Turkish & Japanese FeSi market Back to top Source: Metal Expert * - forecast, ** - preliminary data Note: in ‘000 gross tonnes USA FeSi market structure Apr 15 May 15 Jun 15 Jul 15 Aug 15 Sep 15 Q4 15* Q1 16* PRODUCTION 7,5 7 6,2 3,5 3,5 3,5 21 21 EXPORT 1,1 0,9 0,9 0,7 0,6 0,6 2,4 2,2 IMPORT 32,5 24,1 8,8 6,8 30,7 20,0 46,5 38,0 by country Russia 16,0 16,2 0,0 0,0 16,2 0,5 19,0 17,0 China 9,3 4,6 5,3 3,9 7,4 8,4 16,0 9,0 Venezuela 2,9 0,0 0,0 0,0 3,3 4,8 0,0 0,0 Others 4,3 3,4 3,5 2,8 3,8 6,3 11,5 12,0 APPARENT CONSUMPTION 39 30 14 10 34 23 65 57 STAINLESS STEEL PRODUC- TION 6413 6844 6843 7032 6936 6557 19282 18619 ESTIMATED CONSUMPTION 20,9 22,3 22,3 22,9 22,6 21,3 62,7 60,6 BALANCE 18,1 8,0 -8,1 -13,4 11,1 1,6 2,4 -3,8
  • 34. 34 Mn World Bulk Ferro-alloys Markets November, 2015 © Metal Expert 34 Si Back to top Note: in ‘000 tonnes * - Metal Expert estimation Source: Metal Expert Note: in ‘000 gross tonnes Apr 15 May 15 Jun 15 Jul 15 Aug 15 Sep 15 EXPORT 0,1 0,1 0,1 0,2 0,1 0,1 IMPORT 4,7 6,3 7,8 10,1 8,1 4,2 by suppliers China 0,7 2,9 2,5 2,4 2,6 2,0 Russia 3,0 1,9 2,6 3,5 1,8 0,8 Egypt 0,0 0,0 0,0 0,0 0,0 0,0 Macedonia 0,0 0,0 1,0 1,0 0,0 0,0 Ukraine 0,0 0,1 0,4 1,4 0,0 0,0 Others 0,9 1,3 1,3 1,8 3,7 1,3 DOMESTIC MARKET 4,6 6,2 7,6 10,0 8,0 4,1 STEEL PRODUCTION 2775 2919 2844 2539 2563 2489 ESTIMATED CONSUMPTION 7,3 7,7 7,5 6,7 6,8 6,6 BALANCE -2,7 -1,5 0,1 3,3 1,2 -2,5 Apr 15 May 15 Jun 15 Jul 15 Aug 15 Sep 15 EXPORT 0,2 0,2 0,3 0,1 0,2 0,4 IMPORT 50,1 39,0 31,8 48,7 30,3 29,5 by country China 31,9 21,2 20,6 28,3 15,9 12,4 Russia 10,7 9,1 1,5 10,8 5,4 10,2 Brazil 2,3 4,2 5,9 5,2 4,8 3,7 Vietnam 1,0 0,4 0,5 0,6 0,0 0,1 Others 4,2 4,2 3,2 3,9 4,2 3,1 APPARENT CONSUMPTION 50 39 31 49 30 29 CARBON STEEL PRODUCTION 8 402 8 918 8 535 8 841 8 796 8 575 ESTIMATED CONSUMPTION 34 36 34 36 35 34 BALANCE 16 3 -3 13 -5 -5 Turkish FeSi market structure FeSi market structure in Japan
  • 35. 35 Mn World Bulk Ferro-alloys Markets November, 2015 © Metal Expert 35 Cr European FeCr market HC FeCr (60-65%) spot price forecast in Europe, DDP LC FeCr (65-70%) spot price forecast in Europe, DDP 0,95 0,94 0,94 0,87 0,88 0,83 0,81 0,81 0,83 0,60 0,70 0,80 0,90 1,00 1,10 Jun15 Jul15 Aug15 Sep15 Oct15 Nov15 Dec15 Jan16 Feb16 USD/lbCr 2,01 2,00 1,99 1,98 1,96 1,90 1,88 1,88 1,88 1,20 1,40 1,60 1,80 2,00 2,20 Jun15 Jul15 Aug15 Sep15 Oct15 Nov15 Dec15 Jan16 Feb16 USD/lbCr This month, European prices for HC FeCr (60-65% Cr; 6-8% C) have dropped by around 5% month-on-month to $0.83/lb Cr DDP and those for LC material (65-70% Cr; 0.1% C) – by 1.5% to $1.90/lb Cr DDP. Supply is still excessive in Europe. By the end of November, the accumulated surplus reached 7,500 t of FeCr in content, some 16% of the average monthly consumption. European FeCr market balance, in content -15,0 -10,0 -5,0 0,0 5,0 10,0 15,0 20,0 25,0 Q214 Q314 Q414 Q115 Q215 Q315 Q415* Q116* '000tonnes Source: Metal Expert*-forecast
  • 36. 36 Mn World Bulk Ferro-alloys Markets November, 2015 © Metal Expert 36 Cr Demand will stay low and will prevent the price increase in short-run. Steelmakers are forced to reduce capacity utilization amid intense competition with foreign suppliers and the consequent price decrease. Over January- November, a total of 6.7 million t of stainless steel was melted in Europe, down 3.3% year-on-year. In December, sellers will be trying to minimize their finished steel inventories, so the output is going to lose another 8-10% m-o-m reaching 450,000 t. The usual recover in Q1 will not exceed 10% (25% in 2015, 19% in 2014). Although South African merchants are having financial problems, the 5% rand devaluation in November will make them increase discounts. The surplus is unlikely to lessen in the global market, although charge chrome production will drop by 2.5% this year as South Africa’s IFM (200,000 tpy) and Tata Steel KZN (150,000 tpy) are still idle. Eskom, a local energy producer, insist on an increase in electricity tariffs during the next financial year by 16.6% against the approved 8%. Coupled with the falling chrome alloy prices, it will make produc- ers cut manufacture. Three out of the four European FeCr plants are still running at 100% capac- ity utilization. This year, Europe is going to put out 612,000 t of chrome alloys, up 8% year-on-year. Most producers do not plan any production cutbacks in Q1. Chrome ore prices are on the way down, too. Prices for South African material (40-42% Cr2O3) and (42-44% Cr2O3) have gone down by 13% to $127/t CIF China and $143/t CIF China respectively. Turkish prices have gone down by 11% to $177/t CIF China for lump ore (40-42% Cr2O3) and $193/t CIF China for the material (46-48% Cr2O3). Prices seems to be close to the bottom as the major- ity of local miners are forced to reduce manufacture due to substantial losses. The price trend in the chrome alloy market is not going to reverse soon because of high supply and low consumption. Yet, the decrease may slow down, given that prices are already too close to production cost. Back to top
  • 37. 37 Mn World Bulk Ferro-alloys Markets November, 2015 © Metal Expert 37 Cr Source: Metal Expert * - forecast, ** - preliminary data Note: in ‘000 gross tonnes Source: Metal Expert * - forecast, ** - preliminary data Note: in ‘000 gross tonnes Apr 15 May 15 Jun 15 Jul 15 Aug 15 Sep 15 Q4 15** Q1 16* PRODUCTION 36 48 52 49 49 50 155 164 by company Outokumpu 24 36 40 42 42 42 125 125 Vargon Alloys 8,3 8,3 8,3 5,0 5,0 6,0 21 30 Albanian Chrome 3,0 3,5 3,2 2,7 2,0 2,5 9 9 Other 0 0 0 0 0 0 0 0 EXPORT 1,3 4,9 9,7 21,7 13,6 14,5 20 24 IMPORT 77 85 76 75 49 68 185 211 by countries South Africa 44 57 58 58 34 49 138 148 Zimbabwe 13,8 5,0 0,4 2,5 0,8 6,0 7 8 Russia 1,2 0,5 0,7 0,7 0,2 0,5 2 8 Kazakhstan 4,3 6,9 2,8 1,9 2,1 0,5 5 7 Turkey 3,9 2,2 2,8 1,7 2,0 1,9 9 8 India 4,7 3,7 4,8 4,9 3,3 5,1 10 9 Other 4,3 9,5 6,9 4,9 7,0 5,1 16 24 APPARENT CONSUMPTION 111 127 118 102 84 104 319 385 STAINLESS STEEL PRODUCTION 630 665 666 553 420 600 1490 1750 Apr 15 May 15 Jun 15 Jul 15 Aug 15 Sep 15 Q4 15** Q1 16* PRODUCTION 2,5 2,5 2,7 2,7 2,7 2,7 8 8 by producers Elektrowerk Weisweiler GmbH 2,7 2,7 2,7 2,7 2,7 2,7 8 8 EXPORT 0,7 0,9 1,4 1,5 0,5 0,7 4 4 IMPORT 5,0 7,0 6,6 5,9 4,3 6,7 20 16 by countries Russia 2,0 2,4 1,9 1,9 1,4 3,1 8 9 Other 3,0 4,6 4,7 4,0 2,8 3,6 12 7 APPARENT CONSUMPTION 6,8 8,6 7,9 7,1 6,4 8,7 23,5 19,5 STAINLESS STEEL PRODUCTION 630 665 666 553 420 600 1560 1750 European HC FeCr & Charge Chrome market structure European LC and MC FeCr market structure Back to top
  • 38. 38 Mn World Bulk Ferro-alloys Markets November, 2015 © Metal Expert 38 Cr European & US FeCr market Source: Metal Expert * - forecast, ** - preliminary data Note: in ‘000 gross tonnes Source: Metal Expert * - forecast, ** - preliminary data Note: in ‘000 tonnes Apr 15 May 15 Jun 15 Jul 15 Aug 15 Sep 15 Q4 15* Q4 15* DLA sales 2,5 0,3 0,5 0,0 0,0 0,0 0,2 0,1 EXPORT 0,6 0,5 0,8 0,8 0,7 0,5 2,0 2,0 Canada 0,5 0,5 0,8 0,8 0,6 0,5 - - IMPORT 65 41 16 25 46 38 105 109 by country South Africa 42,6 30,7 8,4 1,5 16,8 16,0 - - Finland 0,0 0,0 0,0 7,5 7,1 16,1 - - Kazakhstan 0,0 0,0 0,0 11,0 0,0 0,0 - - Zimbabwe 1,8 1,0 1,7 4,2 3,1 3,9 - - APPARENT CONSUMPTION 66,6 40,8 15,4 24,4 44,8 37,9 103,6 107,6 USA HC FeCr & Charge Chrome market structure European FeCr market structure [in Cr content] Back to top Apr 15 May 15 Jun 15 Jul 15 Aug 15 Sep 15 Q4 15* Q1 16* Production 22 29 31 30 29 30 92 96 Export 1,2 3,4 6,4 13,2 8,1 8,6 14 16 Import 46 51 45 44 29 41 112 124 Apparent Consumption 67 76 70 60 50 63 191 207 Estimated Consumption 70 74 74 61 47 67 173 194 Balance -3 3 -4 -1 4 -4 18 13
  • 39. 39 Mn World Bulk Ferro-alloys Markets November, 2015 © Metal Expert 39 Cr USA FeCr market structure [in Cr content] Source: Metal Expert, 100% Mn weight basis * - forecast, ** - preliminary data Note: in ‘000 tonnes Apr 15 May 15 Jun 15 Jul 15 Aug 15 Sep 15 Q4 15* Q4 15* DLA sales 1,8 2,6 0,4 0,1 0,1 0,0 1,0 0,7 Export 0,5 0,5 0,7 0,6 1,0 0,5 2,0 2,0 Import 44,0 26,2 10,3 17,5 31,2 23,4 71,3 72,8 Apparent Consumption 45 28 10 17 30 23 70 71 Estimated Consumption 27 27 27 27 27 27 74 80 Source: Metal Expert * - forecast, ** - preliminary data Note: in ‘000 gross tonnes Apr 15 May 15 Jun 15 Jul 15 Aug 15 Sep 15 Q4 15* Q4 15* DLA sales 0,3 3,6 0,1 0,1 0,2 0,0 1,2 0,9 EXPORT 0,2 0,3 0,3 0,1 0,8 0,2 1,0 1,1 Canada 0,2 0,3 0,3 0,1 0,1 0,2 0,0 0,0 IMPORT 12,4 6,1 2,1 4,4 6,1 1,3 13,5 12,3 by country Russia 9,6 5,0 0,3 1,3 3,5 0,1 - - Germany 0,5 0,5 0,9 0,6 0,3 0,4 - - China 0,9 0,3 0,2 0,9 0,8 0,4 - - Kazakhstan 0,6 0,0 0,0 1,2 0,0 0,0 - - APPARENT CONSUMPTION 12 9 2 4 6 1 14 12 USA LC and MC FeCr market structure Back to top
  • 40. 40 Mn World Bulk Ferro-alloys Markets November, 2015 © Metal Expert 40 Cr Source: Metal Expert Note: in ‘000 gross tonnes Japanese FeCr market Japanese HC FeCr & Charge Chrome market structure Back to top Apr 15 May 15 Jun 15 Jul 15 Aug 15 Sep 15 EXPORT 0,01 0,00 0,01 0,00 0,01 0,01 IMPORT 51 62 62 38 64 51 by countries Kazakhstan 33,3 21,8 34,9 22,0 20,3 16,5 South Africa 12,3 33,1 19,8 9,8 40,2 25,9 India 3,8 3,1 5,5 5,0 2,3 4,3 Finland 1,0 1,4 1,2 1,1 1,1 1,2 TURKEY 0,0 2,6 0,0 0,0 0,1 0,0 Others 0,7 0,1 0,4 0,4 0,3 3,5 APPARENT CONSUMPTION 51 62 62 38 64 51 SPECIAL STEEL PRODUCTION 1 549 1 593 1 536 1 562 1 496 1 597 by types Stainless steel 205 220 225 231 232 246 Other specialty steel 1 345 1 372 1 311 1 331 1 265 1 352 ESTIMATED CONSUMPTION 50 53 53 54 54 57 BALANCE 2 9 9 -16 11 -6
  • 41. 41 Mn World Bulk Ferro-alloys Markets November, 2015 © Metal Expert 41 Cr Source: Metal Expert Note: in ‘000 gross tonnes Japanese FeCr market structure [in Cr content] Source: Metal Expert Note: in ‘000 gross tonnes Apr 15 May 15 Jun 15 Jul 15 Aug 15 Sep 15 Production 1,3 1,3 1,3 1,3 1,3 1,3 Export 0,2 0,2 0,2 0,2 0,1 0,1 Import 34,3 39,6 41,0 26,1 38,8 32,8 Apparent Consumption 35 41 42 27 40 34 Estimated Consumption 33 35 35 36 35 37 Balance 3 6 7 -8 5 -3 Japanese LC FeCr market structure Back to top Apr 15 May 15 Jun 15 Jul 15 Aug 15 Sep 15 PRODUCTION 2,0 2,0 2,0 2,0 2,0 2,0 EXPORT 0,3 0,3 0,3 0,3 0,2 0,2 IMPORT 3,7 6,2 5,1 3,9 3,8 4,7 by countries Russia 1,2 1,2 1,2 1,6 0,9 2,2 South Africa 0,8 2,0 2,5 1,1 1,4 0,3 China 0,9 1,2 0,4 0,2 0,8 0,6 Kazakhstan 0,7 1,4 1,1 0,6 0,5 1,3 Others 0,1 0,4 0,0 0,3 0,2 0,2 APPARENT CONSUMPTION 5 8 7 6 6 7 SPECIAL STEEL PRODUCTION 1 549 1 593 1 536 1 562 1 496 1 597 by types Stainless steel 205 220 225 231 232 246 Other specialty steel 1 345 1 372 1 311 1 331 1 265 1 352 ESTIMATED CONSUMPTION 5 5 5 5 5 6 BALANCE 0 3 2 0 0 1
  • 42. This publication is for information purposes only. The information contained in this document has been compiled from sources believed to be reliable. Metal Expert cannot be made liable for any loss no matter how it may arise. © Metal Expert 2004-2015. All rights reserved. No part of this publication (text, data or graphic) may be reproduced, stored in corporate data retrieval systems or transmitted in any form without obtaining Metal Expert’s prior written consent. Metal Expert News Analytics Forecasts Consulting Advertising Conferences www.metalexpert-group.com tel +38 056 239 88 50, 370 12 06, 370 12 07 e-mail subscriptions@metalexpert-group.com World Bulk Ferro-alloys Markets on-line access to publications, statistics and archives pdf-version and excel-version of statistics consultations of leading experts Subscription / Trials: Chief Editor: Alexandr Andreev e-mail a.andreev@metalexpert-group.com Metal Expert Ukraine: 48-b Naberezhnaya Pobedy, Dnepropetrovsk 49094, Ukraine tel +38 056 239 88 50 +38 056 370 12 06, 370 12 07 e-mail subscriptions@metalexpert-group.com Metal Expert Russia: Metal Expert LLC office 403, 73 Volokolamskoye shosse Moscow, 125424 tel / fax +7 499 346 09 35, +7 495 775 60 55 e-mail subscriptions@metalexpert-group.com Metal Expert LLC: 2470 Hodges Bend Cir., Sugar Land, TX 77479, USA tel +1 832 545 50 23 e-mail s.sadikhov@metalexpert-group.com k.hashimova@metalexpert-group.com Metal Expert Group AG: Todistrasse 38, Zurich, Switzerland, 8002 tel +41 44 735 6015, +41 43 523 0098 e-mail office@unikomag.com Offices