1. 10th March 2014 WWW.LCC.ASIA
IMPORTANT DISCLAIMER
This report has been prepared by Lincoln Crowne & Company Pty. Limited ("LCC"). The research is based on information obtained from
sources believed to be accurate and reliable. LCC does not guarantee the accuracy, reliability, completeness or suitability of any such
information and makes no warranty, guarantee or representation, expressly or impliedly about this research. LCC accepts no obligation
to correct or update the information. No opinion or recommendation is made within this research. This report is not intended to be, nor
should it be relied on, as a substitute for professional advice. This report should not be relied upon as the sole basis for any investment
decision or planning, and LCC does not accept any responsibility on this basis for actions made
. Page 1 / 4
WEEKLYAustralianCopperGoldReport
LUNAR NEW YEAR COPPER HANGOVER
Global Economic Fundamentals
Source: Capital IQ, COMEX, LCC, LME, SHFE, Thomson Reuters, WGC
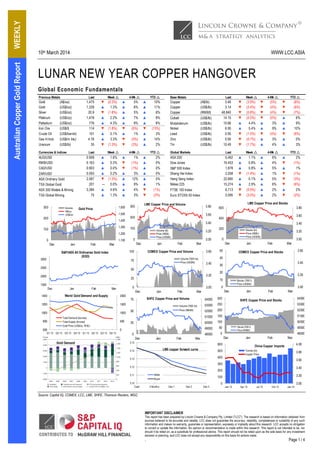
Precious Metals Last Week r 4-Wk r YTD r Base Metals Last Week r 4-Wk r YTD r
Gold (A$/oz) 1,475 ▼ (0.3%) ▲ 5% ▲ 10% Copper (A$/lb) 3.46 ▼ (3.9%) ▼ (5%) ▼ (8%)
Gold (US$/oz) 1,339 ▲ 1.3% ▲ 6% ▲ 11% Copper (US$/lb) 3.14 ▼ (2.4%) ▼ (4%) ▼ (6%)
Silver (US$/oz) 20.9 ▼ (1.8%) ▲ 5% ▲ 8% Copper (RMB/t) 48,840 ▼ (0.8%) ▼ (4%) ▼ (7%)
Platinum (US$/oz) 1,478 ▲ 2.2% ▲ 7% ▲ 8% Cobalt (US$/lb) 14.15 ▼ (0.0%) ▼ (0%) ▲ 6%
Palladium (US$/oz) 776 ▲ 4.3% ▲ 9% ▲ 8% Molybdenum (US$/lb) 10.66 ▲ 4.4% ▲ 3% ▲ 9%
Iron Ore (US$/t) 114 ▼ (1.8%) ▼ (6%) ▼ (15%) Nickel (US$/lb) 6.95 ▲ 5.4% ▲ 9% ▲ 10%
Crude Oil (US$/barrel) 101 ▲ 0.1% ▲ 1% ▲ 3% Lead (US$/lb) 0.95 ▼ (1.5%) ▼ (4%) ▼ (6%)
Gas H.Hub (US$/m btu) 4.76 ▲ 3.3% ▼ (0%) ▲ 14% Zinc (US$/lb) 0.95 ▼ (0.7%) ▲ 3% ▲ 0%
Uranium (US$/lb) 35 ▼ (1.3%) ▼ (3%) ▲ 2% Tin (US$/lb) 10.49 ▼ (1.7%) ▲ 4% ▲ 3%
Currencies & Indices Last Week r 4-Wk r YTD r Global Markets Last Week r 4-Wk r YTD r
AUD/USD 0.908 ▲ 1.6% ▲ 1% ▲ 2% ASX 200 5,462 ▲ 1.1% ▲ 6% ▲ 2%
RMB/USD 0.163 ▲ 0.3% ▼ (1%) ▲ 0% Dow Jones 16,453 ▲ 0.8% ▲ 4% ▼ (1%)
CAD/USD 0.903 ▲ 0.0% ▼ (1%) ▲ 0% S&P 500 Index 1,878 ▲ 0.8% ▲ 5% ▲ 1%
ZAR/USD 0.093 ▲ 0.2% ▲ 3% ▲ 0% Shang Hai Index 2,058 ▼ (1.4%) ▲ 1% ▼ (1%)
ASX Ordinary Gold 2,587 ▼ (1.3%) ▲ 12% ▲ 5% Hang Seng Index 22,660 ▲ 0.1% ▲ 5% ▼ (3%)
TSX Global Gold 201 — 0.0% ▲ 9% ▲ 1% Nikkei 225 15,274 ▲ 2.9% ▲ 6% ▼ (6%)
ASX 300 Metals & Mining 3,384 ▲ 4.6% ▲ 4% ▼ (1%) FTSE 100 Index 6,713 ▼ (0.9%) ▲ 2% ▲ 2%
TSX Global Mining 75 ▲ 1.3% ▲ 3% ▼ (2%) Euro STOXX 50 Index 3,095 ▼ (3.5%) ▲ 2% ▼ (2%)
1,100
1,200
1,300
1,400
1,500
1,600
0
100
200
300
Dec Jan Feb Mar
Thousands
Gold PriceVolume
A$/oz
US$/oz
3.00
3.20
3.40
3.60
3.80
0
100
200
300
Dec Jan Feb Mar
Thousands
LME Copper Price and Volume
Volume (kt)
Price (A$/lb)
Price (US$/lb)
3.00
3.20
3.40
3.60
0
10
20
30
40
50
Dec Jan Feb Mar
COMEX Copper Price and Stocks
Stocks ('000 t)
Price (US$/lb)
48000
49000
50000
51000
52000
53000
54000
0
50
100
150
200
250
300
Dec Jan Feb Mar
Thousands
SHFE Copper Price and Stocks
Stocks ('000 t)
Price (RMB/t)
48000
49000
50000
51000
52000
53000
54000
0
25
50
75
Dec Jan Feb Mar
Thousands
SHFE Copper Price and Volume
Volume ('000 lot)
Price (RMB/t)
3.00
3.20
3.40
3.60
0
25
50
75
100
Dec Jan Feb Mar
COMEX Copper Price and Volume
Volume ('000 lot)
Price (US$/lb)
1500
2000
2500
3000
Dec Jan Feb Mar
S&P/ASX All Ordinaries Gold Index
(XGD)
3.00
3.20
3.40
3.60
3.80
4.00
0
100
200
300
400
500
600
Jan 13 Apr 13 Jul 13 Oct 13 Jan 14
China Copper Imports
Tonnes (kt)
Copper Price
3.00
3.20
3.40
3.60
3.80
0
200
400
600
Dec Jan Feb Mar
LME Copper Price and Stocks
Stocks (kt)
Price (A$/lb)
Price (US$/lb)
0
500
1000
1500
2000
600
800
1000
1200
1400
Q1 12 Q2 12 Q3 12 Q4 12 Q1 13 Q2 13 Q3 13 Q4 13
World Gold Demand and Supply
Total Demand (tonnes)
Total Supply (tonnes)
Gold Price (US$/oz, RHS)
3.10
3.11
3.12
3.13
3.14
3.15
Cash 3 Months Dec 1 Dec 2 Dec 3
LME copper forward curve
Seller
Buyer
Gold Demand
2. 10th March 2014 WWW.LCC.ASIA
IMPORTANT DISCLAIMER
This report has been prepared by Lincoln Crowne & Company Pty. Limited ("LCC"). The research is based on information obtained from
sources believed to be accurate and reliable. LCC does not guarantee the accuracy, reliability, completeness or suitability of any such
information and makes no warranty, guarantee or representation, expressly or impliedly about this research. LCC accepts no obligation
to correct or update the information. No opinion or recommendation is made within this research. This report is not intended to be, nor
should it be relied on, as a substitute for professional advice. This report should not be relied upon as the sole basis for any investment
decision or planning, and LCC does not accept any responsibility on this basis for actions made
. Page 2 / 4
WEEKLYAustralianCopperGoldReport
Markets & Majors
Western Australia has jumped nine places to finish in sixth
position in the Fraser Institute’s survey of mining companies 2013.
Australia’s largest state finished 15th previously but jumped back
into the top 10 and was the top ranked jurisdiction globally for
investment attractiveness. WA also ranked second in terms of
geological attractiveness behind Alaska but in front of Nevada,
Chile and British Columbia. South Australia also improved its
previous 20th rank, jumping up into the 11th spot, while Tasmania
was the most improved, jumping from 49th to 27th. The Northern
Territory went from 22nd to 13th, while Queensland was 24th, up
eight spots. Victoria dropped to 33rd from 24th, while New South
Wales was the worst ranked Australian jurisdiction in 39th place.
Thomson Reuters - After record imports of 536,000 t in January,
arrivals of copper are likely to drop in February, as importers
scheduled fewer term shipments due to the Chinese New Year
holidays. Importers had cut purchases of spot copper because of
weak domestic prices. The absence of a demand pick up after the
Lunar New Year holiday, along with expectations of even lower
prices have led buyers to stave off fresh orders. Stocks in bonded
warehouses in Shanghai are estimated at between 560,000 and
660,000 tonnes. The Shanghai Future Exchange inventories
closed at 207,320 tonnes last Friday.
Thomson Reuters - Democratic Republic of Congo's prime
minister has told mining companies to halt any expansion plans
requiring extra power in the copper-rich Katanga province due to
an "energy crisis". The national power company SNEL should not
grant any new energy contracts for mining companies nor allow
changes to existing contracts. International mining companies
such as Glencore and Freeport McMoRan have major operations
in the Katanga province, drawn to the region by huge copper
deposits. LCC notes that Tiger Resources (ASX: TGS) has
secured its energy supply for the SX-EW plant currently close to
completion and scheduled to start production in Q2 2014.
Thomson Reuters – Indonesia's mines ministry could recommend
that Freeport-McMoRan Copper & Gold receive a reprieve from a
controversial tax that has halted copper exports for more than two
months, a government official told Reuters. To win the tax
reprieve, Freeport must pay the government a 5% security bond
for the construction of a smelter and finalise supply agreements
with smelter-building companies, said Sukhyar, director general of
coal and minerals for the mines ministry. Freeport, which warned
last week it may need to declare force majeure on copper
concentrate sales if the dispute drags on, has submitted a request
to the mines ministry for a permit to resume concentrate exports.
GlencoreXstrata booked a 2013 net loss of US$7.40 billion,
compared with a US$1 billion profit the previous year. Revenue
rose 9% year on year to US$233 billion. Copper was the group's
best performing commodity, with higher volumes and lower costs
off-setting an 8% price fall. Copper production rose 26% year on
year to 1.5 million tonnes including African copper, up 43%, with
Mutanda and Katanga in the DRC each reaching 200,000 tpa
capacity at year-end and 58% production growth at Collahuasi.
Western Australian Mines and Petroleum Minister said there will
be no gold royalty rise in the 2014-15 state budget. Behind iron
ore, gold was WA’s most valuable commodity with total sales of
A$8.7 billion, representing 10% of total mineral sales in 2013.
Thomson Reuters - Barrick Gold Corporation, the world's biggest
gold miner, is not looking to hedge the price of the precious metal
because it expects a sharp increase in coming years, Chief
Executive Jamie Sokalsky said at the Prospectors & Developers
Association of Canada (PDAC) convention. Sokalsky said he was
not interested in hedging because investors want to capture gold's
upside.
Copper Explorers & Emerging Producers
Source: ASX, Capital IQ, LCC. A$/US$ exchange rate of 0.90
Copper Producers
Source: ASX, Capital IQ, LCC. Assumption: A$/US$ of 0.90
ASX-Listed Company News
Venturex Resources (ASX: VXR) has entered into an agreement
with private company Blackrock Metals Pty Ltd for the
reprocessing of the existing Whim Creek oxide copper heap leach
pads. Venturex will hold a 15% net profit interest in the
Code Company Name
Close
Price
Week r YTD r
Market
Cap (A$m)
52 Week
Range
Cash
(A$m)
EV
(A$m)
AVI Avalon Minerals 0.008 ▼ (11% ) (20% ) 10 2.7 7
AZS Azure Minerals 0.035 ▼ (5% ) 17% 25 2.3 23
BMB Balamara Resources 0.13 — 0% 37% 39 1.2 37
BTR Blackthorn Resources 0.16 ▼ (6% ) (38% ) 26 16.3 10
BOC Bougainville Copper 0.51 ▲ 1% 7% 205 6.2 198
ERM Emmerson Resources 0.036 — 0% (14% ) 9 1.2 8
ENR Encounter Resources 0.23 ▲ 5% 18% 30 3.9 26
ESR Estrella Resources 0.12 ▼ (8% ) (31% ) 12 2.0 10
GCR Golden Cross Resources 0.006 ▲ 20% 20% 11 1.1 10
HAV Havilah Resources 0.23 ▼ (4% ) (8% ) 28 3.5 24
HCH Hot Chili 0.45 ▲ 2% 6% 156 8.2 148
HIG Highlands Pacific 0.073 ▲ 1% 20% 62 9.6 53
IRN Indophil Resources 0.19 ▲ 16% 12% 223 215.1 7
KGL KGL Resources 0.110 — 0% 5% 15 7.8 8
KDR Kidman Resources 0.145 ▼ (6% ) (22% ) 19 3.7 15
MMC Marengo Mining 0.016 ▲ 33% 7% 18 4.5 42
MNC Metminco 0.034 ▲ 6% 10% 59 7.8 52
PEX Peel Mining 0.28 ▲ 10% 6% 36 3.8 32
RDM Red Metal 0.18 ▼ (20% ) 17% 25 1.1 24
RXM Rex Minerals 0.42 ▼ (9% ) (13% ) 79 20.9 58
SBR Sabre Resources 0.040 ▼ (17% ) (7% ) 9 4.1 5
SUH Southern Hemisphere 0.045 — 0% (10% ) 9 0.5 8
TLM Talisman Mining 0.12 ▼ (4% ) 10% 15 17.3 (2)
VXR Venturex Resources 0.008 ▲ 14% (20% ) 12 3.4 9
YTC YTC Resources 0.25 ▲ 4% 9% 82 25.8 121
AVB Avanco Resources 0.069 ▼ (4% ) (3% ) 93 16.6 77
CDU Cudeco 1.77 ▼ (3% ) (2% ) 414 47.4 367
FND Finders Resources 0.18 ▼ (3% ) (14% ) 99 12.9 86
Code Company Name
Close
Price
Week r YTD r
Market
Cap (A$m)
52 Week
Range
Cash
(A$m)
EV (A$m)
EV/
EBITDA
ABY Aditya Birla Minerals 0.33 ▼ (4% ) (4% ) 102 118 (16) 0.0x
AOH Altona Mining 0.17 ▼ (8% ) 0% 88 20 79 5.9x
DML Discovery Metals 0.036 — 0% (32% ) 20 13 178 NM
HGO Hillgrove Resources 0.090 — 0% 0% 106 17 134 3.9x
OZL OZ Minerals 3.92 ▲ 5% 24% 1,189 364 825 4.7x
PNA PanAust 1.82 ▲ 3% 1% 1,111 145 1,146 4.6x
SFR Sandfire Resources 6.23 ▲ 4% (4% ) 970 75 1,125 8.9x
SRQ Straits Resources 0.005 ▼ (17% ) (38% ) 6 12 116 2.9x
TGS Tiger Resources 0.43 ▲ 12% 25% 345 42 359 5.7x
3. 10th March 2014 WWW.LCC.ASIA
IMPORTANT DISCLAIMER
This report has been prepared by Lincoln Crowne & Company Pty. Limited ("LCC"). The research is based on information obtained from
sources believed to be accurate and reliable. LCC does not guarantee the accuracy, reliability, completeness or suitability of any such
information and makes no warranty, guarantee or representation, expressly or impliedly about this research. LCC accepts no obligation
to correct or update the information. No opinion or recommendation is made within this research. This report is not intended to be, nor
should it be relied on, as a substitute for professional advice. This report should not be relied upon as the sole basis for any investment
decision or planning, and LCC does not accept any responsibility on this basis for actions made
. Page 3 / 4
WEEKLYAustralianCopperGoldReport
reprocessing operation which will contribute to the on-going
environmental and administration costs of the overall Whim Creek
mine site.
Mergers & Acquisitions
GlencoreXstrata said it had selected China's Minmetals as
preferred bidder for the sale of its Las Bambas copper mine in
Peru, which sources have said could fetch about US$5 billion. The
company also said it would allocate part the proceeds of the sale
to repay its debt, which stood at US$35.8 billion in 2013, against
US$29.5 billion in 2012. Glencore agreed to sell Las Bambas to
secure approval from China's competition authorities for its
takeover of Xstrata.
GlencoreXstrata has confirmed that BHP Billiton’s Nickel West
assets are for sale and the company is among the interested
parties. Glencore already owns the Murrin Murrin nickel operation
in Western Australia through its takeover of Minara Resources in
2011. BHP has refused to comment on a possible sale of the
Nickel West assets in the past, but nickel is outside the company’s
“four pillars” of iron ore, copper, coal and petroleum.
Emerging Gold Producers
Source: ASX, Capital IQ, LCC. Assumption: A$/US$ of 0.90
Bloomberg - Several groups have expressed interest in acquiring
Randgold Resources Massawa gold project in Senegal, and the
company would consider a sale. According to the CEO, the
project does not currently meet the company's development
requirements of having 3 million ounces of gold reserves at an
assumed gold price of US$1,000/oz and an IRR of 20%.
Genesis Minerals (ASX: GMD) agreed to purchase 100% of
AngloGold Ashanti’s 970km2 Viking gold project near Norseman
giving the Company access to a series of high grade, drill ready
gold targets and a high-quality A$5m database. The total
purchase price for the project is a $50,000 payment due on
March 10, 2014; a Deferred Payment of A$2 per measured or
indicated (JORC 2012) resource ounce defined on or partially on
the Tenement Area as quoted in the first public announcement of
a measured or indicated resource on or partially on the Tenement
Area; and a royalty payable to AngloGold Ashanti equal to 1.25
percent of the Net Smelter Return generated from the sale of any
gold mined or produced from the Tenement Area, after
commercial production of 25,000 ounces.
SNL - Private equity is stepping up efforts to increase its
involvement in capital raising activities in the mining sector, four
private equity players told the PDAC conference. Private equity
firms remain relatively untested in the sector, but have been eager
to increase their holding in mining and metals companies following
pressure from investors, who felt they were missing out on
commodities returns.
Gold Producers
Source: ASX, Capital IQ, LCC. Assumption: A$/US$ of 0.90
Code Company Name
Close
Price
Week r YTD r
Market Cap
(A$m)
52 Week
Range
Cash
(A$m)
EV
(A$m)
ABU ABM Resources 0.027 ▼ (7%) 23% 89 5.1 84
ALK Alkane Resources 0.36 ▼ (11%) 4% 132 43.3 89
AZM Azumah Resources 0.059 ▲ 28% 111% 21 3.3 18
BSR Bassari Resources 0.010 — 0% 25% 9 0.2 8
BAB Bullabulling Gold 0.057 ▼ (11%) 27% 20 4.3 15
CHZ Chesser Resources 0.12 ▼ (4%) 14% 26 4.6 22
CDG Cleveland Mining 0.11 — 0% 5% 25 0.6 25
CVG ConvergentMinerals 0.013 — 0% (19%) 5 0.7 4
CAS Crusader Resources 0.29 ▼ (5%) (3%) 37 2.2 40
DCN Dacian Gold 0.43 ▲ 23% 79% 41 13.2 28
EXG Excelsior Gold 0.092 ▲ 8.2% 33% 38 4.3 32.2
FMl Focus Minerals 0.02 ▲ 14% 33% 146 81.2 72
GCY Gascoyne Resources 0.17 ▼ (6%) 18% 26 1.2 25
GRY Gryphon Minerals 0.18 ▲ 3% 6% 72 41.7 30
IDC Indochine Mining 0.067 ▲ 2% 56% 70 0.5 70
IAU Intrepid Mines 0.26 — 0% (17%) 145 98.2 46
KGD Kula Gold 0.09 ▼ (6%) (10%) 12 3.2 9
MSR Manas Resources 0.043 ▲ 5% 34% 18 5.6 12
MYG Mutiny Gold 0.031 ▼ (3%) (3%) 19 1.7 24
OBS Orbis Gold 0.33 ▼ (6%) 32% 82 5.5 77
ORD Ord Resources 0.01 ▼ (14%) 20% 6 1.5 4
PAN Panoramic Resources 0.41 ▲ 11% 64% 132 34.0 98
PIR Papillon Resources 1.44 ▲ 1% 47% 491 43.6 447
PXG Phoenix Gold 0.16 — 0% (3%) 37 4.6 33
RED Red 5 0.10 ▼ (9%) 14% 76 36.7 39
RNI Resource & Investment 0.105 ▼ (9%) 98% 32 3.0 44
ROL RobustResources 0.28 ▼ (7%) (20%) 29 2.5 32
SIH Sihayo Gold 0.030 — 0% 0% 28 0.5 28
SXG Southern Cross Goldfields 0.016 — 0% 23% 14 5.1 16
SUM Sumatra Copper & Gold 0.08 ▼ (14%) 14% 33 4.0 32
WAF WestAfrican Resources 0.20 ▲ 30% 39% 48 4.0 47
YTC YTC Resources 0.25 ▲ 4% 9% 82 25.8 121
Code Company Name
Close
Price
Week r YTD r
Market
Cap (A$m)
52 Week
Range
Cash
(A$m)
EV (A$m)
AQG Alacer Gold 3.17 ▲ 6% 40% 903 322 580
AGD Austral Gold 0.09 ▼ (32% ) (29% ) 15 9 67
BDR Beadell Resources 0.77 ▲ 1% (3% ) 609 24 654
BEZ Besra Gold 0.027 ▼ (10% ) (40% ) 13 1 38
CRK Crocodile Gold Corp 0.26 ▼ (5% ) 117% 124 28 102
DRM Doray Minerals 1.03 ▲ 4% 83% 167 24 193
DRA Dragon Mining 0.19 — 0% 46% 17 6 11
EVN Evolution Mining 0.98 ▲ 4% 59% 691 37 796
EVR Endeavour Mining Corp 0.88 ▲ 10% 81% 385 119 565
IGO Independence Group 4.33 ▲ 5% 39% 1,010 46 1,028
KCN Kingsgate Consolidated 1.28 ▲ 5% 37% 209 37 348
KRM Kingsrose Mining 0.36 ▲ 3% 6% 127 1 126
LSA Lachlan Star 0.28 ▲ 12% 40% 41 3 43
MML Medusa Mining 2.35 ▲ 8% 15% 488 23 465
MLX Metals X 0.23 ▲ 2% 35% 381 50 331
MOY Millennium Minerals 0.13 ▼ (19% ) (32% ) 28 5 62
MLI Mintails 0.054 ▼ (2% ) (4% ) 15 4 10
NCM Newcrest Mining 12.00 ▲ 6% 54% 9,192 121 13,709
NGF Norton Gold Fields 0.14 ▲ 4% 0% 126 41 200
NST Northern Star Resources 1.25 ▲ 8% 59% 655 49 606
OGC OceanaGold Corporation 2.74 ▲ 1% 72% 820 28 986
PNA PanAust 1.82 ▲ 3% 1% 1,111 145 1,146
PGI PanTerra Gold 0.044 ▼ (12% ) 7% 34 5 79
PRU Perseus Mining 0.44 ▲ 1% 78% 229 28 201
RMS Ramelius Resources 0.14 ▼ (3% ) 44% 51 33 22
RRL Regis Resources 2.33 ▲ 2% (20% ) 1,164 13 1,161
RSG Resolute Mining 0.67 ▲ 11% 21% 430 50 474
SAR Saracen Mineral Holdings 0.35 ▲ 15% 89% 263 23 262
SBM St Barbara 0.35 — 0% 35% 171 70 431
SLR Silver Lake Resources 0.52 ▼ (10% ) (3% ) 262 17 253
TBR Tribune Resources 3.05 ▲ 13% 31% 153 9 164
TGZ Teranga Gold Corp 1.09 ▼ (4% ) 98% 361 39 389
TRY Troy Resources 1.28 ▲ 11% 63% 244 18 257
UML Unity Mining 0.033 ▲ 6% (20% ) 23 10 13
VGO Vantage Goldfields 0.029 — 0% 12% 7 1 6
ANG AngloGold Ashanti 196.91 ▲ 3% 60% 8,137 725 11,623
ABX Barrick Gold Corp 22.08 ▼ (2% ) 18% 25,559 2,688 39,439
GFI Goldfields 40.45 ▼ (1% ) 23% 3,197 358 5,246
NEM Newmont Mining Corp 24.60 ▲ 6% 7% 13,489 1,739 22,332
4. 10th March 2014 WWW.LCC.ASIA
IMPORTANT DISCLAIMER
This report has been prepared by Lincoln Crowne & Company Pty. Limited ("LCC"). The research is based on information obtained from
sources believed to be accurate and reliable. LCC does not guarantee the accuracy, reliability, completeness or suitability of any such
information and makes no warranty, guarantee or representation, expressly or impliedly about this research. LCC accepts no obligation
to correct or update the information. No opinion or recommendation is made within this research. This report is not intended to be, nor
should it be relied on, as a substitute for professional advice. This report should not be relied upon as the sole basis for any investment
decision or planning, and LCC does not accept any responsibility on this basis for actions made
. Page 4 / 4
WEEKLYAustralianCopperGoldReport
Australian Gold Producers Cost Curve
as at 31 December 2013