1. Oz Metals
16th
Edition – 1st
Feb 2015
DISCLAIMER
This report is provided in good faith from sources believed to be accurate and reliable. Terra Studio Pty Ltd directors and employees do not accept liability
for the results of any action taken on the basis of the information provided or for any errors or omissions contained therein. Readers should seek investment
advice from their professional advisors before acting upon information contained herein.
Page 1 / 4
TerraStudio
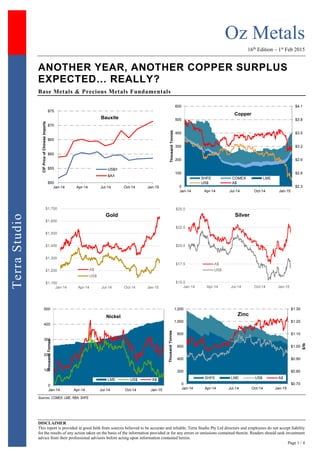
ANOTHER YEAR, ANOTHER COPPER SURPLUS
EXPECTED… REALLY?
Base Metals & Precious Metals Fundamentals
Sources: COMEX, LME, RBA, SHFE
$50
$55
$60
$65
$70
$75
Jan-14 Apr-14 Jul-14 Oct-14 Jan-15
CIFPriceofChineseImports
Bauxite
US$/t
$A/t
$2.3
$2.6
$2.9
$3.2
$3.5
$3.8
$4.1
0
100
200
300
400
500
600
Jan-14 Apr-14 Jul-14 Oct-14 Jan-15
ThousandTonnes
Copper
SHFE COMEX LME
US$ A$
$1,100
$1,200
$1,300
$1,400
$1,500
$1,600
$1,700
Jan-14 Apr-14 Jul-14 Oct-14 Jan-15
Gold
A$
US$
$15.0
$17.5
$20.0
$22.5
$25.0
Jan-14 Apr-14 Jul-14 Oct-14 Jan-15
Silver
A$
US$
$6
$9
0
100
200
300
400
500
Jan-14 Apr-14 Jul-14 Oct-14 Jan-15
$/lb
ThousandTonnes
Nickel
LME US$ A$
$0.70
$0.80
$0.90
$1.00
$1.10
$1.20
$1.30
0
200
400
600
800
1,000
1,200
Jan-14 Apr-14 Jul-14 Oct-14 Jan-15
$/lb
ThousandTonnes
Zinc
SHFE LME US$ A$
2. Oz Metals
16th
Edition – 1st
Feb 2015
DISCLAIMER
This report is provided in good faith from sources believed to be accurate and reliable. Terra Studio Pty Ltd directors and employees do not accept liability
for the results of any action taken on the basis of the information provided or for any errors or omissions contained therein. Readers should seek investment
advice from their professional advisors before acting upon information contained herein.
Page 2 / 4
TerraStudio
Markets & Majors
Thomson Reuters - The global copper market oversupply is
expected to shrink this year and next, helping cushion prices
of an industrial metal that has suffered due to slowing growth
in top consumer China, a Reuters poll showed. In a prediction
that could signal a reversal of chronic oversupply, the poll
also showed the aluminium market could post its first deficit
in nine years. Supplies are projected to remain scarce overall
within the base metals complex, with all the metals -- except
copper -- expected to register a deficit over the next two years.
Analysts began the year on a bearish footing, with forecasts
for all six base metals slashed from estimates in October.
Some 34 market participants surveyed over the last three
weeks expect cash copper prices to average $6,371.70 a
tonne this year, down 5% from 2015 forecasts in a previous
poll. In 2016, prices are seen rising to $6,813. The poll
showed analysts expect the copper market to have a surplus
of 221,000 tonnes this year, compared with a surplus of
350,000 tonnes forecast previously in October. In 2016, the
surplus is seen narrowing to 200,000 tonnes.
Thomson Reuters - London-based broker Traderight Ltd has
downgraded its membership of the LME, the latest to scale
back in the base metals business as slowing growth and
higher costs of regulation eat into profits. The LME, the oldest
and biggest market for base metals such as copper and
aluminium, said that Traderight has moved to category 4
membership. Traderight was previously a category 2, or
associate broker member, which allows membership to the
LME's new clearing house. Category 4 members do not have
the ability to clear trades. Traderight is backed by some of the
biggest hitters in the metals industry, including China's largest
metals trading house Maike and London-based hedge fund
RK Capital.
Reuters - Newly elected President Edgar Lungu said
Zambia's new mineral royalty tax, which hiked royalty rates
on open-pit mining operations and underground mines in the
country to 20% and 8%, respectively, from 6%, will stay.
Business News Americas - Chilean President Michelle
Bachelet said that the Latin American country will
contemplate establishment of public-private partnerships in a
bid to develop future lithium initiatives.
Mining.com - In New York trade on Friday copper futures
advanced nearly 2% on the back of a huge rally in oil and a
comeback in the gold price, but at US$2.50/lb remains near
mid-2009 lows. Copper has likely been ‘over-sold’, given the
fifth-highest imports into China on record in December, new
fiscal stimulus by Beijing to spur the economy (speeding up
spending on 300 infrastructure projects) and a planned 24%
increase in capital spending by the State Electricity Grid
(likely geared towards copper cable). Mining companies have
recently cut projected output for 2015 by 300,000 tonnes (Rio
Tinto at Kennecott, BHP Billiton at Escondida and Glencore
at Alumbrera), helping to trim an expected surplus this year
to a modest 250,000 tonnes.
The Australian - Rio Tinto has offered to drop a US$1.6 billion
royalty the company would receive from its Oyu Tolgoi
copper-gold mine to break the deadlock with the Mongolian
government over a stalled US$5 billion expansion of the
project.
The Monitor - BHP Billiton could be forced to lay off more
workers at its Olympic Dam copper mine in South Australia
as the mining giant looks to further cut costs. "With this fall in
price, we have no choice but to further accelerate our cash
reduction efforts," the report quoted BHP Olympic Dam Asset
President Darryl Cuzzubbo as saying.
Thomson Reuters - Freeport-McMoRan is expected to export
500,000 tonnes of copper concentrate from its Indonesian
operations over the next six months, down 100,000 tonnes
from the previous six months, a company official said. The
official from Freeport's Indonesian unit, who made the
comment late on Sunday and declined to be named, did not
give a reason for the expected fall in exports. The Indonesian
government extended Freeport's permit to continue shipping
copper concentrate for another six months after the miner
announced a site for a new copper smelter.
First Quantum Minerals said it will shortly reopen its
Ravensthorpe nickel mine in Western Australia at a limited
capacity, The West Australian reported. Operations at the
mine were suspended in December 2014 after a leach tank
burst and spilled slurry, damaging a power substation. The
company expects to produce 24,000 tonnes to 30,000 tonnes
of nickel from the mine in 2015.
Metal Bulletin - China's refined zinc imports dropped for the
sixth consecutive month in December 2014 to 17,469 tonnes
— down 71% from a year earlier — though exports remained
high as tightening credit availability from banks dampened
demand and forced sellers to search for alternative outlets.
Australian Companies
Newcrest Mining reported total gold production of 577,110
ounces for the quarter ended Dec. 31, 2014, up slightly from
the 561,731 ounces produced in the previous quarter. The
company upped its gold and copper production guidance for
fiscal 2015, now expecting to produce between 2.3 million
ounces and 2.5 million ounces of gold, and between 90,000
tonnes and 100,000 tonnes of copper.
Northern Star Resources said total gold sold by the company
in the quarter ended Dec. 31, 2014, was in line with guidance
at 142,556oz, as were all-in sustaining costs of A$1,073/oz.
3. Oz Metals
16th
Edition – 1st
Feb 2015
DISCLAIMER
This report is provided in good faith from sources believed to be accurate and reliable. Terra Studio Pty Ltd directors and employees do not accept liability
for the results of any action taken on the basis of the information provided or for any errors or omissions contained therein. Readers should seek investment
advice from their professional advisors before acting upon information contained herein.
Page 3 / 4
TerraStudio
PanAust said the group's consolidated output in 2014
exceeded guidance, with copper in concentrate production
rising 10% year over year to 71,155 tonnes. Meanwhile,
production of gold in concentrate and doré totaled 168,755
ounces, surpassing the guidance of between 160,000 oz and
165,000 oz. In 2015, PanAust expects to produce between
73,000 tonnes and 76,000 tonnes of copper in concentrate,
and between 175,000 ounces and 183,000 ounces of gold in
concentrate and doré.
Sandfire Resources further extended the mine life of its 1.5
million tonnes per annum DeGrussa copper-gold mine to mid-
2021. The company incorporated the high-grade
underground mineral resource of 9.5 million tonnes grading
5.7% copper and 2 g/t of gold for 546,000 tonnes contained
copper and 616,000 ounces contained gold to the mine plan,
and added a maiden ore reserve for the C4 deposit of 2
million tonnes grading 4.5% copper and 1.5 g/t of gold for
88,000 tonnes contained copper and 94,000 ounces
contained gold.
Mungana Goldmines reported an updated JORC-compliant
resource estimate for its King Vol zinc deposit in Queensland,
which will form the basis of development studies on the
property. The deposit hosts indicated resources containing
154,000 tonnes of zinc, 9,000 tonnes of copper, 7,000 tonnes
of lead and 1.23 million ounces of silver within 1.05 million
tonnes grading 14.7% zinc, 0.9% copper, 0.7% lead and 36.5
g/t of silver.
Transactions, Mergers & Acquisitions
Mining.com - The number of mergers and acquisitions in the
mining and metals industry declined to the lowest in a decade
last year as much anticipated private equity interest in the
sector evaporated. The report by E&Y shows 2014 was the
fourth consecutive year of declining M&A activity, with deal
volumes down 23% year-on-year to 544 in 2014, the lowest
volume of deals since 2003. Overall deal values have also
been spiraling downwards, tanking 49% from 2013 to
US$44.6 billion in 2014, the lowest since 2004. E&Y says the
larger number of sub-$10m deals which makes up nearly two-
thirds of all deals "indicates distress among juniors and
opportunistic buyers entering the market". Opportunistic
buyers buying distressed assets (aka vulture funds picking at
carcasses) aside, what's happened to the billions readied for
the sector we've been told for the past two years are imminent?
Bloomberg estimated funds raised for investments in mining
and metals last year topped $1 billion, compared to about
$8.8 billion in 2013. Others put the figure as high as $15
billion.
AFR - Panoramic Resources Managing Director Peter Harold
believes that the nickel sector is likely to see a rise in mergers
among cash-positive companies.
Alloy Resources secured an option over the Martin's Well
gold-silver-copper project, which contains walk up drill targets
on 2km of outcropping quartz-veined gossans. The project is
located in South Australia, where the company secured an
848km2
exploration license through application.
Bauxite Sector
Source: Bloomberg, SNL
Lithium-Tantalum Sector
Source: SNL
Tin Sector
Source: SNL
Nickel Sector
Source: SNL
Copper Producers
Source: SNL
Code Company Name
Close
Price
Week
r
YTD r
52 Week
Range
Market Cap
(A$m)
Cash
(A$m)
TEV
(A$m)
ABX Australian Bauxite 0.300 ▲ 11% (2%) 38 5 33
BAU Bauxite Resources 0.097 ▼ (8%) (1%) 22 25 (2)
MLM Metallica Minerals 0.057 ▼ (5%) 4% 10 1 9
MMI Metro Mining 0.038 ▼ (5%) 41% 11 8 3
Code Company Name
Close
Price
Week r YTD r
52 Week
Range
Market Cap
(A$m)
Cash
(A$m)
TEV
(A$m)
AJM Altura Mining 0.050 ▲ 6% (23%) 23 3 39
GXY Galaxy Resources 0.025 ▼ (7%) 0% 27 3 93
ORE Orocobre 2.93 ▲ 3% 5% 387 26 362
PLS Pilbara Minerals Ltd. 0.037 ▼ (8%) (12%) 23 2 21
RDR Reed Resources 0.039 ▲ 18% 3% 19 7 NA
Code Company Name
Close
Price
Week r YTD r
52 Week
Range
Market Cap
(A$m)
Cash
(A$m)
TEV
(A$m)
CSD Consolidated Tin Mines 0.052 ▼ (13%) 27% 15 0 15
ELT Elementos 0.006 ▼ (14%) (25%) 5 1 4
KAS Kasbah Resources Limited 0.053 ▼ (12%) (2%) 24 4 18
MLX Metals X Limited 1.10 ▲ 6% 40% 458 57 401
MOO Monto Minerals 0.002 — 0% 0% 3 1 2
SRZ Stellar Resources Limited 0.028 ▲ 8% (3%) 8 4 NA
VMS Venture Minerals Limited 0.037 ▼ (5%) 19% 11 7 4
Code Company Name
Close
Price
Week r YTD r
52 Week
Range
Market Cap
(A$m)
Cash
(A$m)
TEV
(A$m)
TEV/
EBITDA
IGO Independence Group 4.95 ▲ 5% 12% 1,160 57 1,131 8.1x
MBN Mirabella Nickel 0.029 — 0% 0% 27 31 66 NA
MCR Mincor Resources 0.72 ▲ 7% 23% 136 26 114 3.6x
PAN Panoramic Resources 0.46 ▼ (4%) 8% 146 64 90 1.9x
WSA Western Areas 4.02 ▼ (1%) 7% 935 231 922 6.4x
AVQ Axiom Mining 0.013 ▼ (7%) (13%) 44 2 41 NM
CZI Cassini Resources 0.10 ▼ (17%) (21%) 11 8 3 NM
DKM Duketon Mining 0.17 ▼ (13%) (37%) 13 7 6 NA
LEG Legend Mining 0.008 ▼ (11%) 14% 16 7 9 NA
MAT Matsa Resources 0.155 ▼ (3%) (9%) 22 3 20 NM
MLM Metallica Minerals 0.057 ▼ (5%) 4% 10 1 9 NA
PIO Pioneer Resources 0.018 ▲ 6% 38% 11 1 10 NM
POS Poseidon Nickel 0.11 — 0% (8%) 75 4 106 NM
SEG Segue Resources 0.006 ▼ (25%) 20% 12 1 11 NM
SGQ St George Mining 0.059 ▼ (12%) (6%) 7 1 5 NA
SIR Sirius Resources 2.51 ▼ (10%) (2%) 857 59 798 NM
TLM Talisman Mining 0.15 ▲ 11% (3%) 20 16 4 NM
WIN Winward Resources 0.13 ▲ 19% (22%) 11 6 5 NM
Code Company Name
Close
Price
Week
r
YTD r
52 Week
Range
Market Cap
(A$m)
Cash
(A$m)
TEV
(A$m)
TEV/
EBITDA
ABY Aditya Birla Minerals 0.20 ▲ 3% 3% 63 137 (42) NA
AOH Altona Mining 0.23 ▲ 2% (4%) 123 129 (6) 3.0x
HGO Hillgrove Resources 0.38 ▲ 1% (16%) 56 16 70 1.7x
KBL KBL Mining 0.018 ▼ (40%) (40%) 7 7 22 1.4x
MWE Mawson West 0.035 ▲ 75% (30%) 7 48 36 NM
OZL OZ Minerals 3.87 ▲ 12% 11% 1,174 364 1,020 5.6x
PNA PanAust 1.21 ▼ (9%) (14%) 771 130 1,016 NA
SFR Sandfire Resources 4.27 ▲ 1% (6%) 666 58 769 3.5x
SRQ Straits Resources 0.003 ▼ (25%) (40%) 4 13 127 17.2x
TGS Tiger Resources 0.05 ▼ (55%) (62%) 56 80 202 NA
985 CST Mining 0.044 — 0% 0% 1,192 136 99 0.2x
1208 MMG 2.22 ▼ (4%) (8%) 11,743 137 24,668 4.0x
3993 China Molybdenum 4.90 ▼ (2%) 9% 57,955 1,883 62,003 NA
4. Oz Metals
16th
Edition – 1st
Feb 2015
DISCLAIMER
This report is provided in good faith from sources believed to be accurate and reliable. Terra Studio Pty Ltd directors and employees do not accept liability
for the results of any action taken on the basis of the information provided or for any errors or omissions contained therein. Readers should seek investment
advice from their professional advisors before acting upon information contained herein.
Page 4 / 4
TerraStudio
Copper Developers & Explorers
Source: ASX, SNL
Nickel Sector
Source: SNL
Gold Producers
Source: SNL
Gold Developers & Explorers
Source: SNL
Zinc & Poly-metallic Sector
Source: SNL
For further information, please contact:
J-François Bertincourt
m +61 406 998 779
jf@terrastudio.biz
au.linkedin.com/in/jfbertincourt
Code Company Name
Close
Price
Week
r
YTD r
52 Week
Range
Market Cap
(A$m)
Cash
(A$m)
TEV
(A$m)
ARE Argonaut Resources 0.010 ▼ (17%) (38%) 4 1 3
AVB Avanco Resources 0.073 ▼ (5%) (4%) 121 20 101
AVI Avalon Minerals 0.025 ▲ 25% 25% 4 1 NA
AZS Azure Minerals 0.017 ▼ (6%) (29%) 14 1 13
CDU CuDeco 1.41 — 0% (28%) 343 9 333
CVV Caravel Minerals 0.011 ▼ (8%) 38% 8 1 NA
ENR Encounter Resources 0.13 ▼ (7%) (4%) 17 4 13
ERM Emmerson Resources 0.032 ▼ (6%) 3% 12 3 9
FND Finders Resources 0.14 — 0% (7%) 93 8 77
GCR Golden Cross Resources 0.078 — 0% 11% 7 2 5
GPR Geopacific Resources 0.050 ▲ 9% (4%) 17 3 16
HAV Havilah Resources 0.140 ▼ (3%) 0% 22 6 16
HCH Hot Chili 0.16 ▼ (3%) 0% 56 13 53
HMX Hammer Metals 0.080 ▼ (2%) (2%) 7 1 6
IAU Intrepid Mines 0.13 ▲ 4% (4%) 48 59 (11)
IRN Indophil Resources 0.30 — 0% 0% 355 215 146
KDR Kidman Resources 0.062 ▲ 24% (7%) 7 3 4
KGL KGL Resources 0.16 ▼ (14%) (29%) 22 10 13
MEP Minotaur Exploration 0.10 ▼ (20%) (31%) 18 7 11
MNC Metminco 0.007 — 0% (13%) 13 3 10
MTH Mithril Resources 0.006 — 0% (14%) 3 1 1
PEX Peel Mining 0.065 ▲ 8% (6%) 9 3 5
RDM Red Metal 0.06 ▼ (7%) (22%) 11 2 9
RER Regal Resources 0.041 ▼ (5%) (11%) 8 2 5
RTG RTG Mining 0.710 ▼ (10%) 22% 80 11 73
RXM Rex Minerals 0.11 — 0% 0% 24 3 NA
SMD Syndicated Metals 0.026 ▼ (4%) (19%) 7 2 5
SRI Sipa Resources 0.037 ▼ (8%) 0% 23 4 19
SUH Southern Hemisphere 0.040 — 0% (7%) 10 2 7
THX Thundelarra Resources 0.099 ▼ (6%) (10%) 32 7 24
XAM Xanadu Mines 0.090 ▼ (1%) (10%) 33 4 34
Code Company Name
Close
Price
Week r YTD r
52 Week
Range
Market Cap
(A$m)
Cash
(A$m)
TEV
(A$m)
TEV/
EBITDA
IGO Independence Group 4.95 ▲ 5% 12% 1,160 57 1,131 8.1x
MBN Mirabella Nickel 0.029 — 0% 0% 27 31 66 NA
MCR Mincor Resources 0.72 ▲ 7% 23% 136 26 114 3.6x
PAN Panoramic Resources 0.46 ▼ (4%) 8% 146 64 90 1.9x
WSA Western Areas 4.02 ▼ (1%) 7% 935 231 922 6.4x
AVQ Axiom Mining 0.013 ▼ (7%) (13%) 44 2 41 NM
CZI Cassini Resources 0.10 ▼ (17%) (21%) 11 8 3 NM
DKM Duketon Mining 0.17 ▼ (13%) (37%) 13 7 6 NA
LEG Legend Mining 0.008 ▼ (11%) 14% 16 7 9 NA
MAT Matsa Resources 0.155 ▼ (3%) (9%) 22 3 20 NM
MLM Metallica Minerals 0.057 ▼ (5%) 4% 10 1 9 NA
PIO Pioneer Resources 0.018 ▲ 6% 38% 11 1 10 NM
POS Poseidon Nickel 0.11 — 0% (8%) 75 4 106 NM
SEG Segue Resources 0.006 ▼ (25%) 20% 12 1 11 NM
SGQ St George Mining 0.059 ▼ (12%) (6%) 7 1 5 NA
SIR Sirius Resources 2.51 ▼ (10%) (2%) 857 59 798 NM
TLM Talisman Mining 0.15 ▲ 11% (3%) 20 16 4 NM
WIN Winward Resources 0.13 ▲ 19% (22%) 11 6 5 NM
Code Company Name
Close
Price
Week
r
YTD r
52 Week
Range
Market Cap
(A$m)
Cash
(A$m)
TEV
(A$m)
TEV/
EBITDA
AGD Austral Gold 0.10 — 0% (23%) 48 NA 116 8.6x
ALK Alkane Resources 0.26 ▲ 4% 18% 108 16 92 13.6x
AMI Aurelia Metals 0.24 ▼ (11%) 0% 87 22 172 NM
BDR Beadell Resources 0.29 ▼ (17%) 27% 228 10 290 NA
DRM Doray Minerals 0.47 ▼ (13%) (2%) 108 16 108 3.3x
EVN Evolution Mining 0.90 ▼ (10%) 40% 643 32 773 3.8x
IGO Independence Group 4.95 ▲ 5% 12% 1,160 57 1,131 8.1x
KCN Kingsgate Consolidated 0.79 — 0% 20% 177 54 277 NM
KRM Kingsrose Mining 0.25 ▼ (14%) (2%) 90 7 95 NM
LSA Lachlan Star 0.033 ▲ 38% 65% 5 2 24 NA
MIZ Minera Gold 0.003 — 0% 0% 8 0 13 NA
MLX Metals X 1.10 ▲ 6% 40% 458 57 401 5.7x
MML Medusa Mining 0.83 ▼ (3%) 27% 171 13 167 2.7x
MOY Millennium Minerals 0.036 ▼ (10%) (3%) 8 2 46 NA
NCM Newcrest Mining 13.56 ▼ (2%) 25% 10,394 141 14,455 NM
NGF Norton Gold Fields 0.19 — 0% 48% 172 38 273 NA
NST Northern Star Resources 1.80 ▼ (15%) 20% 1,063 82 987 11.8x
OGC OceanaGold Corp. 2.80 ▲ 6% 39% 843 NA 977 4.9x
PGI PanTerra Gold 0.017 ▲ 6% (6%) 14 5 89 NA
PRU Perseus Mining 0.35 ▼ (7%) 33% 182 37 146 6.2x
RMS Ramelius Resources 0.135 — 0% 165% 63 12 53 NM
RRL Regis Resources 1.90 ▼ (5%) (2%) 947 7 980 NM
RSG Resolute Mining 0.37 ▼ (13%) 40% 237 19 NA NA
SAR Saracen Mineral Holdings 0.36 ▼ (13%) 41% 285 36 264 6.3x
SBM St Barbara 0.21 ▲ 8% 100% 104 79 364 NM
SLR Silver Lake Resources 0.23 ▼ (25%) 15% 113 24 102 NM
TBR Tribune Resources 3.15 ▼ (2%) 19% 158 11 172 10.0x
TRY Troy Resources 0.56 ▼ (23%) 21% 108 43 105 NM
UML Unity Mining 0.010 ▼ (9%) 43% 11 7 NA NA
Code Company Name
Close
Price
Week
r
YTD r
52 Week
Range
Market Cap
(A$m)
Cash
(A$m)
TEV
(A$m)
ABU ABM Resources 0.30 ▼ (12%) 3% 82 10 72
AWV Anova Metals 0.039 ▼ (3%) 44% 10 1 8
AZM Azumah Resources 0.029 ▼ (19%) 45% 11 4 9
BLK Blackham Resources 0.096 ▼ (2%) 88% 14 1 13
BOK Black Oak Minerals 0.39 ▲ 4% 44% 17 11 31
BSR Bassari Resources 0.013 ▼ (32%) 8% 15 - 15
CHN Chalice Gold Mines 0.13 ▼ (7%) 24% 37 44 (7)
CHZ Chesser Resources 0.03 — 0% (11%) 7 1 8
DCN Dacian Gold 0.37 ▼ (8%) 32% 36 11 25
EXC Exterra Resources 0.012 ▼ (8%) (8%) 2 1 2
EXG Excelsior Gold 0.079 ▼ (6%) 30% 37 2 36
FML Focus Minerals 0.010 ▲ 11% 43% 91 81 91
GCY Gascoyne Resources 0.10 ▼ (17%) 41% 17 1 16
GMR Golden Rim Resources 0.009 ▲ 13% 80% 12 1 13
GOR Gold Road Resources 0.37 ▼ (3%) 51% 220 10 210
GRY Gryphon Minerals 0.076 ▼ (10%) 19% 30 34 NA
IDC Indochine Mining 0.012 ▼ (4%) (4%) 15 0 16
KGD Kula Gold 0.055 — 0% 25% 14 3 14
MSR Manas Resources 0.018 ▼ (14%) 29% 8 6 6
MUX Mungana Goldmines 0.10 ▲ 3% (22%) 24 5 18
MYG Mutiny Gold 0.047 ▼ (19%) 7% 32 3 29
OBS Orbis Gold 0.60 ▼ (5%) 7% 150 5 145
OGX Orinoco Gold 0.072 ▲ 3% 22% 10 1 11
PNR Pacific Niugini 0.058 ▲ 2% 16% 18 3 16
PXG Phoenix Gold 0.120 ▼ (14%) 22% 44 9 35
RED Red 5 0.105 ▼ (5%) 14% 80 38 41
RNI Resource & Investment 0.074 ▼ (8%) (1%) 36 5 51
RNS Renaissance Minerals 0.063 ▼ (10%) (3%) 25 2 24
SIH Sihayo Gold 0.018 ▲ 80% 125% 20 0 17
TAM Tanami Gold 0.015 ▼ (17%) 7% 18 1 24
WAF West African Resources 0.100 ▼ (5%) 0% 27 3 26
WPG WPG Resources 0.044 ▲ 2% 16% 12 3 8
Code Company Name
Close
Price
Week r YTD r
52 Week
Range
Market Cap
(A$m)
Cash
(A$m)
TEV
(A$m)
AQR Aeon Metals 0.086 ▼ (14%) (14%) 26 5 33
DGR DGR Global 0.031 ▼ (9%) (3%) 13 0 14
HRR Heron Resources 0.12 ▼ (8%) (4%) 43 28 19
IBG Ironbark Zinc 0.105 ▲ 9% 31% 46 3 44
IPT Impact Minerals 0.020 ▼ (23%) (17%) 11 1 NA
IVR Investigator Resources 0.019 ▲ 6% 19% 9 3 6
MRP MacPhersons Resources 0.145 ▲ 4% 16% 46 7 39
PNX Phoenix Copper 0.024 ▼ (11%) (20%) 8 3 6
RDM Red Metal 0.063 ▼ (7%) (22%) 11 8 3
RVR Red River Resources 0.16 — 0% 45% 28 4 24
RXL Rox Resources 0.026 ▼ (7%) (7%) 22 3 NA
TZN Terramin Australia 0.140 — 0% 27% 197 1 196
VXR Venturex Resources 0.004 — 0% (20%) 6 1 5