
Recommended
More Related Content
What's hot
What's hot (11)
Similar to Impact of water availability on Cattle Milk Production
Similar to Impact of water availability on Cattle Milk Production (20)
Recently uploaded
Recently uploaded (20)
Impact of water availability on Cattle Milk Production
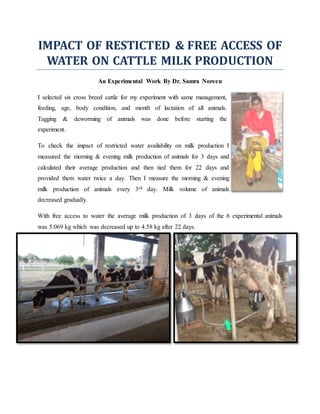
- 1. IMPACT OF RESTICTED & FREE ACCESS OF WATER ON CATTLE MILK PRODUCTION An Experimental Work By Dr. Samra Noreen I selected six cross breed cattle for my experiment with same management, feeding, age, body condition, and month of lactation of all animals. Tagging & deworming of animals was done before starting the experiment. To check the impact of restricted water availability on milk production I measured the morning & evening milk production of animals for 3 days and calculated their average production and then tied them for 22 days and provided them water twice a day. Then I measure the morning & evening milk production of animals every 3rd day. Milk volume of animals decreased gradually. With free access to water the average milk production of 3 days of the 6 experimental animals was 5.069 kg which was decreased up to 4.58 kg after 22 days.
- 2. Results I obtained from my experiment are graphically shown below. Production on 24th sep,14 was with free access to water and on 15th October, 14 indicate the production on 22nd day after restricted water availability. Diagonally straight line indicates the decreasing trend of milk volume with water restriction. From this experiment I have concluded that restriction of water affects the milk production of cattle. Restricting the water availability from 24 hours to only twice a day resulted in an average decrease of 0.5 kg in the production of each animal. To check the impact of 24 hours availability of water on the milk production of cattle I divided the 6 animals (which I selected to check the impact of restricted water availability on milk production) into two groups with three animals in each group. (Group A included cattle with free access to water & group B included cattle with water availability twice a day.) I measured the morning & evening milk of animals in both groups every 3rd day for 22 days and took their average. 5.069 5.036 4.945 4.925 4.85 4.76 4.62 4.58 4.3 4.4 4.5 4.6 4.7 4.8 4.9 5 5.1 5.2 Avg. milk volume in Kg Avg. milk volume Linear (Avg. milk volume)
- 3. Results of experiment are presented graphically. The trend lines in graph shows the increasing trend in milk production of group A cattle (i.e. cattle with free access to water) which indicates that there is an increase of about half kg in milk production of cattle when there was 24 hours availability of water for almost 22 days while the trend line for milk production of group B cattle is almost straight which indicates that there is no significant change in the milk production of group B cattle which had water availability only twice a day. Result From the above experiments it is concluded that 24 hours availability of water results in an increase in milk production of cattle. 4.78 5.02 5.052 5.21 5.27 5.25 5.31 5.3 4.64 4.6 4.56 4.59 4.62 4.54 4.54 4.57 4 4.2 4.4 4.6 4.8 5 5.2 5.4 5.6 milk volume of group A milk volume of group B Linear (milk volume of group A) Linear (milk volume of group B)