Wind Power Feasible
•
3 likes•412 views

Among the Renewable Energy Sources, Wind Energy is taken up with careful prior efforts before implementation as it requires all capital and technical inputs before payback starts. However, it is a clean source of electric power compared to coal based thermal power. India is a country that has made progress in wind power investment.

Recommended
More Related Content
What's hot
What's hot (20)
Similar to Wind Power Feasible
Similar to Wind Power Feasible (20)
More from H Janardan Prabhu
More from H Janardan Prabhu (20)
Recently uploaded
Recently uploaded (20)
Wind Power Feasible
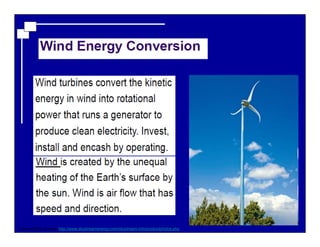
- 1. Turbine Photo Source: http://www.skystreamenergy.com/skystream-info/productphotos.php
- 2. U b Pl i Renewable Energy Projects in Action Wind Power Fundamentals
- 7. A Kinetic Energy Thus: Fundamental Equation of Wind Power A v mass flux– Power is KE per unit time: dt • dm/dt = ρ* A * v Thus:– • Power ~ cube of velocity • • Power ~ air density Power ~ rotor swept area A= πr 2 v 3• P = ½ * ρ * A * – Wind Power depends on: • amount of air (volume) • speed of air (velocity) • mass of air (density) flowing through the area of interest (flux) – Kinetic Energy definition: • KE = ½ * m * v 2 m& dm • P = ½ * m& * v 2 – Fluid mechanics gives mass flow rate (density * volume flux):
- 8. Efficiency in Extracting Wind Power extracted by = PT/PW the turbine 16/27 nd turbine can do in Betz Limit & Power Coefficient: • Power Coefficient, Cp, is the ratio of power to the total contained in the wind res urce Cp • Turbine power output PT = ½ * ρ * A * v 3 * Cp • The Betz Limit is the maximal possible Cp = • 59% efficiency is the BEST a conventional wi extracting power from the wind
- 17. • Wind types • • Tornadoes Gusts / Dust devils / Microbursts • • Nocturnal Jets Atmospheric Waves • Planetary circulations: – Jet stream – Trade winds – Polar jets • Geostrophic winds • Thermal winds • Gradient winds • Katabatic / Anabatic winds – topographic winds • Bora / Foehn / Chinook – downslope wind storms • Sea Breeze / Land Breeze • Convective storms / Downdrafts • Hurricanes/ Typhoons
- 32. Wind Turbine Types Photos courtesy of Steve Connors, MITEI Horizontal-Axis – HAWT • Single to many blades - 2, 3 most efficient • Upwind, downwind facing • Solidity / Aspect Ratio – speed and torque • Shrouded / Ducted – Diffuser Augmented Wind Turbine (DAWT) Vertical-Axis – VAWT • Darrieus / Egg-Beater (lift force driven) • Savonius (drag force driven)
- 42. Wind Turbine Blades Systems Hubs: and http://guidedtour.windpower.org/en/tour/wres/index.htm • Blade tip speed: • 2-Blade Teetered Pitch control:
- 64. Fundamentals of Wind Power …Wind Power Fundamentals …
- 65. A Kinetic Energy Thus: Fundamental Equation of Wind Power A v mass flux– Power is KE per unit time: dt • dm/dt = ρ* A * v Thus:– • Power ~ cube of velocity • • Power ~ air density Power ~ rotor swept area A= πr 2 v 3• P = ½ * ρ * A * – Wind Power depends on: • amount of air (volume) • speed of air (velocity) • mass of air (density) flowing through the area of interest (flux) – Kinetic Energy definition: • KE = ½ * m * v 2 m& dm • P = ½ * m& * v 2 – Fluid mechanics gives mass flow rate (density * volume flux):
- 66. Efficiency in Extracting Wind Power extracted by = PT/PW the turbine 16/27 nd turbine can do in Betz Limit & Power Coefficient: • Power Coefficient, Cp, is the ratio of power to the total contained in the wind res urce Cp • Turbine power output PT = ½ * ρ * A * v 3 * Cp • The Betz Limit is the maximal possible Cp = • 59% efficiency is the BEST a conventional wi extracting power from the wind
- 67. 0.12 0.1 0.08 0.06 0.04 0.02 0 1 2 3 4 5 6 7 8 9 0 1 2 3 4 5 6 7 8 9 0- - - - - - - -< Power Curve of Wind Turbine is operating at ut ≈ 30% turbine and the good site) windspeed(m/s) Distribution Capacity Factor (CF): • The fraction of the year the turbine generator rated (peak) power Capacity Factor = Average Output / Peak Outp • CF is based on both the characteristics of the site characteristics (typically 0.3 or above for a Power Curve of 1500 kW Turbine Wind Frequency Nameplate
- 68. Lift and Drag Forces
- 69. Wind Power Technology …
- 70. Diagnostics Wind Turbine Subsystems – – Cooling Diagnostics – Foundation – Tower – Nacelle – Hub & Rotor – Drivetrain – Gearbox – Generator – Electronics & Controls – Yaw – Pitch – Braking – Power Electronics
- 71. Foundations and Tower monopole towers for offshore
- 72. 6 methods to determine optimum blade shape Nacelle, Rotor & Hub attack, lift and drag characteristics Combine with theory or empirical6. Main Rotor Design Method (ideal case): 1. Determine basic configuration: orientation and blade number 2 take site wind speed and desired power output 3 Calculate rotor diameter (accounting for efficiency losses) 4. Select tip-speed ratio (higher more complex airfoils, noise) and blade number (higher efficiency with more blades) 5. Design blade including angle of
- 73. Hi t i ll hi h t ( f Electrical Generator Generator als) – – Slip (operation above/below synchronous speed) Reduces gearbox wear Masters, Gilbert, Renewable and Efficient Electric Power Systems, Wiley-IEEE Press, 2003 http://guidedtour.windpower.org/en/tour/wtrb/genpoles.htm . possible • Generator: – Rotating magnetic field induces current • Synchronous / Permanent Magnet – Potential use without gearbox – Historically higher cost (use of rare-earth met • Asynchronous / Induction Generator
- 74. control low Control Systems & Electronics with wind speed to actively control low-speed shaft for a more clean power curve • Control methods – Drivetrain Speed • Fixed (direct grid connection) and Variable (power electronics for indirect grid connection) – Blade Regulation • Stall – blade position fixed, angle of attack increases with wind speed until stall occurs behind blade • Pitch – blade position changes
- 75. Wind Grid Integration error research: rastructure, Advanced Controls air, batteries, -grid (V2G) Wind Forecast Real WindProduction 500 0 400 0 300 0 Time 23-24/01/2009 Left graphic courtesy of ERCOT Right graphic courtesy of RED Electrica de Espana WindProductioninMW Wind Market Program • Short-term fluctuations and forecast • Potential solutions undergoing – Grid Integration: Transmission Inf Demand-Side Management and – Storage: flywheels, compressed pumped-hydro, hydrogen, vehicle-2 12000 11000 10000 9000 8000 7000 6000
- 76. Future Technology Development superconducting control methods designs materials, direct maintenance • Improving Performance: – Capacity: higher heights, larger blades, magnets – Capacity Factor: higher heights, advanced (individual pitch, smart-blades), site-specific • Reducing Costs: – Weight reduction: 2-blade designs, advanced drive systems – Offshore wind: foundations, construction and
- 77. Future Technology Development materials, preemptive ude concepts Windpower • Improving Reliability and Availability: – Forecasting tools (technology and models) – Dealing with system loads • Advanced control methods, diagnostics and maintenance – Direct drive – complete removal of gearbox • Novel designs: – Shrouded, floating, direct drive, and high-altit Sky
- 78. Going Beyond the Science & Technology of Wind… Source: EWEA, 2009
- 79. % Cost Share of 5 MW Turbine Components Source: EWEA, 2009, citing Wind Direction, Jan/Feb, 2007
- 80. The Environment ts, effects Natural Resources Defense Council, World Wildlife Fund support wind power projects like Cape Wind Graphic Source: Elsam Engineering and Enegi and Danish Energy Agency • Cleaner air -- reduced GHGs, particulates/pollutan waste; minimized opportunity for oil spills, natural gas/nuclear plant leakage; more sustainable • Planning related to wildlife migration and habitats • Life cycle impacts of wind power relative to other energy sources • Some of the most extensive monitoring has been done in Denmark – finding post-installation benefits • Groups like Mass Audubon,
- 81. Wind energy is a mainstream, competitive and reliable power technology. Globally, progress is strong, with more active countries and players, and increasing annual installed capacity and investments. Technology improvements have reduced energy costs, on land. The industry has overcome supply bottlenecks and expanded supply chains.
- 82. Since 2008, wind power deployment has more than doubled, approaching 300 gigawatts (GW) of cumulative installed capacities, led by China (75 GW), the United States (60 GW) and Germany (31 GW). Wind power now provides 2.5% of global electricity demand – and up to 30% in Denmark, 20% in Portugal and 18% in Spain. Policy support has been instrumental in stimulating this tremendous growth.
- 83. Wind power entails no direct greenhouse gas (GHG) emissions and does not emit other pollutants (such as oxides of sulphur and nitrogen); additionally, it consumes no water. As local air pollution and extensive use of fresh water for cooling of thermal power plants are becoming serious concerns in hot or dry regions, these benefits of wind become increasingly important
- 84. Wind energy, like other power technologies based on renewable resources, is widely available throughout the world and can contribute to reduced energy import dependence. As it entails no fuel price risk or constraints, it also improves security of supply. Wind power enhances energy diversity and hedges against price volatility of fossil fuels, thus stabilizing costs of electricity generation in the long term.