
Recommended
Recommended
More Related Content
What's hot
What's hot (17)
Viewers also liked
Viewers also liked (14)
Similar to Study Of Impact Of Land Use ,Land Cover Change On Durg Block By Using Remote Sensing And Gis, District Durg, Chhattisgarh, India
Similar to Study Of Impact Of Land Use ,Land Cover Change On Durg Block By Using Remote Sensing And Gis, District Durg, Chhattisgarh, India (20)
Recently uploaded
Recently uploaded (20)
Study Of Impact Of Land Use ,Land Cover Change On Durg Block By Using Remote Sensing And Gis, District Durg, Chhattisgarh, India
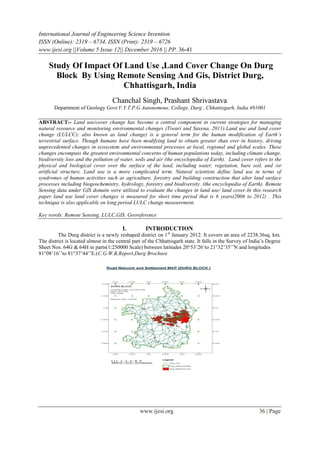
- 1. International Journal of Engineering Science Invention ISSN (Online): 2319 – 6734, ISSN (Print): 2319 – 6726 www.ijesi.org ||Volume 5 Issue 12|| December 2016 || PP. 36-41 www.ijesi.org 36 | Page Study Of Impact Of Land Use ,Land Cover Change On Durg Block By Using Remote Sensing And Gis, District Durg, Chhattisgarh, India Chanchal Singh, Prashant Shrivastava Department of Geology Govt.V.Y.T.P.G Autonomous. College, Durg , Chhattisgarh, India 491001 ABSTRACT:- Land use/cover change has become a central component in current strategies for managing natural resource and monitoring environmental changes (Tiwari and Saxena, 2011).Land use and land cover change (LULCC); also known as land change) is a general term for the human modification of Earth’s terrestrial surface. Though humans have been modifying land to obtain greater than ever in history, driving unprecedented changes in ecosystem and environmental processes at local, regional and global scales. These changes encompass the greatest environmental concerns of human populations today, including climate change, biodiversity loss and the pollution of water, soils and air (the encyclopedia of Earth). Land cover refers to the physical and biological cover over the surface of the land, including water, vegetation, bare soil, and /or artificial structure. Land use is a more complicated term. Natural scientists define land use in terms of syndromes of human activities such as agriculture, forestry and building construction that alter land surface processes including biogeochemistry, hydrology, forestry and biodiversity. (the encyclopedia of Earth). Remote Sensing data under GIS domain were utilized to evaluate the changes in land use/ land cover.In this research paper land use land cover changes is measured for short time period that is 6 years(2006 to 2012) . This technique is also applicable on long period LULC change measurement. Key words: Remote Sensing, LULC,GIS, Georeference I. INTRODUCTION The Durg district is a newly reshaped district on 1st January 2012. It covers an area of 2238.36sq. km. The district is located almost in the central part of the Chhattisgarh state. It falls in the Survey of India’s Degree Sheet Nos. 64G & 64H in parts(1:250000 Scale) between latitudes 20°53’26’to 21°32’35’’N and longitudes 81°08’16’’to 81°37’44’’E.(C.G.W.B,Report,Durg Brochure
- 2. Study Of Impact Of Land Use ,Land Cover Change On Durg www.ijesi.org 37 | Page 2013). The study area is Durg block, situated in Durg district of Chhattisgarh state, which comes in between Latitude 21° 02' 00” N and 21°22’ 00” N and Longitude “81°08' 00” E and 81° 28’ 00” E and most of the area covered in toposheet no. 64G/8.It covers an area of 675.17 Sq. Km. As per 2011 census the total population of the district is 1721726. The urban population is 64.75 % and the rural population is 35.25 % in the district. The population density is 770. (C.G.W.B,Report,Durg Brochure 2013). Durg block had a population of 1126731. (District statistical booklet 2013-14) II. DRAINAGE The general slope of the district comes under Mahanadi river slope and is towards the north and north east and locally in some places towards east. The main rivers of Mahanadi are Sheonath, Kharun, Tandula. Sheonath is the main river of the district which originates from Panabaras Hill (625 M) and flows towards north-east. This river is the main tributary of Mahanadi River. The main tributary of Sheonath river is Tandula river. This river originates from hills situated in the north of Bhanupratappur (District- Kanker). After covering a distance of 34 km this river joins Sukhanala. This river joins Sheonath river in the south-west of Durg in a distance of approximately 13 km. The total length of this river is 96.6 km. A dam is constructed during the period 1905 to 1921 at the joining point of Sukhanala and Tandula river. Kharun river originates from Petechua in the south-east of the district and after flowing 80 km joins Sheonath river near Somnath in the north. Sheonath river flows nearer to the western border of the district whereas river Kharun forms the eastern border of the district. The length of Kharun river is 120 km. The area around Kharun river is very fertile.
- 3. Study Of Impact Of Land Use ,Land Cover Change On Durg www.ijesi.org 38 | Page III. GEOMORPHOLOGY Geomorphologically the district displays Structural Plains and Flood Plains. The major part of the district is represented by Structural Plain on Proterozoic rocks. This unit is developed over rocks of Purana sedimentary basin of Chhattisgarh. This unit has extensive cris-crossed fractures and joints. They are having gently sloping erosional surfaces and thin to moderate cover of soil. Western part of the district is represented by Flood Plains. It is formed by extensive deposition of alluvium by major river system in the district. This unit is normally flat/gently undulating land surface and located along river courses. This unit is primarily composed of unconsolidated fluvial materials like gravels, sand and silt. Overall the topography in the district varies between 241 m to 470 m amsl. The area has general slope towards north & north-east direction with average elevation of 300 m amsl. (C.G.W.B,Report,Durg Brochure 2013) Methods And Techniques: Methods and techniques which is applied for LULC change detection is discussed below in flow chart:
- 4. Study Of Impact Of Land Use ,Land Cover Change On Durg www.ijesi.org 39 | Page
- 5. Study Of Impact Of Land Use ,Land Cover Change On Durg www.ijesi.org 40 | Page TABLE NO.3: Showing Lulc Change Information From Year 2006to Year 2012 In Sq. Meters With Type Wise Change. TBLE NO.4: Showing Lulc Change Information From Year 2006 To Year 2012 In Sq.K.M IV. DISCUSSION AND RESULT With above method it is observed that one can extract the LULC change information with following above steps. It is observed that most of the land changes occurred in the agriculture fields and wastelands. Method requires manual digitization on raster images to formulate vector information, and thus only the digitization and field visit for ground truthing are time consuming part of this methodology, but it is essential too. SL NO. LULC 2006 LULC 2006 CHANGE VALUE AREA ( SQ METER) 1 Agriculture Built-up Agriculture to Built-up 8,192,924.0 2 Agriculture Wastelands Agriculture to Wastelands 780,234.0 3 Wastelands Built-up Wastelands to Built-up 2,609,081.0 4 Water bodies Built-up Water bodies to Built-up 185,249.0 SL.N. LULC TYPE YEAR 2006 (SQ KM) YEAR 2012 (SQ KM) CHANGE (IN SQ KM) 1 Agriculture 395 388 7 2 Built-up 123 134 11 3 Forest 2 2 0 4 Wastelands 97 93 4 5 Water bodies 26 26 0.01
- 6. Study Of Impact Of Land Use ,Land Cover Change On Durg www.ijesi.org 41 | Page V. CONCLUSION Looking at the result of this study, it is observed that the percentage ratio of agriculture is reducing and it is claimed by man-made buildups. The result shows that development of man-made features is horizontally occupying the land. And vertical growth of building is nominal. Indirectly, the groundwater will be affected due to concretization of the surface. If present scenario of Urbanization and agricultural land degradation towards wasteland were to continue, then it is very difficult to maintaining equilibrium between environment and human being. At the present moment, Durg area suffering with negative effect of housing boards projects and private building construction. Therefore, a sustainable phase-wise management is needed in these areas. REFERENCES [1] Central ground water board Report Raipur (Durg Brochure 2013)Chhattisgarh [2] District statistical booklet 2013-14,Durg,Chhattisgarh. [3] Map survey of India Toposheet No. 64G/8, Publish by Govt. of India. Tiwari M.K., and Saxena, A., (2011), Change Detection of Land Use/ Landcover Pattern in an Around Mandideep and Obedullaganj Area, using Remote Sensing and GIS, International Journal of Technology and Engineering System, 2(3), pp 398-402. [4] Web Site: https://earth.google.com Website: https://www.camelclimatechange.org [5] Website: https://www.qgis.org/en/site/forusers/download.html