
Recommended
Recommended
More Related Content
What's hot
What's hot (20)
Similar to Nutritional analysis tiger nut soy milk blends
Similar to Nutritional analysis tiger nut soy milk blends (20)
More from ijtsrd
More from ijtsrd (20)
Recently uploaded
Recently uploaded (20)
Nutritional analysis tiger nut soy milk blends
- 1. International Journal of Trend in Scientific Research and Development (IJTSRD) Volume 5 Issue 6, September-October 2021 Available Online: www.ijtsrd.com e-ISSN: 2456 – 6470 @ IJTSRD | Unique Paper ID – IJTSRD47657 | Volume – 5 | Issue – 6 | Sep-Oct 2021 Page 1430 Nutritional and Proximate Assessment of Milk Blends Formulated from Tiger Nut and Soy Beans Okoroafor, G. A.; Umeh, S. O. Department of Applied Microbiology and Brewing, Nnamdi Azikiwe University, Awka, Anambra State, Nigeria ABSTRACT The need for vegetable milk as substitute for dairy milk to meet consumers’ needs has been on the rise. This is because plant protein has been found to be an alternative to people suffering from lactose intolerance. This study analyzed the nutritive and proximate qualities of milk formulated from Tiger nut and soy beans milk using standard methods. Fresh tiger nut milk and soybean milk were aseptically processed in the Laboratory and blended at varying proportions to obtain seven blends A, B, C, D1, D2, E1 and E2 where A=100% soy milk, B= 100% tiger nut milk, C= 50% tiger nut milk and 50% soy milk, D1= 80% tiger nut milk and 20% soy milk, D2= 20% Tiger nut milk and 80% Soy milk, E1= 60% tiger nut milk and 40% soy milk and E2= 40% Tiger nut milk and 60% Soy milk without addition of spices or chemical preservatives. Results obtained were statistically analyzed with significant different at P≥0.5. Organoleptic analysis of the milk blends indicated that all samples were generally acceptable but Sample D1 had the highest acceptability with no significant difference at (P<0.05) for mouth feel, taste and colour while there was a significant difference in flavor and overall acceptability at (P≥0.5). Nutritive and proximate quality analysis indicated that moisture, carbohydrate, protein and fat were quantitatively the major components of the beverage and the pH fell within the neutral range and is suitable for people suffering from ulcer and other colic problems. Sample D1 had the highest carbohydrate as well as energy value of 9.85% and 86.61kcal/g respectively. The total calorific value increased with an increase in carbohydrate, protein and fat contents of the milk blends while total solids increased with decrease in moisture. All samples were highly acceptable but sample D1 received the highest overall acceptability score. An observable trend was that protein increased with an increase in soy milk substitution while fat and carbohydrate increased with an increase in tiger nut milk substitution. Thus, the provision of an enhanced energy drink that is of high nutritional and economical potential. It is suggested that increased Soy milk substitution is required for infants and children while increased Tiger nut milk substitution will be beneficial to Adults. KEY WORDS: Tiger nut, Soy beans, Milk blends, Nutritive quality, Proximate analysis How to cite this paper: Okoroafor, G. A. | Umeh, S. O. "Nutritional and Proximate Assessment of Milk Blends Formulated from Tiger Nut and Soy Beans" Published in International Journal of Trend in Scientific Research and Development (ijtsrd), ISSN: 2456- 6470, Volume-5 | Issue-6, October 2021, pp.1430-1439, URL: www.ijtsrd.com/papers/ijtsrd47657.pdf Copyright © 2021 by author (s) and International Journal of Trend in Scientific Research and Development Journal. This is an Open Access article distributed under the terms of the Creative Commons Attribution License (CC BY 4.0) (http://creativecommons.org/licenses/by/4.0) INTRODUCTION: Milk is a whitish food rich in protein, carbohydrates, mineral, vitamin and calcium generally produced by the mammary secretory cells of females in a process called lactation; and is one of the defining characteristics of mammals. Milk must be specific to human consumption i.e. come from well-nourished healthy lactating animals (Guetouache et al.,2014). This means that the milk of infected animals (resulting from inflammation of the udder), undergoing a veterinary treatment is excluded. The quality of milk is susceptible to contamination, thus must be handled with care while extracting, IJTSRD47657
- 2. International Journal of Trend in Scientific Research and Development @ www.ijtsrd.com eISSN: 2456-6470 @ IJTSRD | Unique Paper ID – IJTSRD47657 | Volume – 5 | Issue – 6 | Sep-Oct 2021 Page 1431 transporting and storing. It is best at a temperature of 4°C during all operations and delivery to the consumer. Milk as an ideal source of nutrients such as vitamins, protein, calcium, carbohydrates, phosphorous, selenium, magnesium and zinc confers many health benefits to both adults and children. It is the best source of cheap and readily available calcium to the body which protects the body from major chronic ailments such as cancer, bone loss, arthritic conditions, migraine headaches, pre-menstrual syndrome, and obesity in children (Hashem et al., 2014). However, it was originally only gotten from animal source with most frequent and readily available being cow and goat milk. Animal milk is expensive and not easily assessed in terms of preparation and posse some health risk in lactose intolerant people (Clara and Helen, 2019). Due to the high cost of animal milk and its bi- products in developing countries, where average and low-income earners cannot afford it and its importance cannot be ignored, alternative sources that can meet these needs at an affordable rate and easy access are been developed and sourced from plants (Belewu and Belewu, 2007). Though undervalued in the past, milk from plant sources is key ingredient in the diet of many Africans. Recently, researchers have shown strong interest in these milk sources due to their high nutritional values and economic potentials. It is worth emphasizing that milk sources from plants is a radiating hope as well as an ally in the fight against hidden hunger (Belewu and Belewu 2007). Among the sources of vegetable milk, soybean is the most frequently studied and used and more research is being carried out to improve the milk quality (Sun- young et al., 2000). Little research attention has been given to Bambaranut (Vigna subterrenea) (Balogun et al., 2017), peanut (Arachis hypogaea) , melon seed (Citrulus lanatus) (Omole and Ighodaro, 2012) and tigernut milk (Ukwuru et al., 2011) or a combination of milk from two sources to produce a palatable ready-to-serve bottled beverage, like ‘Horchata de chufas’as done in Spain (Mordi et al; 2010). Soybeans (Glycine max) are composed of 40% high- quality protein and 20% fat (Udeozor and Awonorin, 2014). It has been shown to contain high levels of a number of phytochemicals and is specially noted for the cholesterol lowering effects of its protein (David et al., 2010). Among the numerous health-promoting compounds of soy, its flavones play a key role, in the prevention and treatment of cardiovascular diseases, cancer, and osteoporosis, premenstrual and postmenstrual symptoms (Hashemi, et al; 2014). Soymilk not only provides protein but also is a source of carbohydrate, lipid, vitamins and minerals (Chien and Snyde 1983). Soymilk is an alternative to dairy milk due to its low cost and high-quality protein to bridge the gap in protein deficiency than any other crop. Soymilk is a healthy drink and is important for people who are lactose intolerant (Clara and Helen, 2019). Tiger nut (Cyperus esculentus) has a knot shape and comes from the hazet nut family. Tiger nuts are rich in oil (Mason, 2008) as well as vitamins C and E and minerals such as magnesium, potassium, calcium and iron which help to protect one from cancer and cardiovascular diseases (Adejuyitan, 2011; Ejoh and Ndjouenkeu, 2006). The nuts are valued for their high nutritious starch content, dietary fiber, carbohydrate (mono, di and polysaccharides) (Umerie and Enebeli 1997). The nuts are said to be stimulant and tonic and also used in the treatment of indigestion, colic diarrhea, dysentery and excessive thirst (Francis and Umeh, 2021). Unlike other starchy vegetable tubers such as Potatoes, Tigernuts are a good source of healthy fats, it has about fatty acid composition of 73% monounsaturated fat, 18% saturated fat and 9% polyunsaturated fat which are non-inflammatory and allergen free (Sanchez-Zapata et al.,2012. Tiger nut is also known to be rich in Oleic acid which helps improve good HDL cholesterol while reducing the levels of LDL cholesterol, so consuming tigernuts and its product can help in preventing cardiovascular diseases. A blend of tiger nut and soybean milk in varying ratios will give milk with high protein and fat content compared to when taken singly. Therefore, this study aims to produce tiger nut and soybean milk blends with high nutritive and proximate qualities that will be tolerable and acceptable by both children and adults. MATERIALS AND METHODS Sample Collection Fresh tiger nuts and soy bean seeds were purchased from Garki Ugwuoba, Enugu State. The equipment, reagents and chemicals used were obtained from the Department of Applied Microbiology and Brewing, Nnamdi Azikiwe University, Awka, Nigeria. The nuts and seeds were sorted separately to remove, stones, spoilt nuts and seeds which may affect the taste and quality of the milk. Tiger nut and Soy milk preparation Tiger nut and soy milk was separately prepared using a modified method of Belewu (2007).
- 3. International Journal of Trend in Scientific Research and Development @ www.ijtsrd.com eISSN: 2456-6470 @ IJTSRD | Unique Paper ID – IJTSRD47657 | Volume – 5 | Issue – 6 | Sep-Oct 2021 Page 1432 Production of the tiger nut soy milk blend The milks were mixed in varying proportions 50:50, 60:40, 40:60, 80:20, 20:80, 100:0, 0:100, to obtain the final product as shown in Table 1. The mix was done using a food blender for homogeneity for 10minutes. The blends were heated at 720 C for 5 minutes in a water bath and cooled to room temperature. Mixing/blending Heating (720 C for 5s) Cooling Figure 1: Flowchart for Tiger Nut-Soymilk Blend Organoleptic evaluation Samples were subjected to sensory and organoleptic evaluation using 21 panelists. The panelists were selected based on their familiarity with phyto-milk. They were given one glassful of each sample and questionnaire and asked to rate the products for overall acceptability and sensory attributes of colour, aroma, taste, flavor, mouth feel and overall acceptability by testing and filling the questionnaire using the 9-point hedonic scale where 1=dislike extremely, 2= dislike very much, 3=dislike moderately, 4=dislike slightly, 5= neither like nor dislike, 6= like slightly, 7= like moderately, 8= like very much, 9= like extremely as described by Iwe, (2010) and the data generated subjected to statistical analysis using one-way ANOVA and Duncan’s test to check for significant difference. Proximate analysis The Proximate analysis of the samples was done using the analytical methods described by AOAC (2010). Moisture content Determination An empty petri-dish was dried in an oven for about 10minutes and allowed to cool in a desiccator containing Calcium chloride for 20minutes and then weighed (W1). Two grams (2g) of the sample was added to the already weighed petri-dish, which is then placed in the oven at 1050 C for 8hours and weighed again (W2). The petri-dish containing the sample was brought out cooled in a dessicator and weighed (W3). The procedure was repeated at 30minute intervals until a constant weight was obtained. The moisture content was then calculated as follows; % moisture Where; w2 = weight of can + sample before drying W1= weight of sample used W3= Weight of can + sample after drying. Ash Determination An empty crucible was fire polished in muffle furnace and allowed to cool in a desiccator for 20minutes and then weighed (w1).Two grams (2g) of the sample was weighed into the crucible (w2) and transferred into muffle furnace and heated at 5500 C until the sample was completely ashed. The crucible was then removed and a drop of water added to expose the ashed portion, the crucible was placed back in the muffle furnace and heated for 30 minutes. The crucible and its content were then removed and cooled in a desiccator and re-weighed (w3). The ash content was calculated as; % ash 100 Where, W1= weight of sample used W3= weight of sample +crucible after ashing W2= weight of crucible + sample before ashing Tiger nut milk Soy milk Tiger nut-Soy milk
- 4. International Journal of Trend in Scientific Research and Development @ www.ijtsrd.com eISSN: 2456-6470 @ IJTSRD | Unique Paper ID – IJTSRD47657 | Volume – 5 | Issue – 6 | Sep-Oct 2021 Page 1433 Crude fat determination A five hundred milliliter (500ml) round bottom flask was washed and dried in an oven and allowed to cool before weighing (W1). Five grams (5g) of the sample was weighed and wrapped in a thimble and its content inserted into the extraction column. About 350m of n- hexane was poured into the flask fitted into the extraction unit. The flask was heated at 600 C for 6 hours. The thimble was removed after extraction and the solvent salved by distillation. The flask and its content were placed in a water bath to evaporate the solvent. The content was cooled in a desiccator and weighed as (W2). The lipid content was calculated as; Total lipid= 100 Protein determination One gram (1g) of the sample was weighed and transferred into the Kjeidahl digestion flask followed by the addition of 3g of a mixture of sodium and copper sulphate. Anti-bumping chips were added to prevent sticking to the flask. The content was digested with 25ml of conc.H2SO4 and heating continued until the mixture became clear. The clear mixture was allowed to cool and the content made up to 100ml with distilled water from where 20ml was placed in a distillation flask. 50ml of 2% boric acid solution and few drops of methyl red indicator were added. After distillation, the distillate was titrated with 0.1N HCL. The protein content was calculated as follows; % nitrogen= Crude protein= %nitrogen 6.25 Crude fiber determination The defatted sample (2g) obtained during fat determination was air dried and transferred into a 250ml conical flask. 200ml of 1.25%H2SO4 was added and heated gently for 30minute. The flask was rotated every few minutes for uniformity. At the end of the 30minute boiling period, the acid mixture was allowed to stand for 1 minute and then filtered for 2minutes using a filter paper. The insoluble matter was washed back into the flask by means of wash bottle containing 1.25% NaOH and boiled for 30minute with the same precaution used in acid treatment. At the end of the 30minute boiling, the mixture was allowed to stand for 1minute and then filtered with a filter paper. The whole insoluble matter was washed with 1% HCl and finally with boiling ether and alcohol until it’s free from acid. The insoluble matter was transferred into a dried weighed crucible, oven dried at 1000 C to constant weight. The crucible and its content were ashed in a muffle furnace at 5500 C and re-weighed. The crude fiber was calculated as follows; % Crude fiber= 100 Determination of Total carbohydrate Carbohydrate was calculated by difference as described by FAO, (2003). % carbohydrate= 100- (%moisture + % ash +% crude protein + % crude fibre +% fat). Total energy estimation Energy was estimated (Kcal/g) by multiplying percentage crude protein, crude fat and carbohydrate by (4, 9 and 4 respectively) using the Atwater method as described by (FAO, 2003) Physicochemical analysis The pH of the samples was checked using the method of AOAC (2010). Titratable acidity was determined by the method described by Nielsen (2014). Total solids of the samples were determined by subtracting %moisture from 100. Determination of specific gravity This was determined by the gravimetric method described by AOAC (2010) using relative density bottle. Relative density bottles were washed with distilled water and dried in an oven at 1000 c for few minutes, cooled in a desiccator and weighed with stopper (W1). The bottles were filled with distilled water and re-weighed (W2). The water was poured out and the bottle dried in an oven. The bottles were filled with the Milk sample and weighed with stopper (W3). Specific gravity was calculated as a ratio of the weight of sample to weight of equal volume of water using the equation; Specific gravity= RESULTS AND DISCUSSION Sensory and organoleptic qualities of the milk blends Various milk blends were obtained from the mixture of the tiger nut and soy milk. The results for the sensory qualities of the milk blends are shown in Table 2. Sample A, D2 and E2 scored the highest at 8.000 while Sample B at 7.43 scored the least in colour. The high score in colour for Sample A, D2 and E2 may be due to them having the same white or off-white colour, and approximately the same consistency as cow's milk (Achla Bharti, 2019). While the uniformity in colour for all samples could be attributed to the same processing treatment. For Mouth feel, sample B and E2 share the same score of
- 5. International Journal of Trend in Scientific Research and Development @ www.ijtsrd.com eISSN: 2456-6470 @ IJTSRD | Unique Paper ID – IJTSRD47657 | Volume – 5 | Issue – 6 | Sep-Oct 2021 Page 1434 7.38, sample D1, D2 and E1 have the same score of 7.33 followed by sample A with 7.05 and C have the least score of 6.95. For taste, sample D1 have the highest score 7.19, followed by E2 with 6.86. For Flavour, sample E2 have the highest score 7.19 and C have the lowest at 5.57. In the overall acceptability, sample D1 have the highest score 7.67 followed by E2 7.43 while D2 and E1 have the same score 7.24 and sample C have the least score 6.38. There was no significant difference in taste, colour and mouth feel in the milk blends at P while there was a significant difference in flavor and overall acceptability of the milk blends with sample D1 been the best overall accepted. Many researchers applied individual response data from participants to assess whether consumers use flavour information when making purchase decisions of non-diary probiotic beverages (Caswell and Mojduszka, 1996) and found a positive correspondence. Taste as represented by flavour, aroma, and any other sensory characteristics may influence consumption of a product. If consumers find the taste acceptable or pleasant, they are likely to increase their budget share allocated for purchase of such product. Moon et al., (1999), stated that taste appears to be a positive attribute influencing consumers’ buying behavior. From Table 1, the mean scores for taste were 7.19 for sample D1 being the highest, 6.86 for sample E2 with sample C having the lowest value of 5.95. This means that the taste of all the products was well appreciated by the panelist. The mouth-feel is an attribute of the beverages to flow without forming lagging insoluble particles on the inner side of the containers. It refers to the property of the beverages to exhibit smoothness and good flow properties. According to Barnes et al., (1991), it had been found that, the mouth-feel of the products were important factors in a consumer’s purchasing decision. They also indicated that the mouth-feel concerns were for particular factor, especially the tactile sensation perceived in the oral cavity. A product with too low-fat contents coupled with too high carbohydrate content could result in a chalky texture while a product with too high fat content could also have an undesirable mouth-feel (Barnes et al., 1991; Lucey and Singh, 1997). Table 1: Sensory/Organoleptic Qualities of the Tiger Nut-Soy milk blends Samples Color Taste Flavor Mouth feel Overall acceptability A 8.00a ±0.89 6.24a ±2.14 6.81a ±1.54 7.05a ±1.83 6.81ab ±1.66 B 7.43a ±1.57 6.81a ±1.75 6.57ab ±1.72 7.38a ±1.20 7.14ab ±1.90 C 7.86a ±0.91 5.95a ±1.40 5.57b ±2.04 6.95a ±1.16 6.38b ±1.63 D1 7.76a ±1.26 7.19a ±1.72 6.85a ±1.50 7.33a ±1.32 7.67a ±1.35 D2 8.00a ±1.05 6.62a ±1.91 6.67ab ±1.74 7.33a ±1.11 7.24ab ±1.14 E1 7.90a ±0.94 6.71a ±1.79 6.55ab ±1.76 7.33a ±1.50 7.24ab ±1.37 E2 8.00a ±0.89 6.86a ±1.71 7.19a ±1.44 7.38a ±1.53 7.43ab ±1.43 Key: Means with different superscript along the column are significantly different at p<0.05 A=100% Soy milk, B=100% Tiger nut milk, C=50:50, D1=80% Tiger nut milk + 20% Soy milk D2=80% Soy milk +20% Tiger nut milk, E1=60% Tiger nut milk + 40% Soy milk, E2 =60% soy milk + 40% Tiger nut milk Proximate Properties of Tiger nut-Soy milk Blends The results for the proximate properties of the milk blends are shown in Table 2 and it showed that the milks are fairly rich in carbohydrate, protein and fat. The milk blends have Carbohydrate content ranging between 7.349 and 9.838 with sample D1 having the highest value. Sample D1 differs significantly at P<0.05 from other samples while Sample A, C, and E2 have no significant different from each other and B and E1 also do not differ significantly from each other. The high value of D1 shows that blending of two milks leads to increase in carbohydrate and this is in accordance with the work of Ade-Omowaye et al., (2008) that tiger nut contains high carbohydrate. The protein content ranges between 3.107 to 4.53 with sample D2 having the highest protein and this is in agreement with the work of Ikpeme-Emmanuel let al., (2012) who reported a progressive increase in protein with increase in Soy bean addition while developing a weaning food for infants using tiger nut and soy flour and Maduka and Ire (2018) who said that the low protein content of tiger nut milk can be improved by blending with other milks. The protein content in this research deviates from the work of Ukwuru et al., (2011) that protein increases with increase in tiger nut and is lower than that reported for Spanish tiger (8.45%) and African tiger nut (7.32%) and this could be due to the extraction method and variety used. However,the result was in agreement with the work of Udeozor (2012) that protein is highest in tiger nut-soy milk blend than tiger nut milk alone. It is also in accordance with the values stated by Meenal et al., (2018) whose protein ranges were 4.79%
- 6. International Journal of Trend in Scientific Research and Development @ www.ijtsrd.com eISSN: 2456-6470 @ IJTSRD | Unique Paper ID – IJTSRD47657 | Volume – 5 | Issue – 6 | Sep-Oct 2021 Page 1435 and 4.0% for their soymilk. Sample A and D2 differed significantly from the other samples at P 0.05. Tiger nut milk contains reasonable quantity of carbohydrate, fats and proteins required to meet daily human nutrition needs. The fat content of the sample blends ranges between 2.455 and 3.761 with D1 been the highest. Samples B, C, D1 and E1 differs significantly from Sample A, D2 and E2 at P 0.05 and this may be as a result of addition of greater quantity of tiger nut milk. The higher value could be attributed to the rich fat content of tiger nut (25.50%) as reported by Belewu and Abodurin (2006). The moisture content varied between 82.80 and 92.059. All the blends were found to be high in moisture and this makes them susceptible to microbial spoilage especially mold. The susceptibility of this milk to microbial spoilage could affect the safety and stability of the products; hence the product requires refrigeration for self- life extension. Sample D2 differs significantly from the other samples and this makes it more prone and susceptible to microbial spoilage. Ash indicates the measure of minerals in a food sample. The variation in ash content maybe due to variation in inorganic compounds especially ca+ present in milk extract of tiger nut and soy bean (Awonorin and Udeozor, 2014). The total ash content of each sample was lower than the 1.5% reported by Ukwuru et al., (2011) The total energy was highest in sample D1 (86.605) and lowest in A (70.047). This infers that total energy increases with increase in carbohydrate and fat. The total energy value of the milk is from the fat content. Hence, higher fat induces more total energy (Belewu and Belewu, 2007). Table 2: Proximate properties of Tiger-Soy milk blends Key: Means with different superscript along the column are significantly different at p<0.05 A=100% Soy milk, B=100% Tiger nut milk, C=50:50, D1=80% Tiger nut milk + 20% Soy milk, D2=80% Soy milk +20% Tiger nut milk, E1=60% Tiger nut milk + 40% Soy milk, E2 =60% soy milk + 40% Tiger nut milk Physico-chemical properties of the Tiger Nut-Soymilk Blends The physicochemical properties of the milk blends could be seen in Fig 2-5. The total solid increases with decrease in moisture i.e. the thicker the milk, the more the dissolved solid. This means that a reduction in moisture content results to an increase in nutrient composition and increase in the total solids of the milk. The total solids concentration of the sample ranges between 7.951 and 16.50 with B having the highest value and D2 the lowest. The nature of processing might have influenced the extractability of milk. Johnson and Snyder (1978) noted that heating of Soybean prior to grinding partially coagulates protein and keeps the protein bodies intact which in turn results in retention of more solids on the screen. Titratable acidity is used to determine the total acidity of milk, juice and vinegar. According to Nielsen (2014), the presence of organic acids in food determines its freshness and directly affects its flavor, color, stability and quality. He went further to say that this acidity can be natural to the food or developed through fermentation or added as part of a specific food formulation. The total titratable acidity of the milk samples ranges between 0.072 and 0.108 with sample A having the highest and this is within the range stated by Nielsen, (2014) that the total titratable acidity of milk is in the range of 0.12% to 0.16% with 0.14% been the average and any increase above 0.16% is an indication of increase of the presence of lactic acid bacteria. This is in agreement with Earlier work done by Makinde and Adebile (2018) on the influence of processing treatment on quality of vegetable milk from Almond which showed the titratable acidity to be in the range of 0.08% and 0.15%, Meenal et al. (2018) who worked on Soymilk and coconut blend with titratable acidity of (0.169%) and Ramesh et al., (2017) who worked on soymilk and apple custard blend Sample Carbohydrate (%) Protein (%) Fat (%) Moisture (%) Ash (%) Total Energy (kcal/g) A 7.49d ±0.30 4.52a ±0.20 2.46c ±0.20 85.06b ±2.00 0.49c ±0.00 70.05g ±0.05 B 8.69b ±0.30 3.11c ±0.11 3.73a ±0.20 83.50b ±2.00 0.98a ±0.01 80.72b ±0.20 C 7.54d ±0.40 3.87b ±0.10 3.47a ±0.10 84.39b ±2.00 0.73b ±0.02 76.88d ±0.11 D1 9.84a ±0.10 3.35c ±0.20 3.76a ±0.20 82.80b ±2.00 0.25d ±0.02 86.61a ±0.20 D2 7.94cd ±0.04 4.53a ±0.20 2.64c ±0.20 92.06a ±0.02 0.77b ±0.02 73.64e ±0.20 E1 8.25bc ±0.20 3.41c ±0.20 3.54a ±0.20 84.30b ±2.00 0.50c ±0.01 78.48c ±0.20 E2 7.35d ±0.30 3.47c ±0.20 3.02b ±0.02 85.93b ±2.00 0.24d ±0.02 70.41f ±0.20
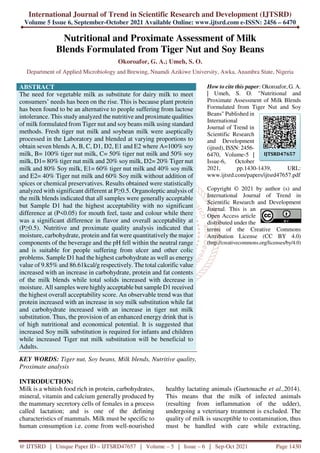
- 7. International Journal of Trend in Scientific Research and Development @ www.ijtsrd.com eISSN: 2456-6470 @ IJTSRD | Unique Paper ID – IJTSRD47657 | Volume – 5 | Issue – 6 | Sep-Oct 2021 Page 1436 with titratable acidity of (0.14%). The Titratable acidity of the samples was generally low while their pH remained within neutral range. This could be as a result of non-fermentation of the sample which could have otherwise reduce the pH and hence increase TTA. The pH of the milk blends ranges from 6.72 to 6.84 with Sample A 6.84 having the highest value followed by E2 6.82 and B 6.79 while C 6.72 have the least value and D1, D2 and E1 have same value 6.77. The sample values fell within the value reported by different researchers who combined soy milk to get consumable products (Belewu et al., 2010; Belewu and Abdodurin, 2006). The pH is also comparable to the pH of Melon seed milk (6.25) and Cowpea milk (6.79) reported by Akubor (1998) and Nnam (2003). The high pH of this blend shows that milk made from these blends will be acceptable to patients with ulcer and other related colic problems since its less acidic which is in agreement with Francis and Umeh (2021) who ascertain that tiger nut can serve as stimulant and tonic and can be used in treatment of diarrhea and dysentery. The specific gravity of the milk samples ranges from 0.98 and 1.02 with B and E1 having the highest values. The specific gravity of soymilk in this study was lower than that of Meenal et al., (2018) and Ramesh et al., (2017) which were 1.027 and 1.0624 respectively. Figure 2: Total solid of the samples Figure 3: Total titratable acidity of the Blends
- 8. International Journal of Trend in Scientific Research and Development @ www.ijtsrd.com eISSN: 2456-6470 @ IJTSRD | Unique Paper ID – IJTSRD47657 | Volume – 5 | Issue – 6 | Sep-Oct 2021 Page 1437 Figure 4: pH of the Blends Figure 5: Specific gravity of the Blends Conclusion Milk blends prepared from tiger nut and soybean could be used as beverage for both the young and old people due to its high nutrient contents (Protein, fat, carbohydrate and energy). Tiger nut and soy milk when blend were more acceptable compared to the individual milk and this indicates that utilization of tiger nut will be promoted when processed into milk. The results suggest that milk from tiger nut and soy bean be encouraged in Nigeria and Africa in general to help solve the problem of protein-calorie malnutrition as these beverages also possess almost similar properties as that of cow milk and are of cheap sources. Recommendation It is recommended that further studies be done on the best method of preservation and storage of this milk as well as packaging of the product. References [1] Achla Bharti (2019). "The Growth of Soy-Milk as a Dairy Alternative". Industry Europe, Focus Media Group Ltd. Retrieved 9 January 2020. [2] Adejuyitan, J. A. (2011). Tiger nut processing: its food uses and health benefits. American Journal of Food Technology, 6 (3):197–201 [3] Ade-Omowaye, B. O., Akinwande, B. A., Bolarinwa, I. F. and Adebiyi, A. O. (2008).
- 9. International Journal of Trend in Scientific Research and Development @ www.ijtsrd.com eISSN: 2456-6470 @ IJTSRD | Unique Paper ID – IJTSRD47657 | Volume – 5 | Issue – 6 | Sep-Oct 2021 Page 1438 Evaluation of tigernut (Cyperus esculentus)- wheat composite flour and bread. Africa Journal of Food Science; 2: 087-091. [4] Akubor, P. I. (1998). Physico-chemical and Sensory Characteristics of Melon seed milk. Journal of Food science and Technology; 35:93-95. [5] AOAC (2010). Official method of Analysis 18th edition. Published by AOAC international, Gaitherburg, Maryland, USA [6] Awonorin, S. O., Udeozor, L. O. (2014). Chemical Properties of Tiger nut-Soy Milk Extract. Journal of Enviromental Science, Toxicology and Food Technology; 8 (3):87-92. [7] Balogun, M. A., Arise, A. K., Kolawole, F. L., and Ijadinboyo, M. (2017). Effect of partial substitution of cow milk on the chemical composition, Acceptability and shelf-life of yoghurt. Annals. Food science and technology; 18 (1):21-32 [8] Barnes, D. L., Harper, S. J., Bodyfelt, F. W., McDaniel, M. (1991). Prediction of consumer acceptability of yoghurt by Sensory and Analytical measures of Sweetness and Sourness. Journal of Dairy Science; 74:3746- 3754 [9] Belewu, M. A and Abodunrin, O. A. (2006). Preparation of Kunnu from unexploited rich food source: [10] Belewu, M. A. and Belewu, K. Y. (2007). Comparative Physicochemical Evaluation of Tiger-nut, Soybean and Coconut Milk Sources. International Journal of Agriculture and Biology; 9:785-787. [11] Belewu, M. A., Belewu, K. Y and Bamidele, R. A. (2010). Cyper-coconut yoghurt: preparation, compositional and organoleptic qualities. African Journal of Food Science and Technology; 1(1): 010-012. [12] Caswell, J. A., and Mojduszka, E. M. (1996). Using informational labeling to influence the market for quality in food products. American Journal of Agricultural Economics: 78(5): 1248-1253. [13] Chien, J. T. and Synder, H. E. (1983). Detection and control of soymilk astringency. Journal of Food Science;48: 438-440 [14] Clara, G. and Helen Brigg (2019). "Climate change: Which vegan milk is best?". BBC News: Science and Environment. Retrieved 25 October 2019. [15] David, J. A., Arash, M., Korbua, S., Claire, E. B., Li Wang, Amanda, C., Shahad, A., John L. S., Cypril, W. C., Kendall, P. M. and Kris- Etherton (2010). Soy protein reduces serum cholesterol by both Intrinsic and food displacement mechanisms. The Journal of Nutrition; 140(2): 2302-2311 [16] Ejoh, R. A., and Ndjouenkeu, R. (2006). Characteristics of tigernut (Cyperus esculentus) tubers and their performance in the production of a milky drink. Journal of Food Processing and Preservation; 30(2):145-163. [17] FAO (2003). Food energy-methods of analysis and conversion factors. Paper No. 77, report of a technical workshop, December, 3-7 [18] Francis C. F. and Umeh S. O. (2021). Mashing Studies Using Tiger nut (Cyperus esculentus) Flour as Adjunct in Brewing. International Journal of Applied Chemical and Biological Sciences., 2 (5): 23 -29. [19] Guetouache, M., Guessas, B., and Medjekal, S. (2014). Composition and nutritional value of raw milk. Journal of Biological Sciences and Pharmaceutical Research; 2(10): 115-122. [20] Hashemi, S. M. B., Shahidi, F., Mortazavi, S. A., Milani, E., and Eshaghi, Z (2014). Potentially probiotic Lactobacillus strains from traditional Kurdish cheese. Probiotics and antimicrobial proteins; 6(1): 22-31. [21] Ikpeme-Emmanuel, C. A., Ekpeyoung, I. O. and Igile, G. O. (2012). Chemical and protein quality of soybean (Glycine max) and tigernut (Cyperus esculentus) Based Weaning Food. British Journal of Applied Science & Technology, 2(4): 356-366. [22] Iwe, M. O. (2010). Handbook of sensory methods and analysis. Enugu Nigeria rejoint communication science, ltd. Pp. 73-78 [23] Johnson, K. W. and Snyder, H. E. (1978). Soymilk: a comparison of processing methods on yields and composition. Journal of food Science; 43: 349-353 [24] Lucey, J., and Singh, H. (1997). Formation and physical properties of acid milk gels: a review. Food research international; 30 (7): 529-542. [25] Maduka, N. and Ire, F. S. (2018). Tigernut Plant and Useful Application of Tigernut Tubers (Cyperus esculentus)- A review.
- 10. International Journal of Trend in Scientific Research and Development @ www.ijtsrd.com eISSN: 2456-6470 @ IJTSRD | Unique Paper ID – IJTSRD47657 | Volume – 5 | Issue – 6 | Sep-Oct 2021 Page 1439 Current Journal of Applied Science and Technology; 29 (3): 1-23 [26] Mason D. (2008): Tiger Nuts In: http://www.nvsuk.org.uk/growing_show_veget ables_1/tigernut.php 2005. Accessed December, 2019. [27] Meenal, P. Desai, B. G., Burte, R. G., Dandekar, V. S. and Dhekale, J. S. (2018). Chemical composition of soy milk and coconut milk compare to goat milk fed to experimental kids. International Journal of Chemical Studies; 6(4): 111-114 [28] Moon, K. -Y., Kong, D., Lee, J. -K., Raychaudhuri, S., and Hurwitz, J. (1999). Identification and reconstitution of the origin recognition complex from Schizosaccharomyces pombe. Proceedings of the National Academy of Sciences; 96(22): 12367-12372. [29] Mordi, J. I., Ozumba, A. U., Elemo, G. N. and Olatunji, O. (2010). Physicochemical and Sensory Evaluation of Nigerian Tiger-Nut Extract Beverage. Bioscience Research Communuity; 4:(22) 203- 207 [30] Nielsen S. (2014). Food Analysis. Springer Science and business media, pp:602 [31] Nnam, N. M. (2003). Nutrient Composition and acceptability of Vegetable Milks made from Oilseeds. Journal of Home Economics Research; 5:57-61 [32] Omole, J. O. and Ighodaro, O. M. (2012). Proximate composition and quality attributes of milk substituted from Melon seeds (Citrulus vulgaris schrad). Report and Opinion; 4(9) [33] Ramesh, A., Vaibhav, P. and Navnath, S. (2017). Standardization and Physico-Chemical Properties of Custard Apple Soya Milk Shake. International Journal of Current Microbiology and Applied Sciences: 6(2): 1811-1817 [34] Sánchez-Zapata, E., Fernández-Lopez, J., and Pérez-Alvarez, J. A. (2012). Tigernut (Cyperus esculentus) commercialization: Health aspects, composition, properties and food Health aspects, composition, properties and food applications. Comprehensive Reviews of Food Science and Food Safety; 11:366-377. [35] Sung-young, P., Marsh, K. S., Jenny, Y. S., and Yun, S. E. (2000). A study on a processing method to improve soymilk quality. Proceedings of pre-congress internet conference, May 8, December 31, pp: 31-32. [36] Tiger nut (Cyperus esculentus). World Journal of Dairy and Food Sciences; 1: 19-21. [37] Udeozor, L. O. and Awonorin, S. O. (2014). Comparative Microbial analysis of storage of Tigernut-soy milk extract. Austin Journal of Nutrition and Food Science; 2(5): 1026-1030 [38] Udeozor, L. O (2012). Tiger Nut-Soy milk Drink: Preparation, Proximate Composition and Sensory Qualities. International Journal of Food and Nutrition Science; 1(4): 18-26 [39] Ukwuru, M. U., Ibeneme, C. L. and Agbo, G. I. (2011). New product development from tigernut (Cyperus esculentus) and their sensory, proximate and microbiological evaluation. Pakistan Journal of Nutrition; 10(2):101-105.