AHP technique a way to show preferences amongst alternatives

This article presents a review of the applications of Analytic Hierarchy Process (AHP). AHP is a multiple criteria decision-making tool that has been used in almost all the applications related with decision-making. Decisions involve many intangibles that need to be traded off. The Analytic Hierarchy Process (AHP) is a theory of measurement through pairwise comparisons and relies on the judgements of experts to derive priority scales. It is these scales that measure intangibles in relative terms. The comparisons are made using a scale of absolute judgements that represents how much more; one element dominates another with respect to a given attribute. The judgements may be inconsistent, and how to measure inconsistency and improve the judgements, when possible to obtain better consistency is a concern of the AHP. The derived priority scales are synthesised by multiplying them by the priority of their parent nodes and adding for all such nodes. An illustration is also included.

Recommended
Recommended
More Related Content
What's hot
What's hot (20)
Viewers also liked
Similar to AHP technique a way to show preferences amongst alternatives
Similar to AHP technique a way to show preferences amongst alternatives (20)
More from ijsrd.com
More from ijsrd.com (20)
Recently uploaded
Recently uploaded (20)
AHP technique a way to show preferences amongst alternatives
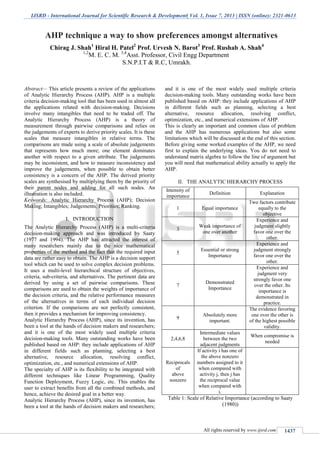
- 1. IJSRD - International Journal for Scientific Research & Development| Vol. 1, Issue 7, 2013 | ISSN (online): 2321-0613 All rights reserved by www.ijsrd.com 1437 Abstract— This article presents a review of the applications of Analytic Hierarchy Process (AHP). AHP is a multiple criteria decision-making tool that has been used in almost all the applications related with decision-making. Decisions involve many intangibles that need to be traded off. The Analytic Hierarchy Process (AHP) is a theory of measurement through pairwise comparisons and relies on the judgements of experts to derive priority scales. It is these scales that measure intangibles in relative terms. The comparisons are made using a scale of absolute judgements that represents how much more; one element dominates another with respect to a given attribute. The judgements may be inconsistent, and how to measure inconsistency and improve the judgements, when possible to obtain better consistency is a concern of the AHP. The derived priority scales are synthesised by multiplying them by the priority of their parent nodes and adding for all such nodes. An illustration is also included. Keywords: Analytic Hierarchy Process (AHP); Decision Making; Intangibles; Judgements; Priorities; Ranking. INTRODUCTIONI. The Analytic Hierarchy Process (AHP) is a multi-criteria decision-making approach and was introduced by Saaty (1977 and 1994). The AHP has attracted the interest of many researchers mainly due to the nice mathematical properties of the method and the fact that the required input data are rather easy to obtain. The AHP is a decision support tool which can be used to solve complex decision problems. It uses a multi-level hierarchical structure of objectives, criteria, sub-criteria, and alternatives. The pertinent data are derived by using a set of pairwise comparisons. These comparisons are used to obtain the weights of importance of the decision criteria, and the relative performance measures of the alternatives in terms of each individual decision criterion. If the comparisons are not perfectly consistent, then it provides a mechanism for improving consistency. Analytic Hierarchy Process (AHP), since its invention, has been a tool at the hands of decision makers and researchers; and it is one of the most widely used multiple criteria decision-making tools. Many outstanding works have been published based on AHP: they include applications of AHP in different fields such as planning, selecting a best alternative, resource allocation, resolving conflict, optimization, etc., and numerical extensions of AHP. The specialty of AHP is its flexibility to be integrated with different techniques like Linear Programming, Quality Function Deployment, Fuzzy Logic, etc. This enables the user to extract benefits from all the combined methods, and hence, achieve the desired goal in a better way. Analytic Hierarchy Process (AHP), since its invention, has been a tool at the hands of decision makers and researchers; and it is one of the most widely used multiple criteria decision-making tools. Many outstanding works have been published based on AHP: they include applications of AHP in different fields such as planning, selecting a best alternative, resource allocation, resolving conflict, optimization, etc., and numerical extensions of AHP. This is clearly an important and common class of problem and the AHP has numerous applications but also some limitations which will be discussed at the end of this section. Before giving some worked examples of the AHP, we need first to explain the underlying ideas. You do not need to understand matrix algebra to follow the line of argument but you will need that mathematical ability actually to apply the AHP. THE ANALYTIC HIERARCHY PROCESSII. Intensity of importance Definition Explanation 1 Equal importance Two factors contribute equally to the objective 3 Weak importance of one over another Experience and judgment slightly favor one over the other. 5 Essential or strong Importance Experience and judgment strongly favor one over the other. 7 Demonstrated Importance Experience and judgment very strongly favor one over the other. Its importance is demonstrated in practice. 9 Absolutely more important. The evidence favoring one over the other is of the highest possible validity. 2,4,6,8 Intermediate values between the two adjacent judgments When compromise is needed Reciprocals of above nonzero If activity i has one of the above nonzero numbers assigned to it when compared with activity j, then j has the reciprocal value when compared with i. Table 1: Scale of Relative Importance (according to Saaty (1980)) AHP technique a way to show preferences amongst alternatives Chirag J. Shah1 Hiral H. Patel2 Prof. Urvesh N. Barot3 Prof. Rushab A. Shah4 1,2 M. E. C. M. 3,4 Asst. Professor, Civil Engg Department S.N.P.I.T & R.C, Umrakh.
- 2. AHP technique a way to show preferences amongst alternatives (IJSRD/Vol. 1/Issue 7/2013/0015) All rights reserved by www.ijsrd.com 1438 Analytic Hierarchy Process is a multiple criteria decision- making tool. This is an Eigen value approach to the pair- wise comparisons. It also provides a methodology to calibrate the numeric scale for the measurement of quantitative as well as qualitative performances. The scale ranges from 1/9 for “least valued than”, to 1 for “equal” and to 9 for “absolutely more important than” covering the entire spectrum of the comparison. Some key and basic steps involved in this methodology are: 1 State the problem. 2 Broaden the objectives of the problem or consider all actors, objectives and its outcome. 3 Identify the criteria that influence the behaviour. 4 Structure the problem in a hierarchy of different levels constituting goal, criteria, sub-criteria and alternatives. 5 Compare each element in the corresponding level and calibrate them on the numerical scale. This requires n*(n-1)/2 comparisons, where n is the number of elements with the considerations that diagonal elements are equal or “1” and the other elements will simply be the reciprocals of the earlier comparisons. 6 Perform calculations to find the maximum Eigen value, consistency index CI, consistency ratio CR, and normalized values for each criteria/ alternative. 7 If the maximum Eigen value, CI, and CR are satisfactory then decision is taken based on the normalized values; else the procedure is repeated till these values lie in a desired range. AHP helps to incorporate a group consensus. Generally this consists of a questionnaire for comparison of each element and geometric mean to arrive at a final solution. The AHP and its use of pairwise comparisons have inspired the creation of many other decision-making methods. Besides its wide acceptance, it also created some considerable criticism; both for theoretical and for practical reasons. Since the early days it became apparent that there are some problems with the way pairwise comparisons are used and the way the AHP evaluates alternatives. First, Belton and Gear (1983) observed that the AHP may reverse the ranking of the alternatives when an alternative identical to one of the already existing alternatives is introduced. In order to overcome this deficiency, Belton and Gear proposed that each column of the AHP decision matrix to be divided by the maximum entry of that column. Thus, they introduced a variant of the original AHP, called the revised- AHP. Later, Saaty (1994) accepted the previous variant of the AHP and now it is called the Ideal Mode AHP. Besides the revised AHP, other authors also introduced other variants of the original AHP. However, the AHP (in the original or in the ideal mode) is the most widely accepted method and is considered by many as the most reliable method. The fact that rank reversal also occurs in the AHP when near copies are considered, has also been studied by Dyer and Wendell (1985). Saaty (1983a and 1987) provided some axioms and guidelines on how close a near copy can be to an original alternative without causing a rank reversal. He suggested that the decision maker has to eliminate alternatives from consideration that score within 10 percent of another alternative. This recommendation was later sharply criticized by Dyer (1990). The first step in the AHP is the estimation of the pertinent data. That is, the estimation of the aij and Wj values of the decision matrix. This is described in the next sub-section. The Use of Pairwise ComparisonsA. One of the most crucial steps in many decision-making methods is the accurate estimation of the pertinent data. This is a problem not bound in the AHP method only, but it is crucial in many other methods which need to elicit qualitative information from the decision-maker. Very often qualitative data cannot be known in terms of absolute values. For instance “Selection of a new car" although information about questions are vital in making the correct decision, it is very difficult, if not impossible, to quantify them correctly. Therefore, many decision-making methods attempt to determine the relative importance, or weight, of the alternatives in terms of each criterion involved in a given decision-making problem. An approach based on pairwise comparisons which was proposed by Saaty (1980) has long attracted the interest of many researchers. Pairwise comparisons are used to determine the relative importance of each alternative in terms of each criterion. In this approach the decision-maker has to express his opinion about the value of one single pairwise comparison at a time. Usually, the decision-maker has to choose his answer among discrete choices. Each choice is a linguistic phrase. Some examples of such linguistic phrases are: "A is more important than B", or "A is of the same importance as B", or "A is a little more important than B", and so on (see also table 1). The main problem with the pairwise comparisons is how to quantify the linguistic choices selected by the decision maker during their evaluation. All the methods which use the pairwise comparisons approach eventually express the qualitative answers of a decision maker into some numbers which, most of the time, are ratios of integers. A case in which pairwise comparisons are expressed as differences (instead of ratios) was used to define similarity relations and is described by Triantaphyllou (1993). The following paragraphs examine the issue of quantifying pairwise comparisons. Since pairwise comparisons are the keystone of these decision-making processes, correctly quantifying them is the most crucial step in multi-criteria decision- making methods which use qualitative data. Pairwise comparisons are quantified by using a scale. Such a scale is a one-to-one mapping between the set of discrete linguistic choices available to the decision maker and a discrete set of numbers which represent the importance, or weight, of the previous linguistic choices. The scale proposed by Saaty is depicted in table 1. Other scales have also been proposed by others. An evaluation of 78 different scales appears in Triantaphyllou et al. (1994). All the alternative scales depart from some psychological theories and develop the numbers to be used based on these psychological theories. In 1846 Weber stated his law regarding a stimulus of measurable magnitude. According to his law a change in sensation is noticed if the stimulus is increased by a constant percentage of the stimulus itself (Saaty, 1980). That is,
- 3. AHP technique a way to show preferences amongst alternatives (IJSRD/Vol. 1/Issue 7/2013/0015) All rights reserved by www.ijsrd.com 1439 people are unable to make choices from an infinite set. For example, people cannot distinguish between two very close values of importance, say 3.00 and 3.02. Psychological experiments have also shown that individuals cannot simultaneously compare more than seven objects (plus or minus two) (Miller, 1956). This is the main reasoning used by Saaty to establish 9 as the upper limit of his scale, 1 as the lower limit and a unit difference between successive scale values. The values of the pairwise comparisons in the AHP are determined according to the scale introduced by Saaty (1980). According to this scale, the available values for the pairwise comparisons are members of the set: {9, 8, 7, 6, 5, 4, 3, 2, 1, 1/2, 1/3, 1/4, 1/5, 1/6, 1/7, 1/8, 1/9} (see also table 1). As an illustrative example consider the following situation. Suppose that in the previous example of selecting a new car, there are three Criteria’s and four alternatives as shown below in figure. Fig. 1: Criteria and objectives for buying a car Suppose Reliability is 2 times as important as Style, Reliability is 4 times as important as Fuel Economy, Style is 3 times as important as Fuel Economy. Suppose that following is the judgment matrix when the four criteria’s configurations are examined. Criterion A- Style B- Reliability C-Fuel Economy Eigen Vector A-Style 1 1/2 3 0.3202 B- Reliability 2 1 4 0.5571 C-Fuel Economy 1/3 1/4 1 0.1226 Table. 2: criterion The next step is to extract the relative importance implied by the previous comparisons. That is, how important are the three criteria’s when they are considered in terms of the criterion? Saaty asserts that to answer this question one has to estimate the right principal eigenvector of the previous matrix. Given a judgment matrix with pairwise comparisons, the corresponding maximum left eigenvector is approximated by using the geometric mean of each row. That is, the elements in each row are multiplied with each other and then the nth root is taken (where n is the number of elements in the row). Next the numbers are normalized by dividing them with their sum. Hence, for the previous matrix the corresponding priority vector is: (0.3196, 0.5584, 0.1220). This means Style is second most important criterion, Reliability is the most important criterion and Fuel Economy is the least important criterion. However, perfect consistency rarely occurs in practice. In the AHP the pairwise comparisons in a judgment matrix are considered to be adequately consistent if the corresponding consistency ratio (CR) is less than 10% (Saaty, 1980). The CR coefficient is calculated as follows. First, the consistency index (CI) needs to be estimated. This is done by adding the columns in the judgment matrix and multiplies the resulting vector by the vector of priorities (i.e., the approximated eigenvector) obtained earlier. This yields an approximation of the maximum eigenvalue, denoted by λmax. Then, the CI value is calculated by using the formula: CI = (λmax - n) / (n - 1). Next the consistency ratio CR is obtained by dividing the CI value by the Random Consistency index (RCI) as given in table 3. When these approximations are applied to the previous judgment matrix it can be verified that the following are derived: λmax = 3.02, CI = 0.012 and CR = 0.0201. If the CR value is greater than 0.10, then it is a good idea to study the problem further and re-evaluate the pairwise comparisons. N 1 2 3 4 5 6 7 8 9 R CI 0 0 0.5 8 0.9 0 1.1 2 1.2 4 1.3 2 1.4 1 1 . 4 5 Table. 3: RCI values for different values of n. After the alternatives are compared with each other in terms of each one of the decision criteria and the individual priority vectors are derived, the synthesis step is taken. The priority vectors become the columns of the decision matrix (not to be confused with the judgment matrices with the pairwise comparisons). The weights of importance of the criteria are also determined by using pairwise comparisons. Therefore, if a problem has M alternatives and N criteria, then the decision maker is required to construct N judgment matrices (one for each criterion) of order MxM and one judgment matrix of order NxN (for the N criteria). Finally, given a decision matrix the final priorities, denoted by Ai AHP, of the alternatives in terms of all the criteria combined are determined according to the following formula (1). Recall that in the case of the ideal mode AHP the columns of the decision matrix are normalized by dividing by the largest entry in each column. The entire above are further illustrated in terms of a numerical example. The numerical data for this example were adapted from an example given in (Saaty, 1983b). A Numerical ExampleB. Suppose that the four alternative for selection of a new car described earlier need to be evaluated in terms of the three decision criteria: Style, Reliability and Fuel Economy. If more criteria are required to be considered, then this example can be expanded accordingly. Suppose that the following matrices represent the corresponding judgment matrices with the pairwise comparisons. Note that the
- 4. AHP technique a way to show preferences amongst alternatives (IJSRD/Vol. 1/Issue 7/2013/0015) All rights reserved by www.ijsrd.com 1440 corresponding priority vectors (for the individual criteria) and the consistency coefficients are given as well. Style Civic Saturn Escort Clio Eigen Vector Civic 1 1/4 4 1/6 0.1308 Saturn 4 1 4 1/4 0.2444 Escort 1/4 1/4 1 1/5 0.0657 Clio 6 4 5 1 0.5590 Table. 3: consistency coefficients λmax = 4.639, CI = 0.2131, and CR = 0.2368. As stated earlier, AHP can combine both qualitative and quantitative information, Fuel economy information is obtained for each alternative CAR FUEL ECONOMY (MILES/GALLON) Priority Vector Civic 34 34/113 0.3010 Saturn 27 27/113 0.2390 Escort 24 24/113 0.2120 Clio 28 28/113 0.2480 TOTAL 113 1.000 Table 4: Fuel economy information is obtained for each alternative Fig. 2: tree with all the weights As it was mentioned earlier, the previous priority vectors are used to form the entries of the decision matrix for this problem. The decision matrix and the resulted final priorities (which are calculated according to formula (1)) are as follows: Alt. Style Reliability Fuel Economy Final Priority 0.3196 0.5584 0.1220 Civic 0.1160 0.3790 0.3010 0.3060 Saturn 0.2470 0.2900 0.2390 0.2720 Escort 0.0600 0.0740 0.2120 0.0940 Clio 0.5770 0.2570 0.2480 0.3280 Table. 5: Decision Matrix and Solution when AHP is used: Criterion Therefore, the best car is Clio followed by Civic which is followed Saturn and lastly Escort. SAMPLE SIZE CALCULATIONIII. (Source: Journal of Management in Engineering, January 4, 2013) According to the targeted City the total no. of available population is calculated which comprises different communities. To obtain statistically representative sample size of the population following equation used which is given by Hogg and Tanis, (2009): Where n, m and N represents the sample size of limited, unlimited and available population respectively. m is calculated by following equation. Where z= the statistic value for the confidence level used, i.e. 1.96 and 1.645 for 95% and 90% confidence level respectively; p= the value of population that estimated and e= the sampling error to estimated. Because the value of p is unknown Sinich et al. (2002) suggest the value 0.5 to be used in sample size. APPLICATIONIV. AHP can be used for a wide variety of applications such as: Strategic planning, Resource allocation, Source selection, Business/public policy program selection and much more. It is widely used for decision making. As far as the area of application is concerned, most of the times AHP has been used in engineering, personal and social categories. This should help researcher judge the applicability of AHP in their area of interest. Decision situations to which the AHP can be applied include: 1 Choice - the selection of one alternative from a given set of alternatives, usually where there are multiple decision criteria involved. 2 Ranking - putting a set of alternatives in order from most to least desirable. 3 Prioritization - determining the relative merit of members of a set of alternatives, as opposed to selecting a single one or merely ranking them. 4 Resource allocation - Apportioning resources among a set of alternatives. 5 Benchmarking - Comparing the processes in one's own organization with those of other best-of-breed organizations. 6 Quality management - Dealing with the multidimensional aspects of quality and quality improvement. 7 Conflict resolution - Settling disputes between parties with apparently incompatible goals or positions BENEFITSV. 1 The main advantage of the AHP is its ability to rank choices in the order of their effectiveness in meeting conflicting objectives. 2 The further strength of the AHP is its ability to detect inconsistent judgements. 3 It illustrates how possible changes in priority at upper levels have an effect on the priority of criteria at lower levels. 4 It provides the buyer with an overview of criteria, their function at the lower levels and goals as at the higher levels
- 5. AHP technique a way to show preferences amongst alternatives (IJSRD/Vol. 1/Issue 7/2013/0015) All rights reserved by www.ijsrd.com 1441 5 The method is able to rank criteria according to the needs of the buyer which also leads to more precise decisions concerning supplier selection. LIMITATIONSVI. 1 The limitations of the AHP are that it only works because the matrices are all of the same mathematical form – known as a positive reciprocal matrix. 2 The other seeming drawback is that if the scale is changed from 1 to 9 to, say, 1 to 29, the numbers in the end result, which we called the Value for Money Vector, will also change. In many ways, that does not matter as the VFM (not to be confused with the Viable Final Matrix) simply says that something is relatively better than another at meeting some objective. 3 In short, the AHP is a useful technique for discriminating between competing options in the light of a range of objectives to be met. The calculations are not complex and, while the AHP relies on what might be seen as a mathematical trick, you don’t need to understand the maths to use the technique. Do, though, be aware that it only shows relative value for money. CONCLUSIONVII. 1 An attempt has been made in this paper to review and critically analyse the Analytic Hierarchy Process as a developed decision making tool. It is observed that AHP is being predominantly used in the theme area of selection and evaluation. 2 The AHP provides a convenient approach for solving complex problems in engineering. It should be noted that there is a software package, called Expert Choice (1990), which has significantly contributed to the wide acceptance of the AHP methodology. There is sufficient evidence to suggest that the recommendations made the AHP should not be taken literally. In matter of fact, the closer the final priority values are with each other, the more careful the user should be. 3 The examples in this paper strongly suggest that when some alternatives appear to be very close with each other, then the decision-maker needs to be very cautious. An apparent remedy is to try to consider additional decision criteria which, hopefully, can assist in drastically discriminating among the alternatives. The above observations suggest that this method should be used as decision support tools and not as the means for deriving the final answer. To find the truly best solution to a problem may never be humanly possible. The conclusions of the solution should be taken lightly and used only as indications to what may be the best answer. Although the search for finding the best method may never end, research in this area of decision-making is still critical and very valuable in many scientific and engineering applications. ACKNOWLEDGMENT The authors are thankfully acknowledge to Mr. J. N. Patel, Chairman Vidyabharti Trust, Mr. K. N. Patel, Hon. Secretary, Vidyabharti Trust, Dr. H. R. Patel, Director, Dr. J. A. Shah, Principal, S.N.P.I.T. & R.C., Umrakh, Bardoli, Gujarat, India for their motivational & infrastructural supports to carry out this research, Dr. Neeraj D. Sharma, HOD Civil Department, SNPIT & RC, Umrakh and lastly Mr. Bhavik K. Daxini, Assistant Professor, Marwadi College, Rajkot. REFERENCES [1] Azeem Ahmad, Magnus Goransson, Aamir Shahzad Limitations of the Analytic Hierarchy Process Technique with Respect to Geographically Distributed Stakeholders World Academy of Science, Engineering and Technology 45 2010. [2] Belton, V. And Gear, T. (1983). On a Short-coming of Saaty's Method of Analytic Hierarchies. Omega, 228-230. [3] Dyer, J.S. (1990). Remarks on the Analytic Hierarchy Process, Management Science, 36: 249-258. [4] Evangelos Triantaphyllou and Stuart H. Mann, Using The Analytic Hierarchy Process For Decision Making In Engineering Applications: Some Challenges, Inter’l Journal of Industrial Engineering: Applications and Practice, Vol. 2, No. 1, pp. 35-44, 1995. [5] M.E. Qureshi S.R. Harrison Application of the Analytic Hierarchy Process to Riparian Revegetation Policy Options Small-scale Forest Economics, Management and Policy, 2(3): 441-458, 2003. [6] Omk arprasad S. Vaidya a, 1, Sushil Kumar b,* Analytic hierarchy process: An overview of applications European Journal of Operational Research 169 (2006) 1–29. [7] Thomas L. Saaty (1977). A Scaling Method for Priorities in Hierarchical Structures, Journal of Mathematical Psychology, 15: 57-68. [8] Thomas L. Saaty, Decision making with the analytic hierarchy process Int. J. Services Sciences, Vol. 1, No. 1, 2008 [9] Thomas L. Saaty (1980). The Analytic Hierarchy Process. McGraw-Hill International, New York, NY, U.S.A. [10] Wabalickis, R.N. (1988). Justification of FMS with the Analytic Hierarchy Process. Journal of Manufacturing Systems, 17: 175-182. [11] Wang, L., and Raz, T. (1991). Analytic Hierarchy Process Based on Data Flow Problem. Computers & IE, 20: 355-365.