Extract the ancient letters from decorated
•
0 likes•93 views

Nowadays, large databases of ornaments of the hand-press period are available and need efficient retrieval tools for history specialists and general users. This article deals with document images analysis. The purpose of our work is to automatically determine the letter represented in an ornamental letter image. Our process is divided into two parts: Wavelet transformation: Segmentation of the ornamental letter followed by a recognition step. The segmentation process uses multi-resolution analysis to filter background decorations followed by binarisation and morphologic reconstruction of the expected letter.

Recommended
Recommended
More Related Content
What's hot
What's hot (19)
Viewers also liked
Viewers also liked (20)
Similar to Extract the ancient letters from decorated
Similar to Extract the ancient letters from decorated (20)
Recently uploaded
Recently uploaded (20)
Extract the ancient letters from decorated
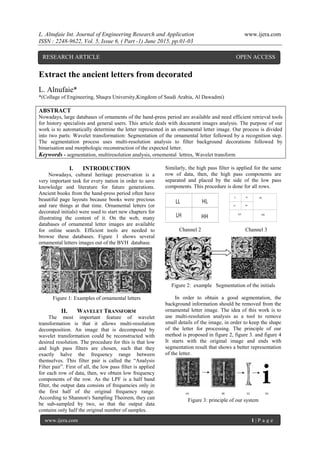
- 1. L. Alnufaie Int. Journal of Engineering Research and Application www.ijera.com ISSN : 2248-9622, Vol. 5, Issue 6, ( Part -1) June 2015, pp.01-03 www.ijera.com 1 | P a g e Extract the ancient letters from decorated L. Alnufaie* *(Collage of Engineering, Shaqra University,Kingdom of Saudi Arabia, Al Dawadmi) ABSTRACT Nowadays, large databases of ornaments of the hand-press period are available and need efficient retrieval tools for history specialists and general users. This article deals with document images analysis. The purpose of our work is to automatically determine the letter represented in an ornamental letter image. Our process is divided into two parts: Wavelet transformation: Segmentation of the ornamental letter followed by a recognition step. The segmentation process uses multi-resolution analysis to filter background decorations followed by binarisation and morphologic reconstruction of the expected letter. Keywords - segmentation, multiresolution analysis, ornemental lettres, Wavelet transform I. INTRODUCTION Nowadays, cultural heritage preservation is a very important task for every nation in order to save knowledge and literature for future generations. Ancient books from the hand-press period often have beautiful page layouts because books were precious and rare things at that time. Ornamental letters (or decorated initials) were used to start new chapters for illustrating the content of it. On the web, many databases of ornamental letter images are available for online search. Efficient tools are needed to browse these databases. Figure 1 shows several ornamental letters images out of the BVH database. Figure 1: Examples of ornamental letters II. WAVELET TRANSFORM The most important feature of wavelet transformation is that it allows multi-resolution decomposition. An image that is decomposed by wavelet transformation could be reconstructed with desired resolution. The procedure for this is that low and high pass filters are chosen, such that they exactly halve the frequency range between themselves. This filter pair is called the “Analysis Filter pair”. First of all, the low pass filter is applied for each row of data, then, we obtain low frequency components of the row. As the LPF is a half band filter, the output data consists of frequencies only in the first half of the original frequency range. According to Shannon's Sampling Theorem, they can be sub-sampled by two, so that the output data contains only half the original number of samples. Similarly, the high pass filter is applied for the same row of data, then, the high pass components are separated and placed by the side of the low pass components. This procedure is done for all rows. Channel 2 Channel 3 Figure 2: example Segmentation of the initials In order to obtain a good segmentation, the background information should be removed from the ornamental letter image. The idea of this work is to use multi-resolution analysis as a tool to remove small details of the image, in order to keep the shape of the letter for processing. The principle of our method is proposed in figure 2, figure 3. and figure 4 It starts with the original image and ends with segmentation result that shows a better representation of the letter. Figure 3: principle of our system RESEARCH ARTICLE OPEN ACCESS
- 2. L. Alnufaie Int. Journal of Engineering Research and Application www.ijera.com ISSN : 2248-9622, Vol. 5, Issue 6, ( Part -1) June 2015, pp.01-03 www.ijera.com 2 | P a g e Our method uses an integer lifting scheme algorithm to decompose the original image (defined at scale s = 0) at multiple scales. This method was proposed by Calderbank at al. The Haar wavelets S- transform was used in our method at scale s = 1 because it is easy to compute and sufficient for cutting unimportant details of the background of the ornamental letter image. After this lifting scheme decomposition, details are set to zero value and the approximation of the obtained image is used alone for reconstruction at scale s = 0 (original size of the ornamental letter image). An example of this process is proposed on Figure 4. Figure 4: Principal of our work and simulation III. BINARIZATION The aim of binarization is to keep most of the letter pixels while removing most of the decoration pixels. Thanks to the Otsu algorithm. Under the hypothesis that the image histogram can be expressed as the sum of two Gaussians, the histogram is divided in two classes. The inter-class variance is then minimized. An example of the Otsu thresholding is given in figure 5. the raw Otsu binarization keeps too much pixels in the decoration area. We thus modify the algorithm in order to “o” set the threshold. The “o” set T is a relative value computed as follows : Figure 5: An original image, its integer lifting Scheme decomposition at s=2 and the reconstructed image without details at scale s=0. IV. WORK AND SIMULATIONS We have reproduced the histogram and we chose several different levels to find what threshold shift allowed good Cleaning without losing a piece of the letter, for channel 2 and for channel 3. The ideal is to find a common threshold (seuil) shift all treated initials. A histogram is a statistical graph to represent the distribution of the pixel intensities of an image, that is to say the number of pixels for each lightintensity. By convention, a histogram represents the level of intensity x-axis going from darker (left) to lightest (right).Thus the histogram of an image in 256 gray levels is represented by a graph 256 having abscissa values, and the number of pixels Image ordinate. Take for example the following image to grayscale. This drop cap to the low gray level has the following characteristics: - The chain 2: if the difference is less than 60%, there are still tasks white visible then enough for a 80% offset, tasks are longer present but a part of the letter C as. The ideal shift seems be a value between 50% and 60% as white spots are almost non-existent and the letter C is almost intact. For channel 3: whatever the shift, there is no white spots but the letter C is not completely reformed. For the most threshold shift low (40%), it was the best obtaining latter C. Figure 6: latter (C) with histogram A histogram is a statistical graph to represent the distribution of the pixel intensities of an image, that is to say the number of pixels for each light intensity. By convention, a histogram represents the level of intensity x-axis going from darker (left) to lightest (right).The histogram of an image in 256 gray levels is represented by a graph 256 having abscissa values, and the number of pixels Image ordinate. Take for example the following image to grayscale Figure 6. This drop cap to the low gray level has the following characteristics: -for the chain 2: if the difference is less than 60%, there are still tasks white visible then enough for a 80% offset, tasks are longer present but a part of the letter C . The ideal shift seems to be a value between 50% and 60% as white spots are almost non-existent and the letter C is almost intact, Table Results of Channel 2, Channel 3 - For channel 3: whatever the shift, there is no white spots but the letter C is not completely reformed. For the most threshold shift low (40%), it was the best obtaining C.
- 3. L. Alnufaie Int. Journal of Engineering Research and Application www.ijera.com ISSN : 2248-9622, Vol. 5, Issue 6, ( Part -1) June 2015, pp.01-03 www.ijera.com 3 | P a g e Table: Results of Channel 2, Channel 3 Shift of Seuil Value of Seuil channel 2 channel 3 40% 205 50% 213 60% 221 70% 229 80% 237 V. CONCLUSION In this article, an original method segmentation method for ornamental lettershas been proposed. This method consists in a coarse to fine segmentation with progressive improvements. The atomic step of the process is composed of a modified Otsu binarization, followed by a selection of the biggest onnected component. This image represents the seed of a morphological reconstruction. Our multiresolution approach offers a very good separation of letter information and decoration information. The Results are very good even on difficult images composed of many decorations of various sizes which are the most difficult images to process in such kind of image analysis problems. REFERENCES [1] J. Zhang and J. Hu, Image, Segmentation Based on 2D Otsu Method with Histogram Analysis, International Conference on Computer Science and Software Engineering, IEEE 2008. [2] W. Hongzhi and D. Ying, An Improved Image Segmentation Algorithm Based on Otsu Method, International Symposium on Photoelectronic Detection and Imaging 2007, Related Technologies and Applications, ( 6625), 2008. [3] J. Roerdink and Arnold Meijster, The Watershed Transform: De_nitions, Algorithms and Parallelization Strategies Fundamenta Informaticae (IOS Press, 2001). [4] R. Gonzalez and R. Woods, Digital Image Processing, (Third edition, PHI publication, 2008). [5] J.-Y. Ramel and S. Leriche. Segmentation en analyse interactives de documents anciens imprimés. Traitement du Signal, 22(3),2005, 209–222 [6] S. Uttama, J.-M. Ogier, and P. Loonis, Top- down segmentation of ancient graphical drop caps, lettrines, In Proceedings of 6th IAPR International Workshop on Graphics Recognition, HongKong, pages 87–96, August 2005. [7] E. Baudrier, F. Nicolier, G. Millon, and S. Ruan. Binaryimage comparison with local- dissimilarity quantification.Pattern Recognition, 41(5), 2008, 1461–1478,. [8] K. Ersahin, I. Cumming, and R. Ward, Segmentation and classification of polarimetric SAR data using spectral graph partitioning, IEEE Trans. Geos. Remote Sens, 48(1), 2010, 164-174 [9] N. Senthilkumaran and R. Rajesh, Edge Detection Techniques for Image Segmentation – A Survey of Soft Computing Approaches, International Journal of Recent Trends in Engineering, 2(1), 2009. [10] J.-M. Ogier and K. Tombre. Madonne, Document image analysis techniques for cultural heritage documents. In International Conference on Digital Cultural Heritage, 2006. [11] J. Ramel, S. Leriche, M.-L. Demonet, and S. Busson. Userdriven page layout analysis of historical printed books. International Journal on Document Analysis and Recognition (IJDAR), 9(2–4), 2007, 243– 267. [12] N. Salman, Image Segmentation Based on Watershed and Edge Detection Techniques, The International Arab Journal of Information Technology, 2(3), 2006. [13] I. Patel and S. Garg, Robust Face Detection using Fusion of Haar and Daubechies Orthogonal Wavelet Template, International Journal of Computer Applications, 46(6), 2012,38-44. [14] I. Patel and R. Patel,Robust Face Recognition Using Distance Matrice, International Journal of Computer and Electrical Engineering, 5( 4), 2013, 401- 404. [15] D. Saraf, D. Sisodia, A. Sinhal and N. Gupta , Comparisons of wavelets based image compression methods, World Journal of Science and Technology, 2(3)2012, 2231 – 2587