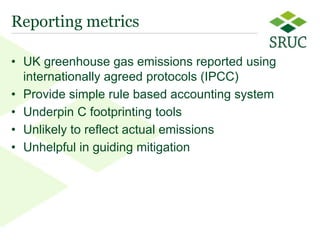
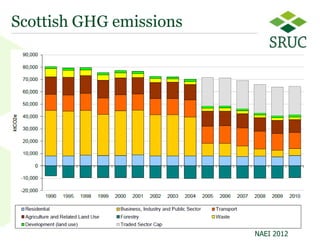
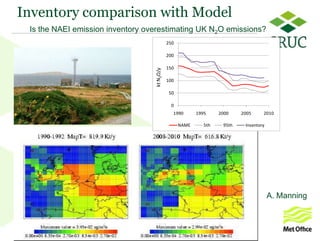
1) Current greenhouse gas emission reporting methods provide simple estimates that may not accurately reflect actual emissions and do not help guide mitigation.
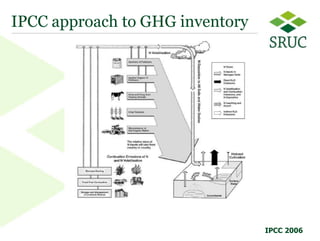
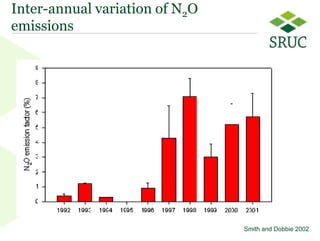
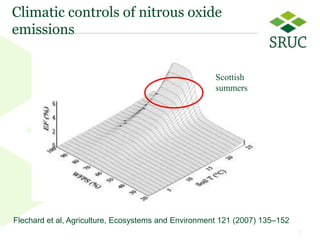
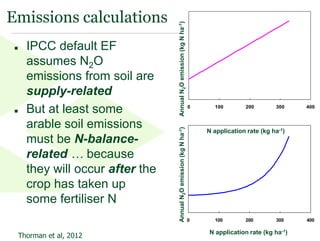
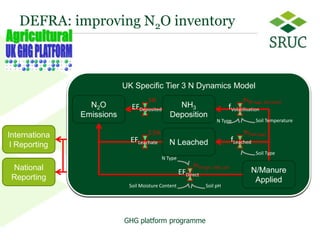
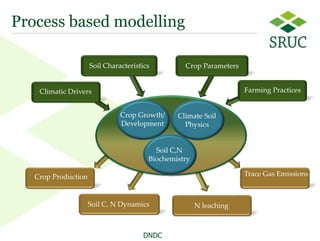
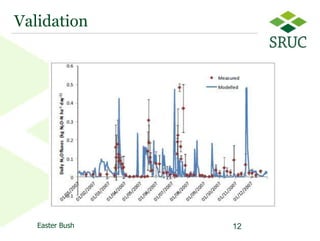
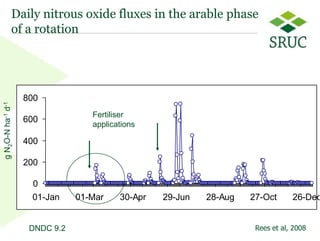
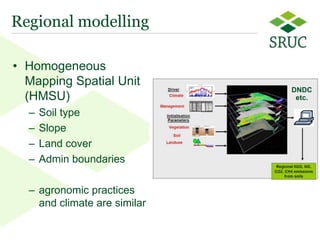
2) Process-based models can provide more detailed and accurate estimates of emissions by taking into account factors like soil type, temperature, fertilizer use and crop growth, which inter-annual reporting methods do not.
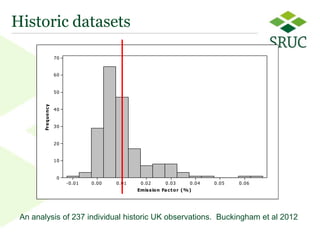
3) Improving emission estimates through measurement data, refined models and reporting approaches can help develop agricultural systems that reduce environmental impacts from greenhouse gas emissions.