A review of Brower Psychological Services' evaluation practices from 2018-2022 found:
1) No violations of adverse impact standards or statistically significant correlations between race/ethnicity and pass rates when looking at all agencies served in aggregate.
2) No adverse impact violations for the Aurora Police Department in any year, though 2021 first-stage evaluations showed a possible significant relationship between race and pass rates.
3) Additional analyses suggest the 2021 Aurora PD results were likely due to an undisclosed special recruiting program, not inherent bias in evaluation practices. Uniform processes across time and agencies were observed.
Unlocking the Potential: Deep dive into ocean of Ceramic Magnets.pptx
Impact of Race and Ethnicity on Preemployment Psychological Assessment
1. Page 1 of 23
Introduction and Summary
A thorough review of Brower Psychological Services’ (BPS) evaluation practices from 2018 through 03/2022 was
completed to uncover the possible presence of racially and/or ethnically driven adverse impact against police applicants
for the Aurora Police Department considered in insolation and for all of the agencies serviced by BPS. Typically, adverse
impact is determined by using the four-fifths or eighty percent rule. The four-fifths or 80% rule is described by the
Uniform Guidelines for Employee Selection Procedures as “a selection rate for any race, sex, or ethnic group which is less
than four-fifths (or 80%) of the rate for the group with the highest rate will generally be regarded by the Federal
enforcement agencies as evidence of adverse impact, while a greater than four-fifths rate will generally not be regarded
by Federal enforcement agencies as evidence of adverse impact.” Since the 80% test does not involve probability
distributions to determine whether the disparity is a “beyond chance” occurrence, we have additionally included tests of
statistical significance where the 80% rule may have been violated, as well as observations to assess practical significance
of the results.
No violations of the 80% rule or any statistically significant correlation between race/ethnicity and pass rate were
found when all of the area agencies serviced by BPS were viewed in aggregate, regardless of stage of evaluation. No 80%
violations were found for the Aurora Police Department in any year or stage of evaluation; however, Fisher’s Exact Test of
first-stage evaluations (“JSAs”) conducted in 2021 suggested a possibly significant relationship between race/ethnicity and
pass rate. Though there was no violation of the 80% rule despite this possible relationship, additional practical analyses
were conducted to uncover the presence of confounds or unaccounted for factors that may explain the disparity found in
this one department during a singular year. These analyses suggest that Aurora PD was engaged in either an official or
informal special recruiting program resulting in a demographic distribution that was atypical of the normal pool of
applicants from that group. Such demographic shifts in an applicant pool have been established in the literature and are
referenced specifically in the Uniform Guidelines on Employee Selection Procedures (1978) as a known source of data
distortion likely to create a specious impression of adverse impact. We find a potentially undisclosed hiring initiative to be
2. Page 2 of 23
the most likely explanation for this deviation that is confined both temporally and organizationally, as the uniformity and
stability of our processes across time and agency are observable throughout our data.
3. Page 3 of 23
Analyses
All Agency Applicants 01/2021-03/2022
Filtered By: All Agencies and Type (First)
Descriptives
Introduction
Frequencies and percentages were calculated for Pass_Fail split by Race_Ethnicity.
Results
Frequencies and Percentages
The most frequently observed category of Pass_Fail within the White category of Race_Ethnicity was Pass (n =
419, 79.06%). The most frequently observed category of Pass_Fail within the Hispanic category of Race_Ethnicity was Pass
(n = 140, 74.07%). The most frequently observed category of Pass_Fail within the Black category of Race_Ethnicity was
Pass (n = 57, 67.86%). The most frequently observed category of Pass_Fail within the Other category of Race_Ethnicity
was Pass (n = 50, 79.37%). Frequencies and percentages are presented in Table 1.
Table 1
Frequency Table for Nominal Variables
Race_Ethnicity
Variable White Hispanic Black Other Missing
Pass_Fail
Fail 111 (20.94%) 49 (25.93%) 27 (32.14%) 13 (20.63%) 0 (0.00%)
Pass 419 (79.06%) 140 (74.07%) 57 (67.86%) 50 (79.37%) 0 (0.00%)
Missing 0 (0.00%) 0 (0.00%) 0 (0.00%) 0 (0.00%) 0 (0.00%)
Total 530 (100.00%) 189 (100.00%) 84 (100.00%) 63 (100.00%) 0 (100.00%)
Note. Due to rounding error, percentages may not sum to 100%.
Filtered By: All Agencies and Type (Second)
Descriptives
Introduction
Frequencies and percentages were calculated for Pass_Fail split by Race_Ethnicity.
Results
Frequencies and Percentages
The most frequently observed category of Pass_Fail within the White category of Race_Ethnicity was Pass (n =
158, 90.80%). The most frequently observed category of Pass_Fail within the Hispanic category of Race_Ethnicity was Pass
4. Page 4 of 23
(n = 48, 88.89%). The most frequently observed category of Pass_Fail within the Black category of Race_Ethnicity was Pass
(n = 20, 86.96%). The most frequently observed category of Pass_Fail within the Other category of Race_Ethnicity was
Pass (n = 18, 90.00%). Frequencies and percentages are presented in Table 2.
Table 2
Frequency Table for Nominal Variables
Race_Ethnicity
Variable White Hispanic Black Other Missing
Pass_Fail
Fail 16 (9.20%) 6 (11.11%) 3 (13.04%) 2 (10.00%) 0 (0.00%)
Pass 158 (90.80%) 48 (88.89%) 20 (86.96%) 18 (90.00%) 0 (0.00%)
Missing 0 (0.00%) 0 (0.00%) 0 (0.00%) 0 (0.00%) 0 (0.00%)
Total 174 (100.00%) 54 (100.00%) 23 (100.00%) 20 (100.00%) 0 (100.00%)
Note. Due to rounding error, percentages may not sum to 100%.
Filtered By: All Agencies and Type (Post)
Descriptives
Introduction
Frequencies and percentages were calculated for Pass_Fail split by Race_Ethnicity.
Results
Frequencies and Percentages
The most frequently observed category of Pass_Fail within the White category of Race_Ethnicity was Pass (n =
355, 74.27%). The most frequently observed category of Pass_Fail within the Hispanic category of Race_Ethnicity was Pass
(n = 47, 66.20%). The most frequently observed category of Pass_Fail within the Black category of Race_Ethnicity was Pass
(n = 20, 66.67%). The most frequently observed category of Pass_Fail within the Other category of Race_Ethnicity was
Pass (n = 13, 59.09%). Frequencies and percentages are presented in Table 3.
5. Page 5 of 23
Table 3
Frequency Table for Nominal Variables
Race_Ethnicity
Variable White Hispanic Black Other Missing
Pass_Fail
Fail 123 (25.73%) 24 (33.80%) 10 (33.33%) 9 (40.91%) 0 (0.00%)
Pass 355 (74.27%) 47 (66.20%) 20 (66.67%) 13 (59.09%) 0 (0.00%)
Missing 0 (0.00%) 0 (0.00%) 0 (0.00%) 0 (0.00%) 0 (0.00%)
Total 478 (100.00%) 71 (100.00%) 30 (100.00%) 22 (100.00%) 0 (100.00%)
Note. Due to rounding error, percentages may not sum to 100%.
Filtered By: All Agencies and Type (First)
Fisher's Exact Test
Introduction
A Fisher's exact test was conducted to examine whether Pass_Fail and Race_Ethnicity were independent. There
were 2 levels in Pass_Fail: Fail and Pass. There were 4 levels in Race_Ethnicity: White, Hispanic, Black, and Other.
Results
The results of the Fisher exact test were not significant based on an alpha value of .05, p = .100, suggesting that
Pass_Fail and Race_Ethnicity could be independent of one another. This implies that the observed frequencies were not
significantly different than the expected frequencies. Table 4 presents the results of the Fisher's exact test.
Table 4
Observed and Expected Frequencies
Pass_Fail
Race_Ethnicity Fail Pass p
White 111[122.40] 419[407.60] .100
Hispanic 49[43.65] 140[145.35]
Black 27[19.40] 57[64.60]
Other 13[14.55] 50[48.45]
Note. Values formatted as Observed[Expected].
Filtered By: All Agencies and Type (Second)
Fisher's Exact Test
Introduction
A Fisher's exact test was conducted to examine whether Pass_Fail and Race_Ethnicity were independent. There
were 2 levels in Pass_Fail: Fail and Pass. There were 4 levels in Race_Ethnicity: White, Hispanic, Black, and Other.
6. Page 6 of 23
Results
The results of the Fisher exact test were not significant based on an alpha value of .05, p = .870, suggesting that
Pass_Fail and Race_Ethnicity could be independent of one another. This implies that the observed frequencies were not
significantly different than the expected frequencies. Table 5 presents the results of the Fisher's exact test.
Table 5
Observed and Expected Frequencies
Pass_Fail
Race_Ethnicity Fail Pass p
White 16[17.34] 158[156.66] .870
Hispanic 6[5.38] 48[48.62]
Black 3[2.29] 20[20.71]
Other 2[1.99] 18[18.01]
Note. Values formatted as Observed[Expected].
7. Page 7 of 23
Aurora PD Police Applicants 2018 – 03/2022
Filtered By: Stage (First)
Descriptives
Introduction
Frequencies and percentages were calculated for Bivariate_Pass split by Year_Nominal.
Results
Frequencies and Percentages
The most frequently observed category of Bivariate_Pass within the 2018 category of Year_Nominal was Pass (n =
151, 70.56%). The most frequently observed category of Bivariate_Pass within the 2019 category of Year_Nominal was
Pass (n = 263, 70.70%). The most frequently observed category of Bivariate_Pass within the 2020 category of
Year_Nominal was Pass (n = 160, 68.67%). The most frequently observed category of Bivariate_Pass within the 2021
category of Year_Nominal was Pass (n = 245, 69.80%). The most frequently observed category of Bivariate_Pass within the
2022 category of Year_Nominal was Pass (n = 34, 66.67%). Frequencies and percentages are presented in Table 1.
Table 1
Frequency Table for Nominal Variables
Year_Nominal
Variable 2018 2019 2020 2021 2022 Missing
Bivariate_Pass
Fail 63 (29.44%) 109 (29.30%) 73 (31.33%) 106 (30.20%) 17 (33.33%) 0 (0.00%)
Pass 151 (70.56%) 263 (70.70%) 160 (68.67%) 245 (69.80%) 34 (66.67%) 0 (0.00%)
Missing 0 (0.00%) 0 (0.00%) 0 (0.00%) 0 (0.00%) 0 (0.00%) 0 (0.00%)
Total 214 (100.00%) 372 (100.00%) 233 (100.00%) 351 (100.00%) 51 (100.00%) 0 (100.00%)
Note. Due to rounding error, percentages may not sum to 100%.
8. Page 8 of 23
Filtered By: Stage (Second)
Descriptives
Introduction
Frequencies and percentages were calculated for Bivariate_Pass split by Year_Nominal.
Results
Frequencies and Percentages
All observations were missing for the 2018 category of Year_Nominal within each category of Bivariate_Pass. The
most frequently observed category of Bivariate_Pass within the 2019 category of Year_Nominal was Pass (n = 79,
96.34%). The most frequently observed category of Bivariate_Pass within the 2020 category of Year_Nominal was Pass (n
= 77, 81.05%). The most frequently observed category of Bivariate_Pass within the 2021 category of Year_Nominal was
Pass (n = 83, 90.22%). The most frequently observed category of Bivariate_Pass within the 2022 category of Year_Nominal
was Pass (n = 12, 92.31%). Frequencies and percentages are presented in Table 2.
Table 2
Frequency Table for Nominal Variables
Year_Nominal
Variable 2018 2019 2020 2021 2022 Missing
Bivariate_Pass
Fail 0 (0.00%) 3 (3.66%) 18 (18.95%) 9 (9.78%) 1 (7.69%) 0 (0.00%)
Pass 0 (0.00%) 79 (96.34%) 77 (81.05%) 83 (90.22%) 12 (92.31%) 0 (0.00%)
Missing 0 (0.00%) 0 (0.00%) 0 (0.00%) 0 (0.00%) 0 (0.00%) 0 (0.00%)
Total 0 (100.00%) 82 (100.00%) 95 (100.00%) 92 (100.00%) 13 (100.00%) 0 (100.00%)
Note. Due to rounding error, percentages may not sum to 100%.
Filtered By: Stage (First)
Descriptives
Introduction
Frequencies and percentages were calculated for Race_Ethnicity_Simplified split by Year_Nominal.
Results
Frequencies and Percentages
The most frequently observed category of Race_Ethnicity_Simplified within the 2018 category of Year_Nominal
was White (n = 128, 59.81%). The most frequently observed category of Race_Ethnicity_Simplified within the 2019
category of Year_Nominal was White (n = 238, 63.98%). The most frequently observed category of
Race_Ethnicity_Simplified within the 2020 category of Year_Nominal was White (n = 139, 59.66%). The most frequently
9. Page 9 of 23
observed category of Race_Ethnicity_Simplified within the 2021 category of Year_Nominal was White (n = 194, 55.27%).
The most frequently observed category of Race_Ethnicity_Simplified within the 2022 category of Year_Nominal was
White (n = 27, 52.94%). Frequencies and percentages are presented in Table 3.
Table 3
Frequency Table for Nominal Variables
Year_Nominal
Variable 2018 2019 2020 2021 2022 Missing
Race_Ethnicity_Simplified
White 128 (59.81%) 238 (63.98%) 139 (59.66%) 194 (55.27%) 27 (52.94%) 0 (0.00%)
Hispanic 51 (23.83%) 67 (18.01%) 47 (20.17%) 90 (25.64%) 11 (21.57%) 0 (0.00%)
Other 13 (6.07%) 39 (10.48%) 23 (9.87%) 31 (8.83%) 2 (3.92%) 0 (0.00%)
Black 22 (10.28%) 28 (7.53%) 24 (10.30%) 36 (10.26%) 11 (21.57%) 0 (0.00%)
Missing 0 (0.00%) 0 (0.00%) 0 (0.00%) 0 (0.00%) 0 (0.00%) 0 (0.00%)
Total
214
(100.00%)
372
(100.00%)
233
(100.00%)
351
(100.00%)
51
(100.00%)
0
(100.00%)
Note. Due to rounding error, percentages may not sum to 100%.
Filtered By: Stage (Second)
Descriptives
Introduction
Frequencies and percentages were calculated for Race_Ethnicity_Simplified split by Year_Nominal.
Results
Frequencies and Percentages
All observations were missing for the 2018 category of Year_Nominal within each category of
Race_Ethnicity_Simplified. The most frequently observed category of Race_Ethnicity_Simplified within the 2019 category
of Year_Nominal was White (n = 60, 73.17%). The most frequently observed category of Race_Ethnicity_Simplified within
the 2020 category of Year_Nominal was White (n = 60, 63.16%). The most frequently observed category of
Race_Ethnicity_Simplified within the 2021 category of Year_Nominal was White (n = 58, 63.04%). The most frequently
observed category of Race_Ethnicity_Simplified within the 2022 category of Year_Nominal was White (n = 9, 69.23%).
Frequencies and percentages are presented in Table 4.
10. Page 10 of 23
Table 4
Frequency Table for Nominal Variables
Year_Nominal
Variable 2018 2019 2020 2021 2022 Missing
Race_Ethnicity_Simplified
White 0 (0.00%) 60 (73.17%) 60 (63.16%) 58 (63.04%) 9 (69.23%) 0 (0.00%)
Hispanic 0 (0.00%) 13 (15.85%) 20 (21.05%) 22 (23.91%) 3 (23.08%) 0 (0.00%)
Other 0 (0.00%) 6 (7.32%) 11 (11.58%) 6 (6.52%) 1 (7.69%) 0 (0.00%)
Black 0 (0.00%) 3 (3.66%) 4 (4.21%) 6 (6.52%) 0 (0.00%) 0 (0.00%)
Missing 0 (0.00%) 0 (0.00%) 0 (0.00%) 0 (0.00%) 0 (0.00%) 0 (0.00%)
Total 0 (100.00%) 82 (100.00%) 95 (100.00%) 92 (100.00%) 13 (100.00%) 0 (100.00%)
Note. Due to rounding error, percentages may not sum to 100%.
Filtered By: Stage (First)
Descriptives
Introduction
Frequencies and percentages were calculated for Year_Nominal and Bivariate_Pass split by
Race_Ethnicity_Simplified.
Results
Frequencies and Percentages
The most frequently observed category of Year_Nominal within the White category of Race_Ethnicity_Simplified
was 2019 (n = 238, 32.78%). The most frequently observed category of Year_Nominal within the Hispanic category of
Race_Ethnicity_Simplified was 2021 (n = 90, 33.83%). The most frequently observed category of Year_Nominal within the
Other category of Race_Ethnicity_Simplified was 2019 (n = 39, 36.11%). The most frequently observed category of
Year_Nominal within the Black category of Race_Ethnicity_Simplified was 2021 (n = 36, 29.75%). The most frequently
observed category of Bivariate_Pass within the White category of Race_Ethnicity_Simplified was Pass (n = 519, 71.49%).
The most frequently observed category of Bivariate_Pass within the Hispanic category of Race_Ethnicity_Simplified was
Pass (n = 183, 68.80%). The most frequently observed category of Bivariate_Pass within the Other category of
Race_Ethnicity_Simplified was Pass (n = 80, 74.07%). The most frequently observed category of Bivariate_Pass within the
Black category of Race_Ethnicity_Simplified was Pass (n = 71, 58.68%). Frequencies and percentages are presented in
Table 5.
11. Page 11 of 23
Table 5
Frequency Table for Nominal Variables
Race_Ethnicity_Simplified
Variable White Hispanic Other Black Missing
Year_Nominal
2018 128 (17.63%) 51 (19.17%) 13 (12.04%) 22 (18.18%) 0 (0.00%)
2019 238 (32.78%) 67 (25.19%) 39 (36.11%) 28 (23.14%) 0 (0.00%)
2020 139 (19.15%) 47 (17.67%) 23 (21.30%) 24 (19.83%) 0 (0.00%)
2021 194 (26.72%) 90 (33.83%) 31 (28.70%) 36 (29.75%) 0 (0.00%)
2022 27 (3.72%) 11 (4.14%) 2 (1.85%) 11 (9.09%) 0 (0.00%)
Missing 0 (0.00%) 0 (0.00%) 0 (0.00%) 0 (0.00%) 0 (0.00%)
Total 726 (100.00%) 266 (100.00%) 108 (100.00%) 121 (100.00%) 0 (100.00%)
Bivariate_Pass
Fail 207 (28.51%) 83 (31.20%) 28 (25.93%) 50 (41.32%) 0 (0.00%)
Pass 519 (71.49%) 183 (68.80%) 80 (74.07%) 71 (58.68%) 0 (0.00%)
Missing 0 (0.00%) 0 (0.00%) 0 (0.00%) 0 (0.00%) 0 (0.00%)
Total 726 (100.00%) 266 (100.00%) 108 (100.00%) 121 (100.00%) 0 (100.00%)
Note. Due to rounding error, percentages may not sum to 100%.
Filtered By: Stage (Second)
Descriptives
Introduction
Frequencies and percentages were calculated for Year_Nominal and Bivariate_Pass split by
Race_Ethnicity_Simplified.
Results
Frequencies and Percentages
The most frequently observed categories of Year_Nominal within the White category of Race_Ethnicity_Simplified
were 2019 and 2020 (n = 60, 32.09%). The most frequently observed category of Year_Nominal within the Hispanic
category of Race_Ethnicity_Simplified was 2021 (n = 22, 37.93%). The most frequently observed category of
Year_Nominal within the Other category of Race_Ethnicity_Simplified was 2020 (n = 11, 45.83%). The most frequently
observed category of Year_Nominal within the Black category of Race_Ethnicity_Simplified was 2021 (n = 6, 46.15%). The
most frequently observed category of Bivariate_Pass within the White category of Race_Ethnicity_Simplified was Pass (n =
165, 88.24%). The most frequently observed category of Bivariate_Pass within the Hispanic category of
Race_Ethnicity_Simplified was Pass (n = 55, 94.83%). The most frequently observed category of Bivariate_Pass within the
Other category of Race_Ethnicity_Simplified was Pass (n = 20, 83.33%). The most frequently observed category of
Bivariate_Pass within the Black category of Race_Ethnicity_Simplified was Pass (n = 11, 84.62%). Frequencies and
percentages are presented in Table 6.
12. Page 12 of 23
Table 6
Frequency Table for Nominal Variables
Race_Ethnicity_Simplified
Variable White Hispanic Other Black Missing
Year_Nominal
2018 0 (0.00%) 0 (0.00%) 0 (0.00%) 0 (0.00%) 0 (0.00%)
2019 60 (32.09%) 13 (22.41%) 6 (25.00%) 3 (23.08%) 0 (0.00%)
2020 60 (32.09%) 20 (34.48%) 11 (45.83%) 4 (30.77%) 0 (0.00%)
2021 58 (31.02%) 22 (37.93%) 6 (25.00%) 6 (46.15%) 0 (0.00%)
2022 9 (4.81%) 3 (5.17%) 1 (4.17%) 0 (0.00%) 0 (0.00%)
Missing 0 (0.00%) 0 (0.00%) 0 (0.00%) 0 (0.00%) 0 (0.00%)
Total 187 (100.00%) 58 (100.00%) 24 (100.00%) 13 (100.00%) 0 (100.00%)
Bivariate_Pass
Fail 22 (11.76%) 3 (5.17%) 4 (16.67%) 2 (15.38%) 0 (0.00%)
Pass 165 (88.24%) 55 (94.83%) 20 (83.33%) 11 (84.62%) 0 (0.00%)
Missing 0 (0.00%) 0 (0.00%) 0 (0.00%) 0 (0.00%) 0 (0.00%)
Total 187 (100.00%) 58 (100.00%) 24 (100.00%) 13 (100.00%) 0 (100.00%)
Note. Due to rounding error, percentages may not sum to 100%.
Filtered By: Year_Nominal (2018) and Stage (First)
Fisher's Exact Test
Introduction
A Fisher's exact test was conducted to examine whether Bivariate_Pass and Race_Ethnicity_Simplified were
independent. There were 2 levels in Bivariate_Pass: Fail and Pass. There were 4 levels in Race_Ethnicity_Simplified: White,
Hispanic, Other, and Black.
Results
The results of the Fisher exact test were not significant based on an alpha value of .05, p = .734, suggesting that
Bivariate_Pass and Race_Ethnicity_Simplified could be independent of one another. This implies that the observed
frequencies were not significantly different than the expected frequencies. Table 7 presents the results of the Fisher's
exact test.
Table 7
Observed and Expected Frequencies
Bivariate_Pass
Race_Ethnicity_Simplified Fail Pass p
White 41[37.68] 87[90.32] .734
Hispanic 12[15.01] 39[35.99]
Other 4[3.83] 9[9.17]
Black 6[6.48] 16[15.52]
Note. Values formatted as Observed[Expected].
13. Page 13 of 23
Filtered By: Year_Nominal (2019) and Stage (First)
Fisher's Exact Test
Introduction
A Fisher's exact test was conducted to examine whether Bivariate_Pass and Race_Ethnicity_Simplified were
independent. There were 2 levels in Bivariate_Pass: Fail and Pass. There were 4 levels in Race_Ethnicity_Simplified: White,
Hispanic, Other, and Black.
Results
The results of the Fisher exact test were not significant based on an alpha value of .05, p = .453, suggesting that
Bivariate_Pass and Race_Ethnicity_Simplified could be independent of one another. This implies that the observed
frequencies were not significantly different than the expected frequencies. Table 8 presents the results of the Fisher's
exact test.
Table 8
Observed and Expected Frequencies
Bivariate_Pass
Race_Ethnicity_Simplified Fail Pass p
White 67[69.74] 171[168.26] .453
Hispanic 19[19.63] 48[47.37]
Other 11[11.43] 28[27.57]
Black 12[8.20] 16[19.80]
Note. Values formatted as Observed[Expected].
Filtered By: Year_Nominal (2020) and Stage (First)
Fisher's Exact Test
Introduction
A Fisher's exact test was conducted to examine whether Bivariate_Pass and Race_Ethnicity_Simplified were
independent. There were 2 levels in Bivariate_Pass: Fail and Pass. There were 4 levels in Race_Ethnicity_Simplified: White,
Hispanic, Other, and Black.
Results
The results of the Fisher exact test were not significant based on an alpha value of .05, p = .680, suggesting that
Bivariate_Pass and Race_Ethnicity_Simplified could be independent of one another. This implies that the observed
frequencies were not significantly different than the expected frequencies. Table 9 presents the results of the Fisher's
exact test.
14. Page 14 of 23
Table 9
Observed and Expected Frequencies
Bivariate_Pass
Race_Ethnicity_Simplified Fail Pass p
White 43[43.55] 96[95.45] .680
Hispanic 13[14.73] 34[32.27]
Other 7[7.21] 16[15.79]
Black 10[7.52] 14[16.48]
Note. Values formatted as Observed[Expected].
Filtered By: Year_Nominal (2021) and Stage (First)
Fisher's Exact Test
Introduction
A Fisher's exact test was conducted to examine whether Bivariate_Pass and Race_Ethnicity_Simplified were
independent. There were 2 levels in Bivariate_Pass: Fail and Pass. There were 4 levels in Race_Ethnicity_Simplified: White,
Hispanic, Other, and Black.
Results
The results of the Fisher exact test were significant based on an alpha value of .05, p = .006, suggesting that
Bivariate_Pass and Race_Ethnicity_Simplified are related to one another. The following level combinations had observed
values that were greater than their expected values: Race_Ethnicity_Simplified (Hispanic):Bivariate_Pass (Fail),
Race_Ethnicity_Simplified (Black):Bivariate_Pass (Fail), Race_Ethnicity_Simplified (White):Bivariate_Pass (Pass), and
Race_Ethnicity_Simplified (Other):Bivariate_Pass (Pass). The following level combinations had observed values that were
less than their expected values: Race_Ethnicity_Simplified (White):Bivariate_Pass (Fail), Race_Ethnicity_Simplified
(Other):Bivariate_Pass (Fail), Race_Ethnicity_Simplified (Hispanic):Bivariate_Pass (Pass), and Race_Ethnicity_Simplified
(Black):Bivariate_Pass (Pass). Table 10 presents the results of the Fisher's exact test.
Table 10
Observed and Expected Frequencies
Bivariate_Pass
Race_Ethnicity_Simplified Fail Pass p
White 48[58.59] 146[135.41] .006
Hispanic 35[27.18] 55[62.82]
Other 6[9.36] 25[21.64]
Black 17[10.87] 19[25.13]
Note. Values formatted as Observed[Expected].
15. Page 15 of 23
Filtered By: Year_Nominal (2022) and Stage (First)
Fisher's Exact Test
Introduction
A Fisher's exact test was conducted to examine whether Bivariate_Pass and Race_Ethnicity_Simplified were
independent. There were 2 levels in Bivariate_Pass: Fail and Pass. There were 4 levels in Race_Ethnicity_Simplified: White,
Hispanic, Other, and Black.
Results
The results of the Fisher exact test were not significant based on an alpha value of .05, p = .698, suggesting that
Bivariate_Pass and Race_Ethnicity_Simplified could be independent of one another. This implies that the observed
frequencies were not significantly different than the expected frequencies. Table 11 presents the results of the Fisher's
exact test.
Table 11
Observed and Expected Frequencies
Bivariate_Pass
Race_Ethnicity_Simplified Fail Pass p
White 8[9.00] 19[18.00] .698
Hispanic 4[3.67] 7[7.33]
Other 0[0.67] 2[1.33]
Black 5[3.67] 6[7.33]
Note. Values formatted as Observed[Expected].
Filtered By: Year_Nominal (2019) and Stage (Second)
Fisher's Exact Test
Introduction
A Fisher's exact test was conducted to examine whether Bivariate_Pass and Race_Ethnicity_Simplified were
independent. There were 2 levels in Bivariate_Pass: Fail and Pass. There were 4 levels in Race_Ethnicity_Simplified: White,
Hispanic, Other, and Black.
Results
The results of the Fisher exact test were not significant based on an alpha value of .05, p = 1.000, suggesting that
Bivariate_Pass and Race_Ethnicity_Simplified could be independent of one another. This implies that the observed
frequencies were not significantly different than the expected frequencies. Table 12 presents the results of the Fisher's
exact test.
Table 12
16. Page 16 of 23
Observed and Expected Frequencies
Bivariate_Pass
Race_Ethnicity_Simplified Fail Pass p
White 3[2.20] 57[57.80] 1.000
Hispanic 0[0.48] 13[12.52]
Other 0[0.22] 6[5.78]
Black 0[0.11] 3[2.89]
Note. Values formatted as Observed[Expected].
Filtered By: Year_Nominal (2020) and Stage (Second)
Fisher's Exact Test
Introduction
A Fisher's exact test was conducted to examine whether Bivariate_Pass and Race_Ethnicity_Simplified were
independent. There were 2 levels in Bivariate_Pass: Fail and Pass. There were 4 levels in Race_Ethnicity_Simplified: White,
Hispanic, Other, and Black.
Results
The results of the Fisher exact test were not significant based on an alpha value of .05, p = .227, suggesting that
Bivariate_Pass and Race_Ethnicity_Simplified could be independent of one another. This implies that the observed
frequencies were not significantly different than the expected frequencies. Table 13 presents the results of the Fisher's
exact test.
Table 13
Observed and Expected Frequencies
Bivariate_Pass
Race_Ethnicity_Simplified Fail Pass p
White 13[11.37] 47[48.63] .227
Hispanic 1[3.79] 19[16.21]
Other 3[2.08] 8[8.92]
Black 1[0.76] 3[3.24]
Note. Values formatted as Observed[Expected].
Filtered By: Year_Nominal (2021) and Stage (Second)
Fisher's Exact Test
Introduction
A Fisher's exact test was conducted to examine whether Bivariate_Pass and Race_Ethnicity_Simplified were
independent. There were 2 levels in Bivariate_Pass: Fail and Pass. There were 4 levels in Race_Ethnicity_Simplified: White,
Hispanic, Other, and Black.
17. Page 17 of 23
Results
The results of the Fisher exact test were not significant based on an alpha value of .05, p = .399, suggesting that
Bivariate_Pass and Race_Ethnicity_Simplified could be independent of one another. This implies that the observed
frequencies were not significantly different than the expected frequencies. Table 14 presents the results of the Fisher's
exact test.
Table 14
Observed and Expected Frequencies
Bivariate_Pass
Race_Ethnicity_Simplified Fail Pass p
White 6[5.67] 52[52.33] .399
Hispanic 1[2.15] 21[19.85]
Other 1[0.59] 5[5.41]
Black 1[0.59] 5[5.41]
Note. Values formatted as Observed[Expected].
18. Page 18 of 23
Filtered By: Year_Nominal (2022) and Stage (Second)
Fisher's Exact Test
Introduction
A Fisher's exact test was conducted to examine whether Bivariate_Pass and Race_Ethnicity_Simplified were
independent. There were 2 levels in Bivariate_Pass: Fail and Pass. There were 4 levels in Race_Ethnicity_Simplified: White,
Hispanic, Other, and Black.
Results
The results of the Fisher exact test were not significant based on an alpha value of .05, p = .308, suggesting that
Bivariate_Pass and Race_Ethnicity_Simplified could be independent of one another. This implies that the observed
frequencies were not significantly different than the expected frequencies. Table 15 presents the results of the Fisher's
exact test.
Table 15
Observed and Expected Frequencies
Bivariate_Pass
Race_Ethnicity_Simplified Fail Pass p
White 0[0.69] 9[8.31] .308
Hispanic 1[0.23] 2[2.77]
Other 0[0.08] 1[0.92]
Black 0[0.00] 0[0.00]
Note. Values formatted as Observed[Expected].
19. Page 19 of 23
Aurora PD Observations
Adverse Impact: 4/5ths - 80/20 Rule
The following figures were published/distributed by Aurora PD describing the demographic composition and
selection rates for police academies held 2018-2020 titled “Passing Job Suitability Interview”:
Table 16
Aurora PD’s Figures for Passing Job Suitability Interview, from “APD Academies from 2018-2020”
Race/Ethnicity
White or Caucasian Black or African American Hispanic or Latino Asian 2+ or Other
Passing Job
Suitability
Interview
413 (42.4%) 42 (34.4%) 112 (37.7%) 18 (37.5%) 80 (44.7%)
According to these figures, the 4/5ths – 80/20 rule would have been violated for “Black or African American”
applicants when compared to the group with the highest passing rate, “2+ or Other.” These figures are substantially
different than the figures we have for police applicants referred by Aurora PD for JSA’s from 2018-2020, which appear in
the table below.
Table 17
Frequency Table for Nominal Variables
Race_Ethnicity_Simplified
Variable White Hispanic Other Black Missing
Bivariate_Pass
Fail 151 (29.90%) 44 (26.67%) 22 (29.33%) 28 (37.84%) 0 (0.00%)
Pass 354 (70.10%) 121 (73.33%) 53 (70.67%) 46 (62.16%) 0 (0.00%)
Missing 0 (0.00%) 0 (0.00%) 0 (0.00%) 0 (0.00%) 0 (0.00%)
Total 505 (100.00%) 165 (100.00%) 75 (100.00%) 74 (100.00%) 0 (100.00%)
Note. Due to rounding error, percentages may not sum to 100%.
Not only do our figures represent a far higher passing percentage for applicants, there is no violation of the 4/5ths
– 80/20 rule when comparing the demographic group with the highest passing rate (Hispanic; 73.33%) to the
demographic group with the lowest passing rate (Black; 62.16%).
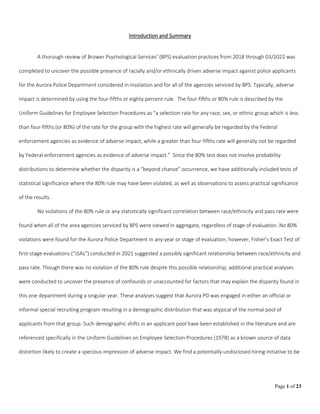
When 2018-2022 JSAs are viewed in aggregate, Other is the demographic group with the highest passing
percentage (~74%) and Black is the demographic group with the lowest passing percentage (~59%). White and Hispanic
20. Page 20 of 23
groupings showed passing rates within a few percent (~71% and ~69%, respectively). When the 4/5ths rule is applied to
measure the difference between Black and Other applicants, an ~20% difference is observed, suggesting that adverse
impact is not present at a level surpassing prevailing/traditional Federal guidelines. When Black applicants are compared
to White applicants, the demographic group comprising the majority of all applicants, a 17% difference is seen, again
suggesting that adverse impact is not present at a level surpassing prevailing/traditional Federal guidelines.
When the same aggregated approach is applied to Aurora PD 2nd
Stage evaluations, there is no observable
difference indicating violation of the 4/5ths rule. The demographic group with the highest passing rate amongst 2nd
Stage
evaluations from 2018-2022 is Hispanic (~95%) while the lowest passing rate being found in the Other demographic group
(~83%); a 13% difference. Among all 2nd
Stages from 2018-2022, members of the White group passed at ~88%, while
members of the Black group passed at approximately ~85%.
0%
10%
20%
30%
40%
50%
60%
70%
80%
2018-2022 JSA Passing Rates
White Black Hispanic Other
21. Page 21 of 23
Adverse Impact: Statistical Significance
Fisher’s Exact Tests split by year and stage of evaluation for Aurora PD suggest that there is no difference between
observed and expected frequencies of passing among the four demographic groups for JSAs conducted in 2018, 2019,
2020, and 2022 and for 2nd
Stage evaluations conducted from 2018-2022. Among 2021 JSAs there is a possible
relationship suggested between Race/Ethnicity and Passing; specifically, that members of the White and Other
demographic groups are more likely to pass, while members of the Black and Hispanic demographic groups are less likely
to pass.
Adverse Impact: Practical Significance (Demographic Shifts)
When comparing demographic distributions of applicants referred for JSAs by Aurora PD from 2019 to 2022, the
percentage of all applicants self-identifying as White, decreased by ~10%. Between 2020 and 2021, the percentage of
applicants self-identifying as Hispanic nearly doubled (~18% vs ~34%), and between 2019 and 2022, the percentage of
applicant’s self-identifying as Black more than doubled, increasing by ~96% (from ~8% to ~22%).
62%
96%
-10%
Applicant Demographic Changes JSAs
Hispanic Black White
76%
78%
80%
82%
84%
86%
88%
90%
92%
94%
96%
2018-2022 2nd Stage Passing Rates
White Black Hispanic Other
22. Page 22 of 23
When looking at 2nd Stage evaluations for Aurora PD, a similar 10% decrease in White applicants is observable
when comparing 2019’s ~73% proportion to 2020 and 2021’s ~63%. When comparing the number of Black applicants
referred for 2nd
Stage evaluations from 2019 to 2021, a 56% increase is observable. The percentage of Hispanic applicants
also increased by more than 50% from 2019 (~22%) to 2021 (~38%).
Adverse Impact: Practical Significance (Inclusion/Exclusion Shifts)
In 2021, Aurora PD referred 351 applicants for JSAs, ~40% more applicants than were referred in the preceding
year (233). The same increase in applicant referrals was not witnessed for 2nd
Stage evaluations; in fact, there was a slight
decrease observed from 2020 to 2021 (95 vs. 92; ~3% decrease). This absence of a difference between the number of
applicants referred for 2nd
Stage referrals, despite the marked increase in the number of applicants referred for JSAs is
notable. In 2020, ~41% of the applicants seen for a JSA returned for a 2nd
Stage, but in 2021, only 26% of applicants seen
for a JSA were referred for a 2nd
Stage evaluation, a decrease of ~45%.
51%
56%
-10%
Applicant Demographic Changes 2nd Stage
Hispanic Black White
23. Page 23 of 23
Adverse Impact: Conclusion
The observable dramatic demographic shifts which accompany the only indication of possible adverse impacts
suggests the presence of an overt or covert modification in the early portion of the hiring process creating an atypical
demographic distribution that is being reflected in the seemingly disproportionate fail rates of Black and Hispanic
applicants that becomes undetectable when examining the demographic distribution of Aurora PD applicants who
returned for 2nd
Stage evaluations.