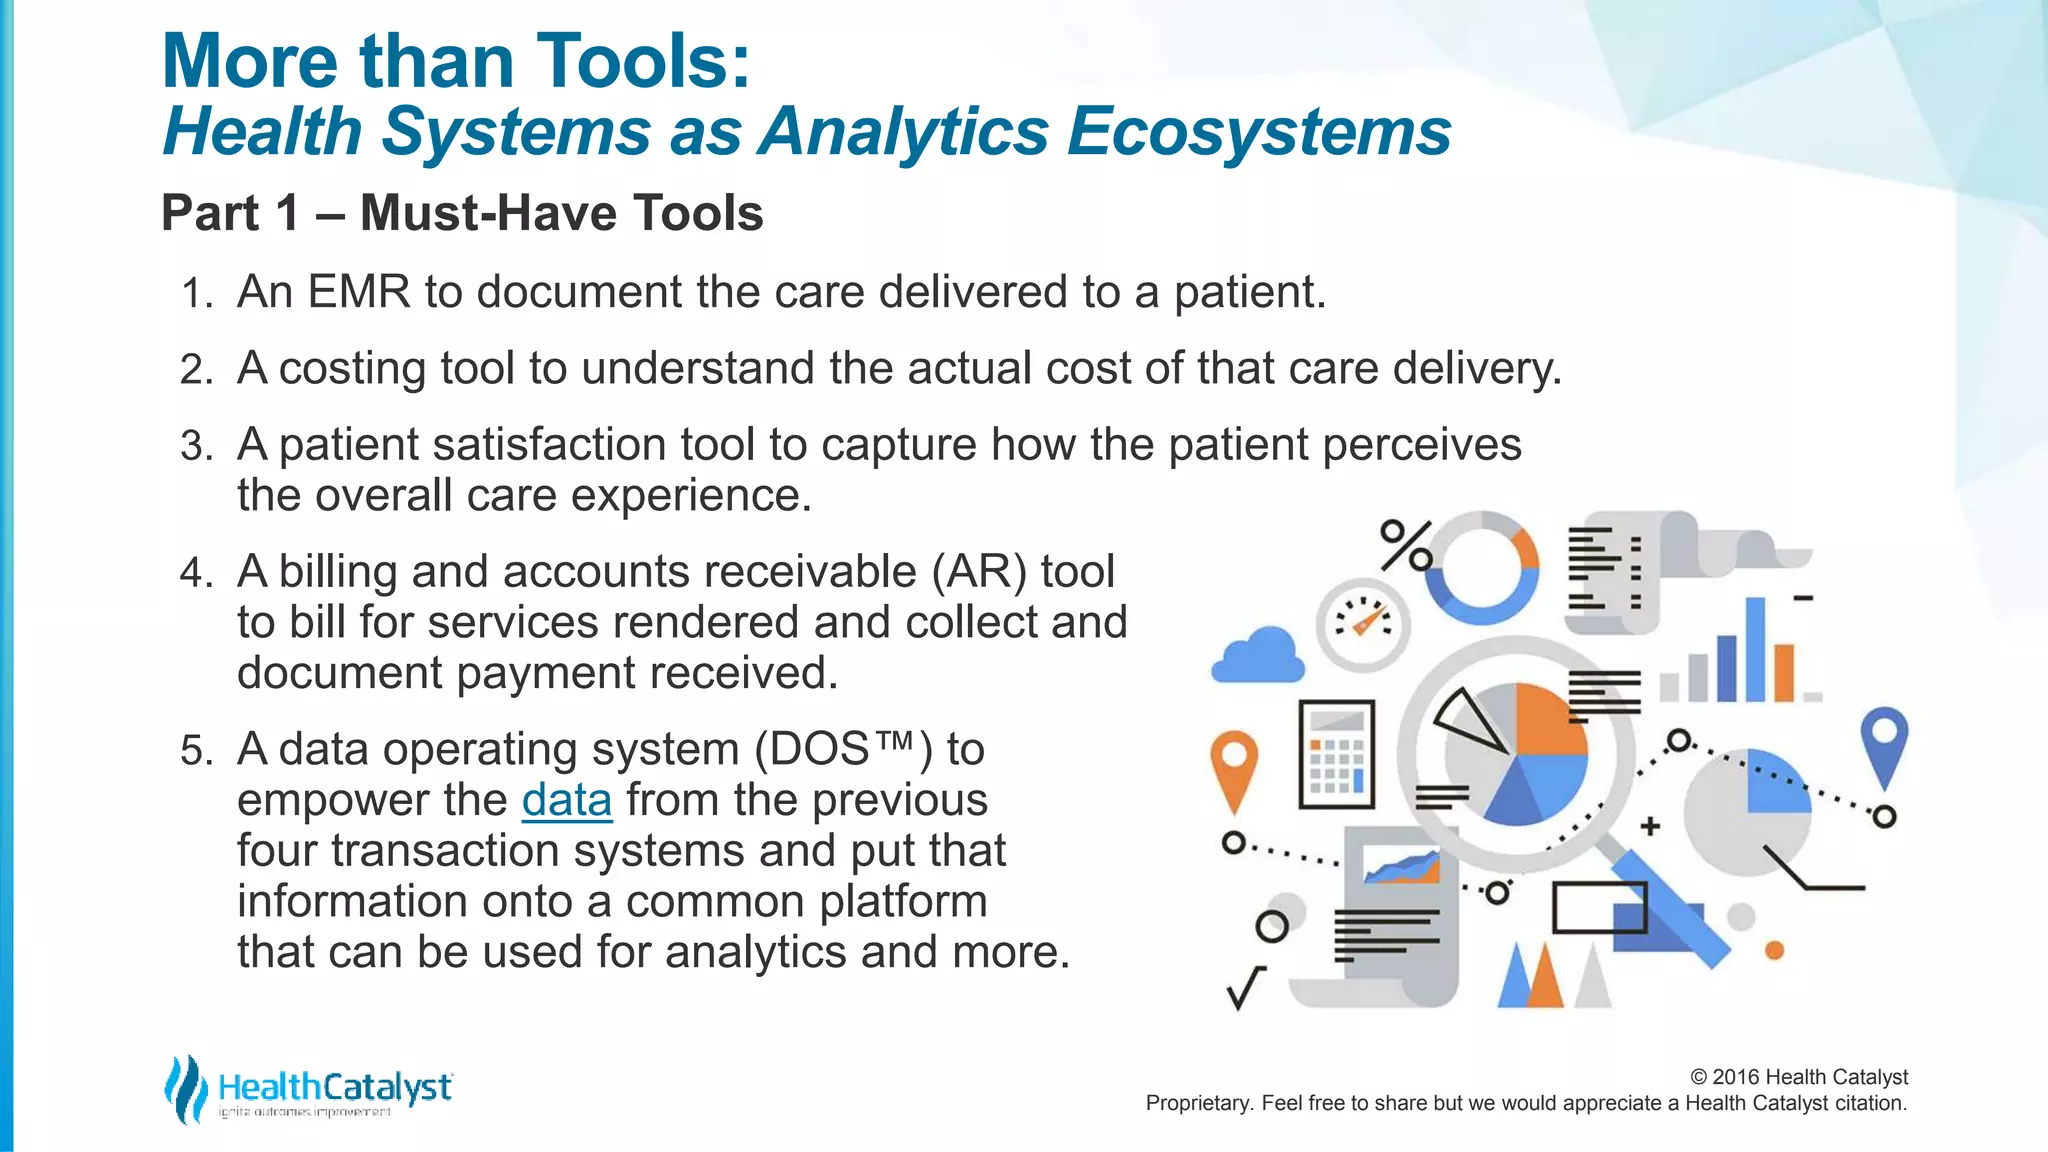
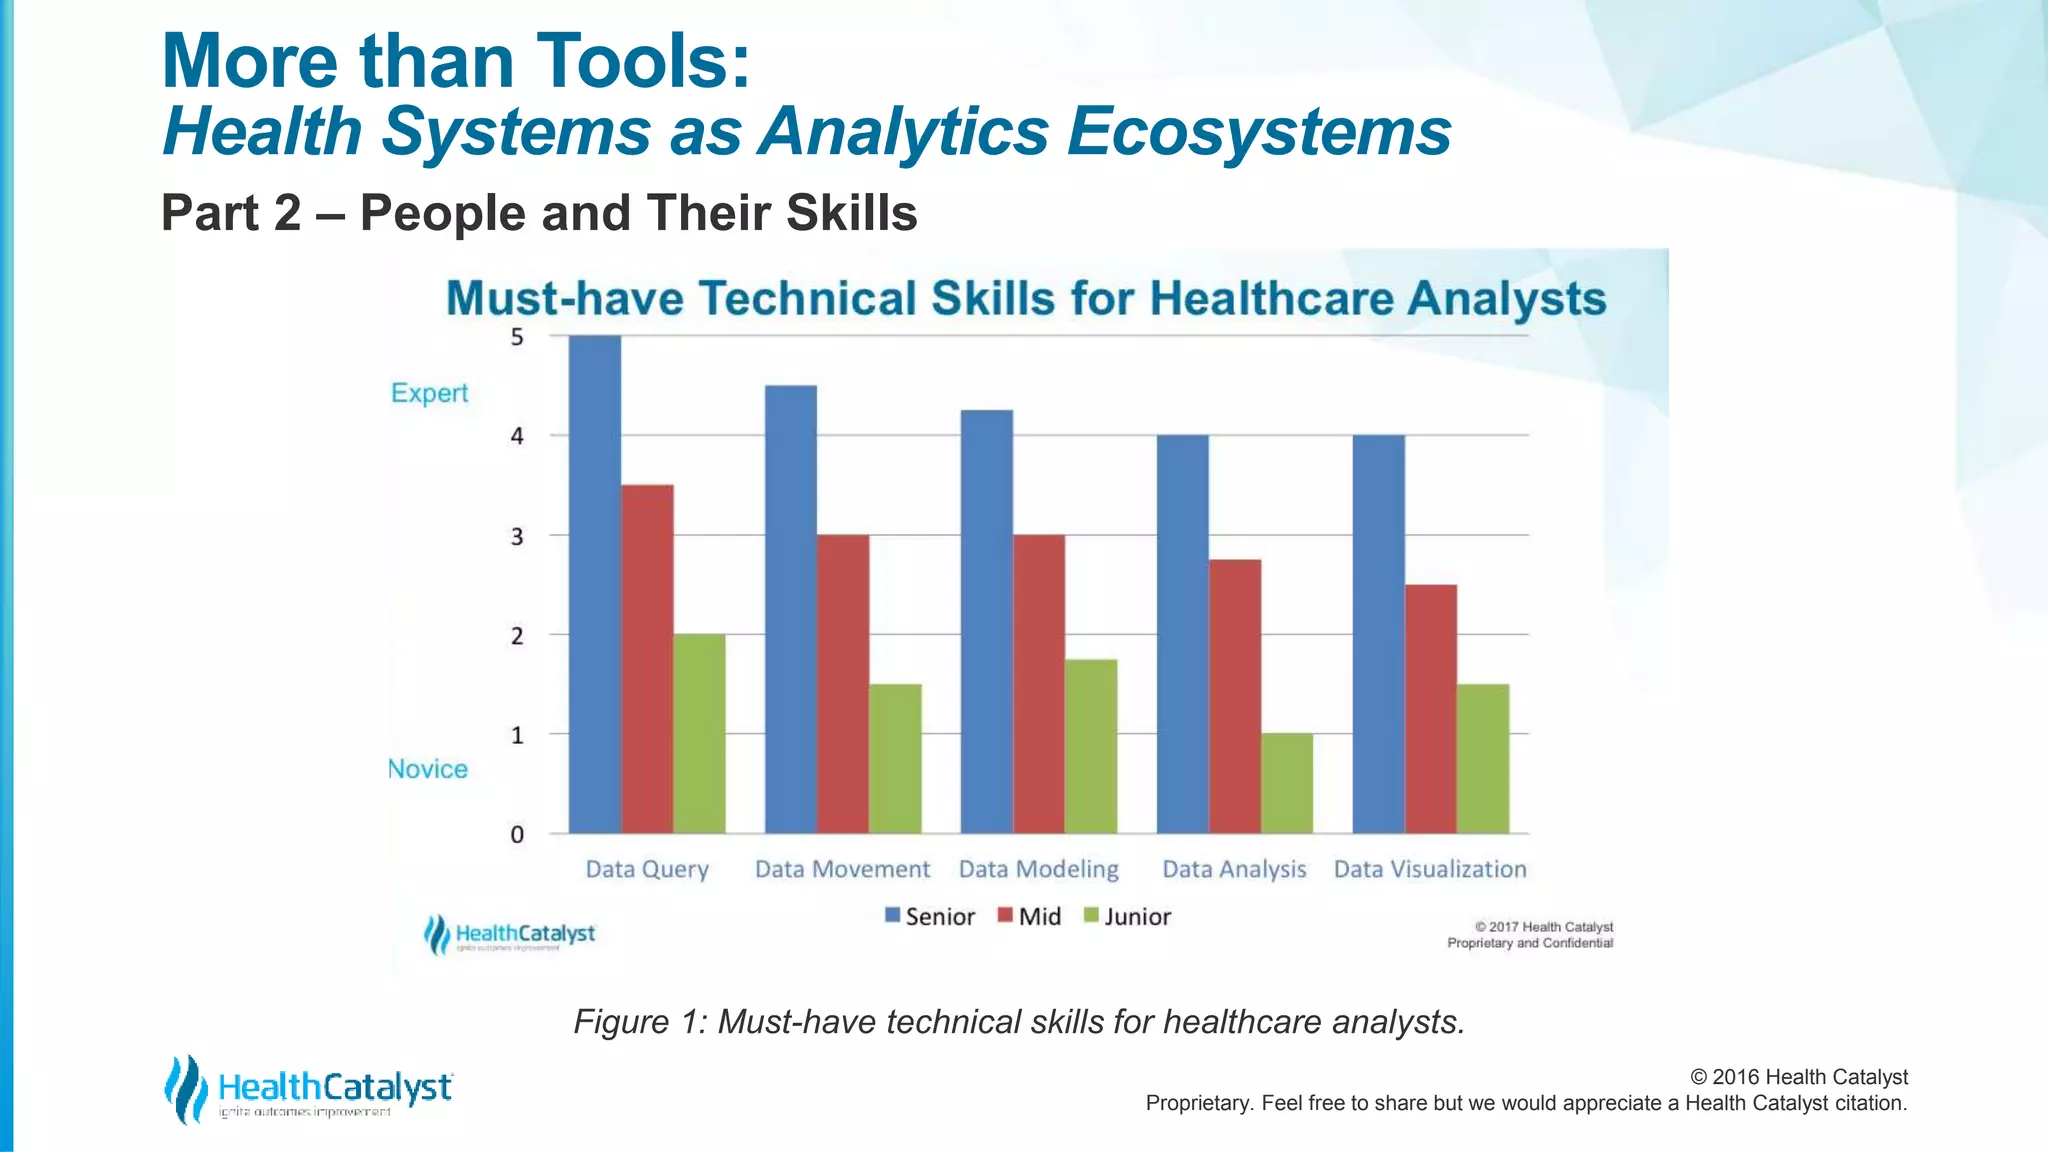
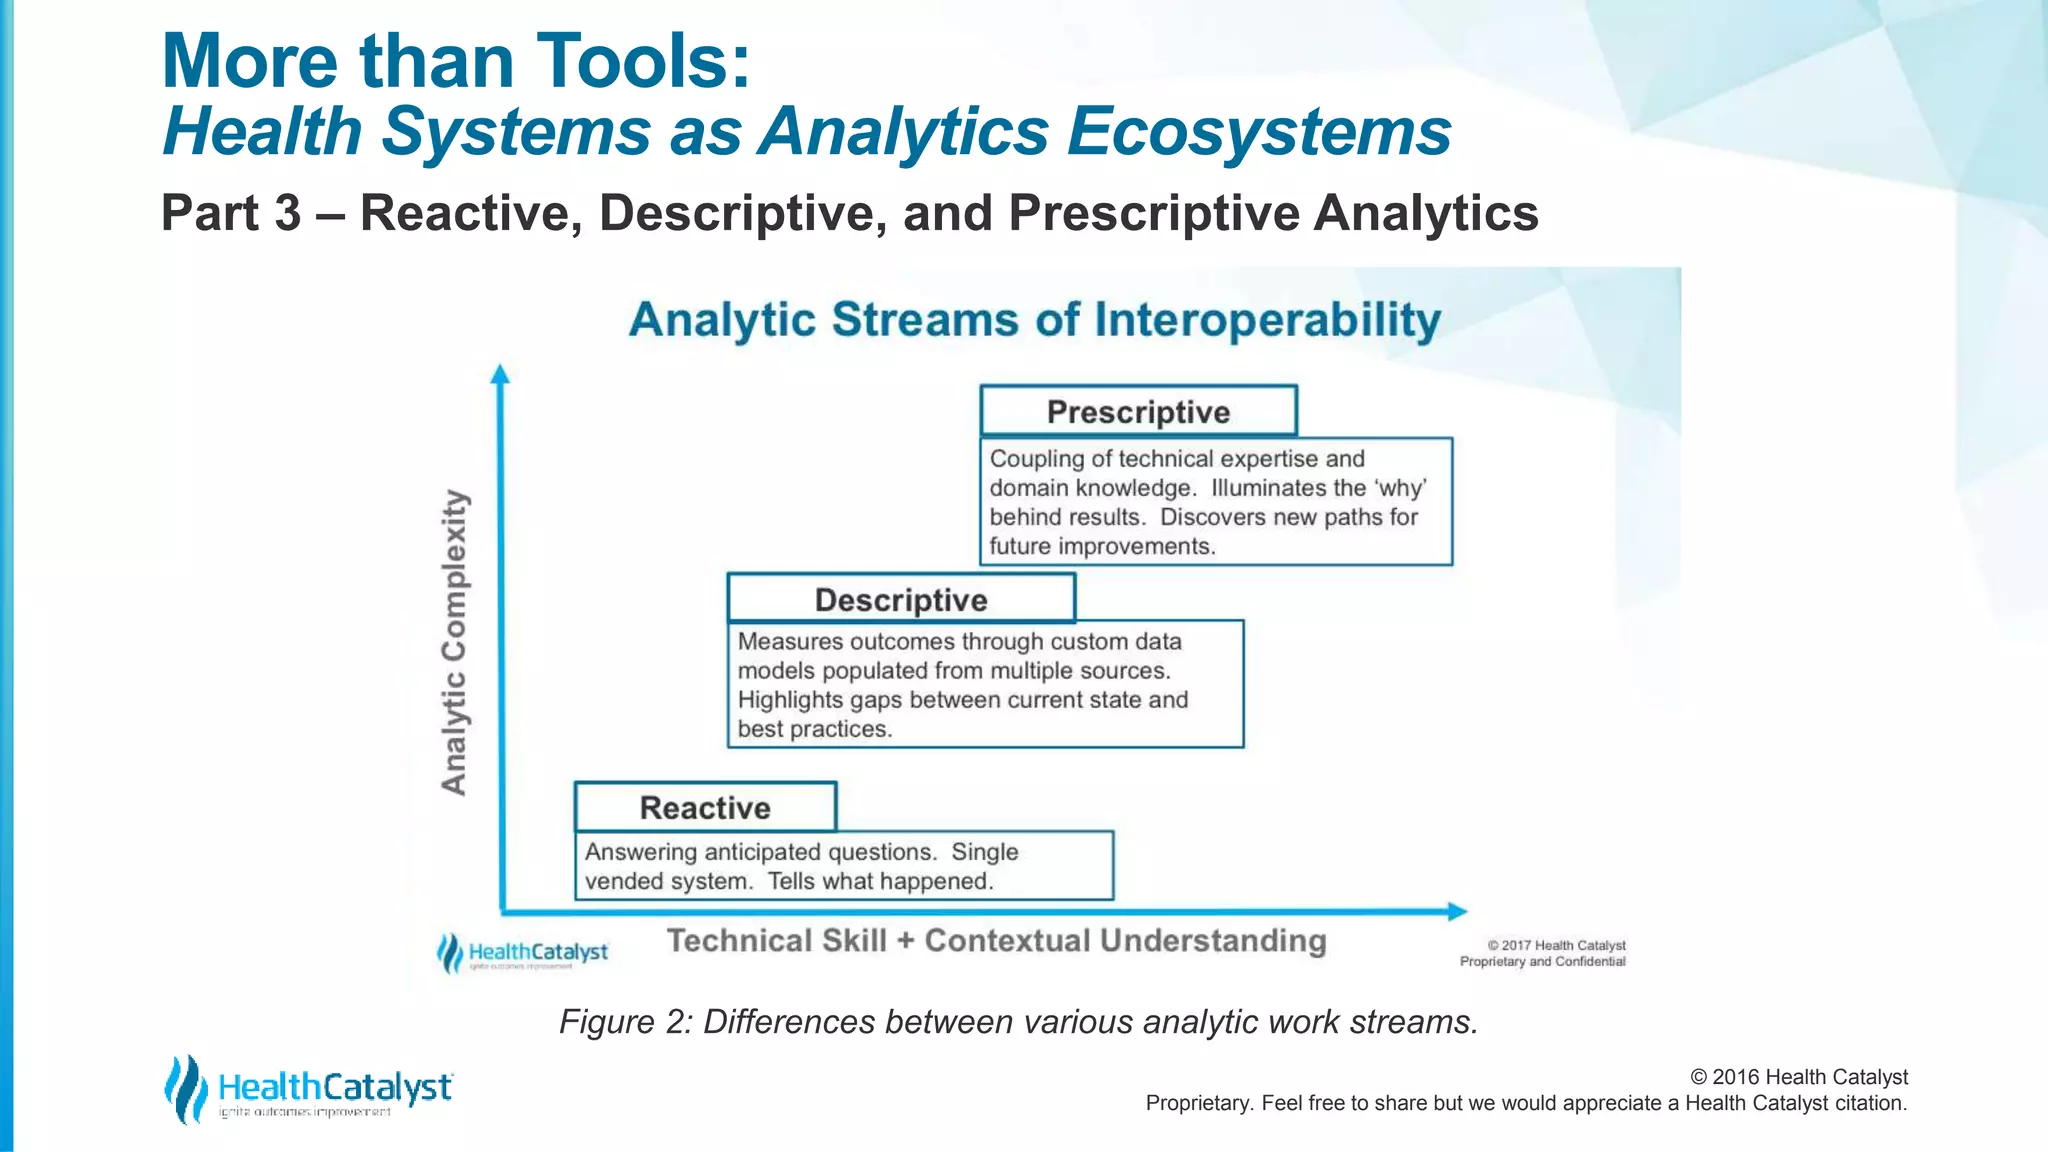
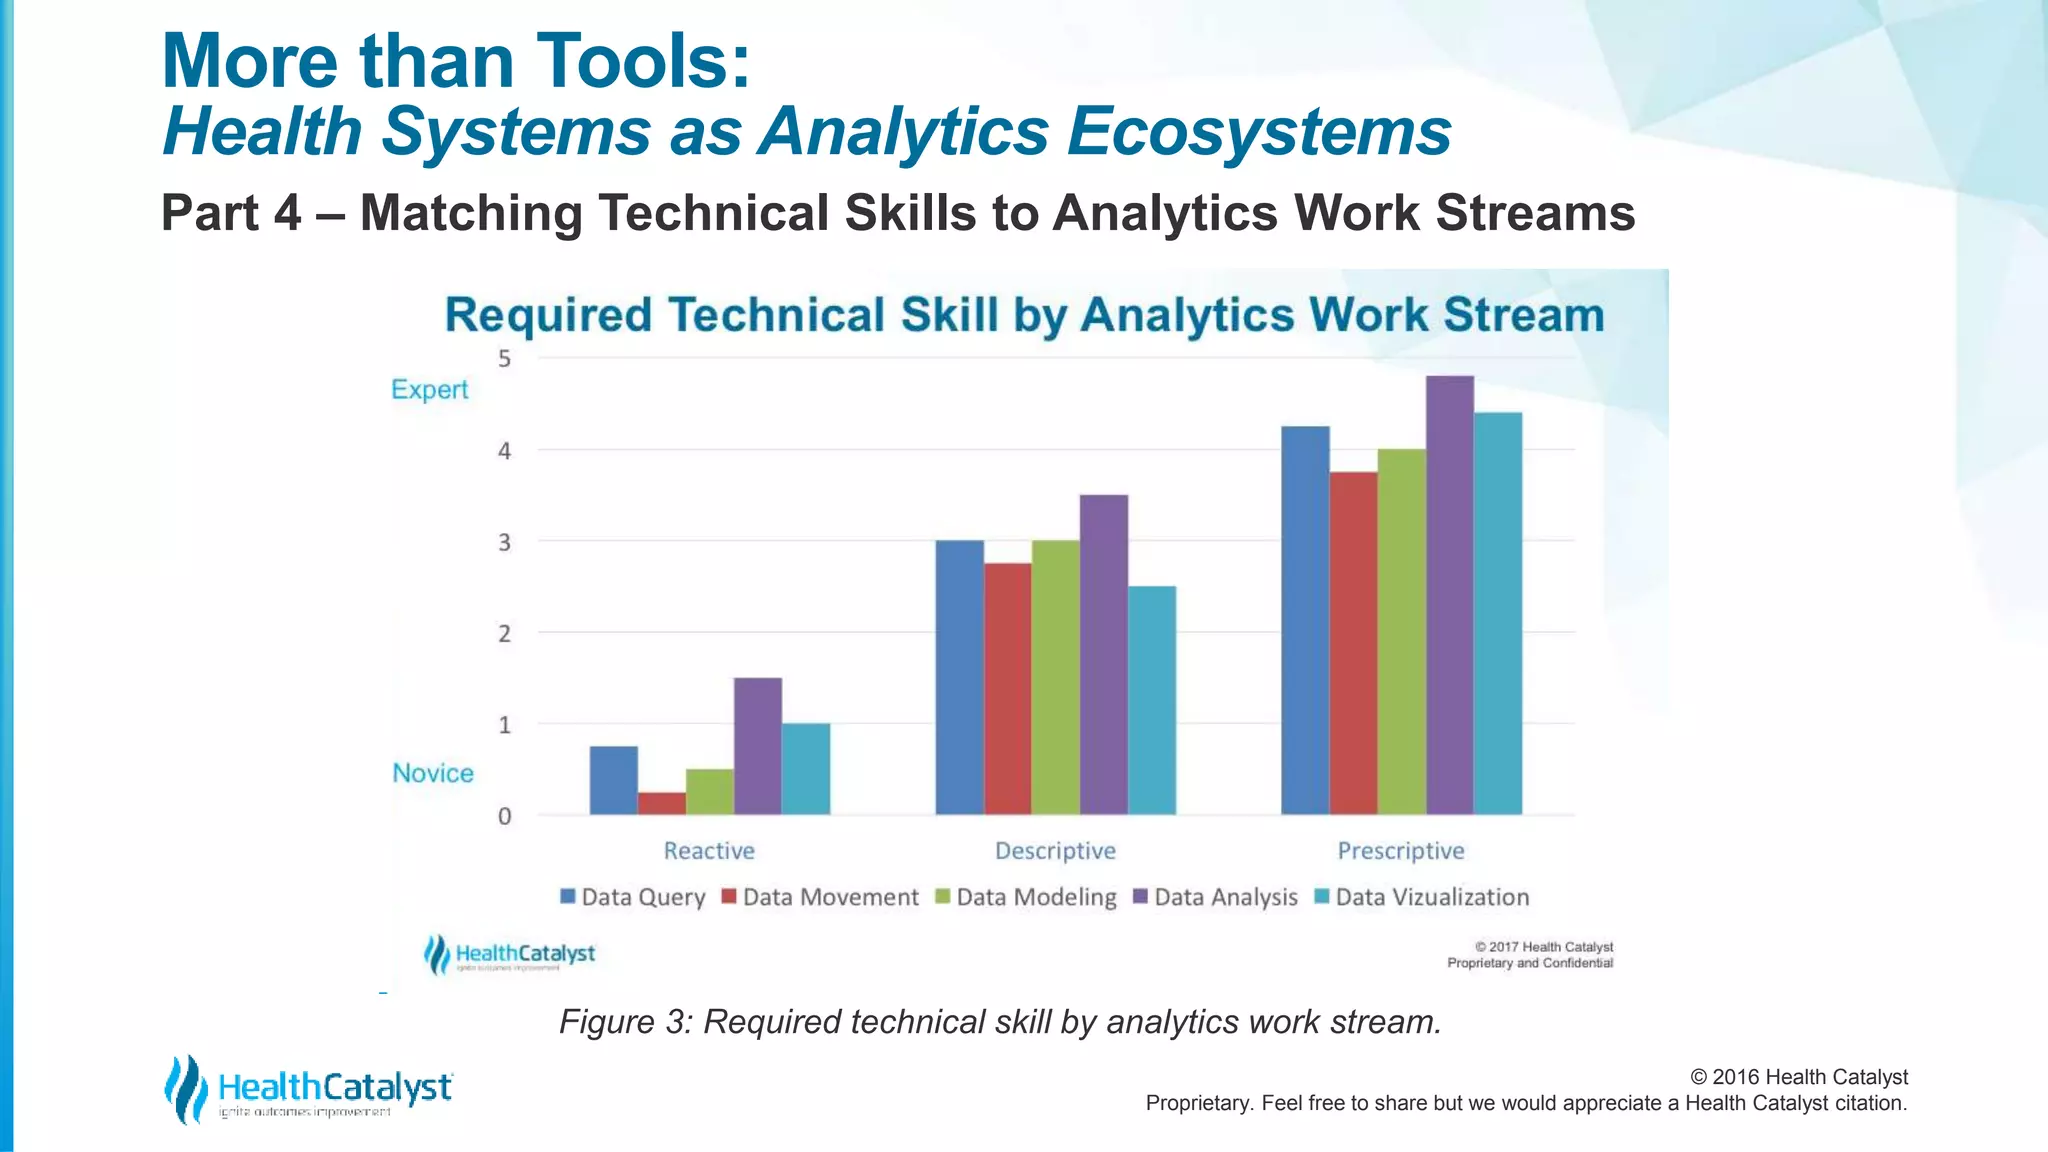
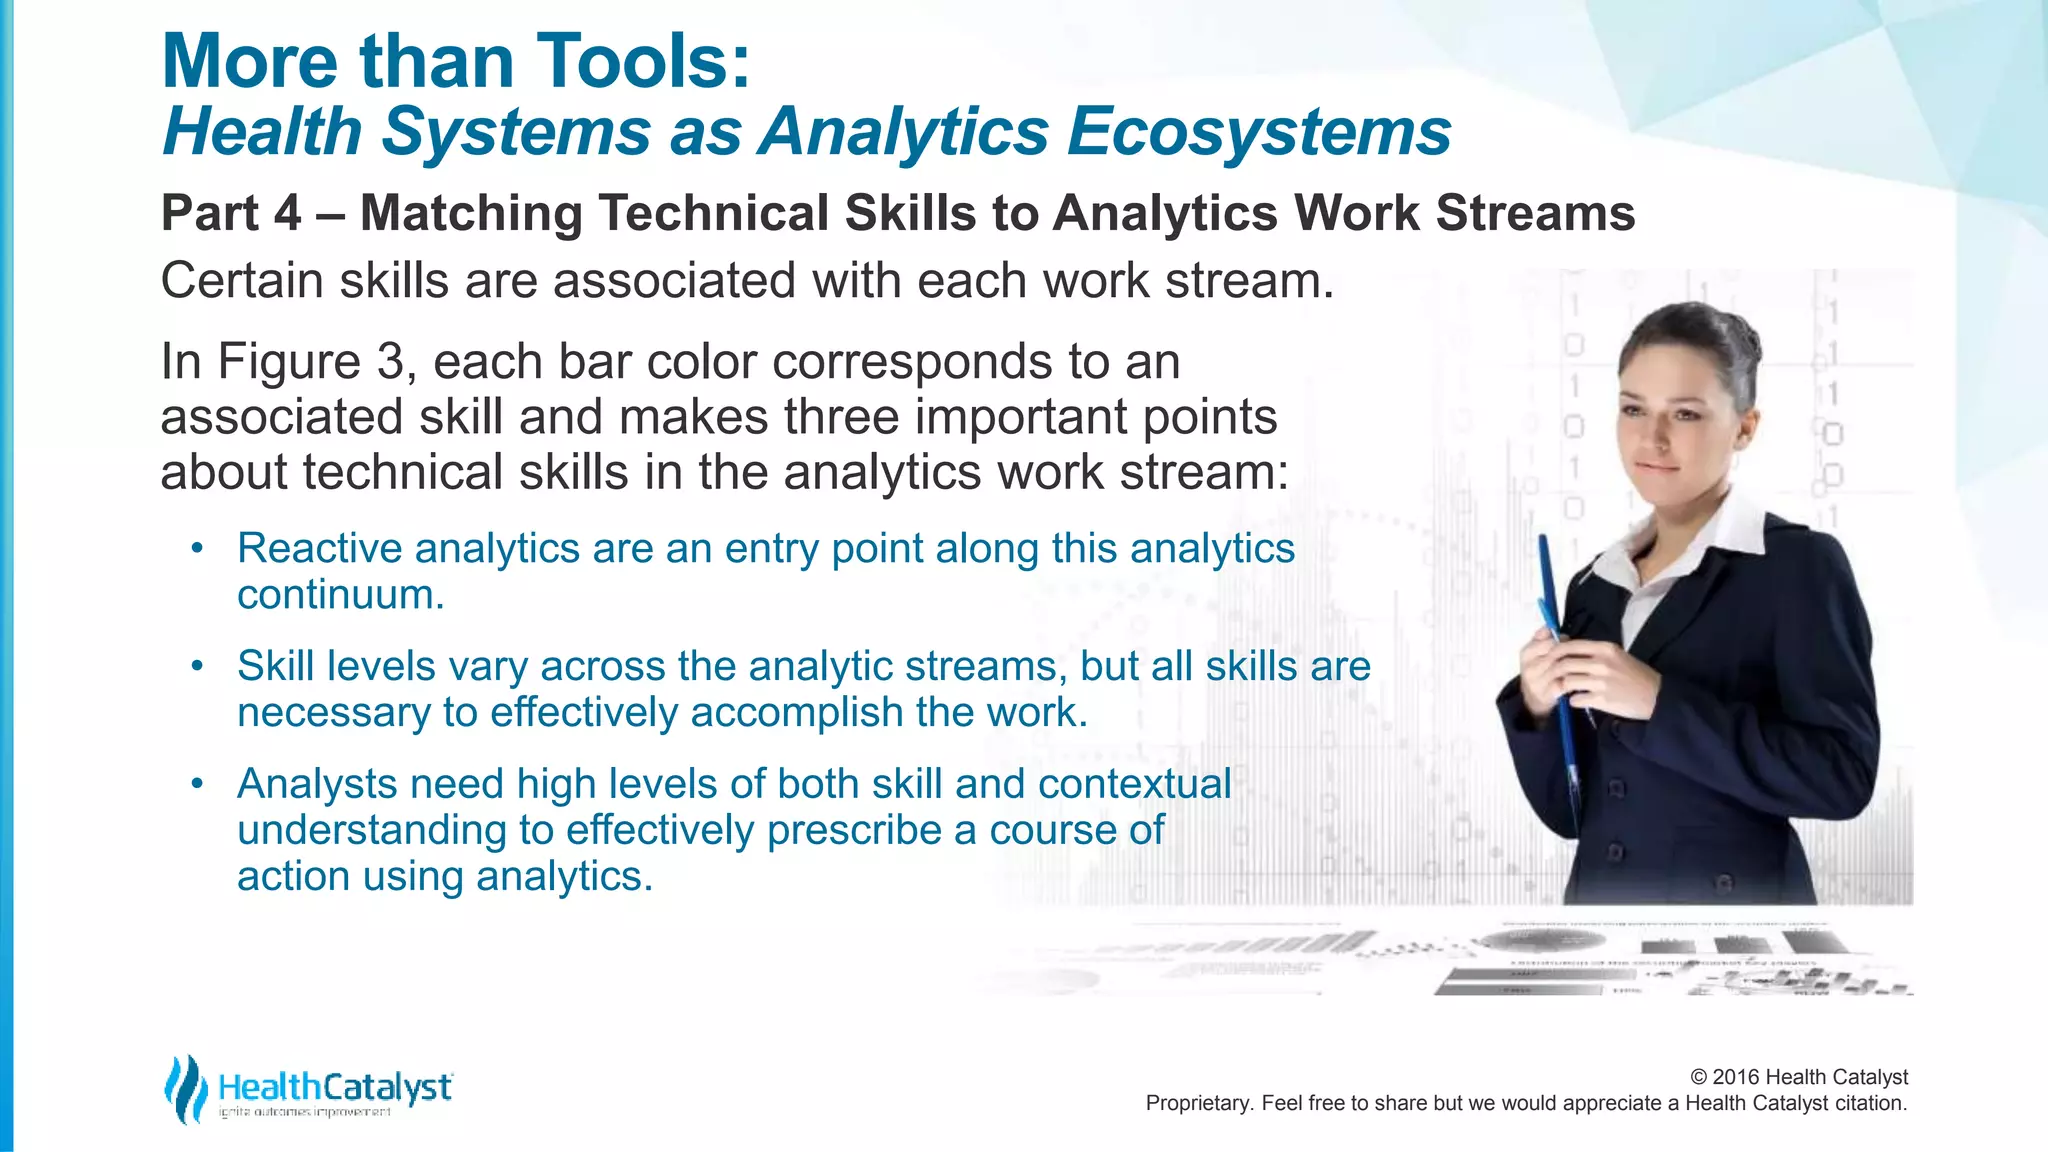
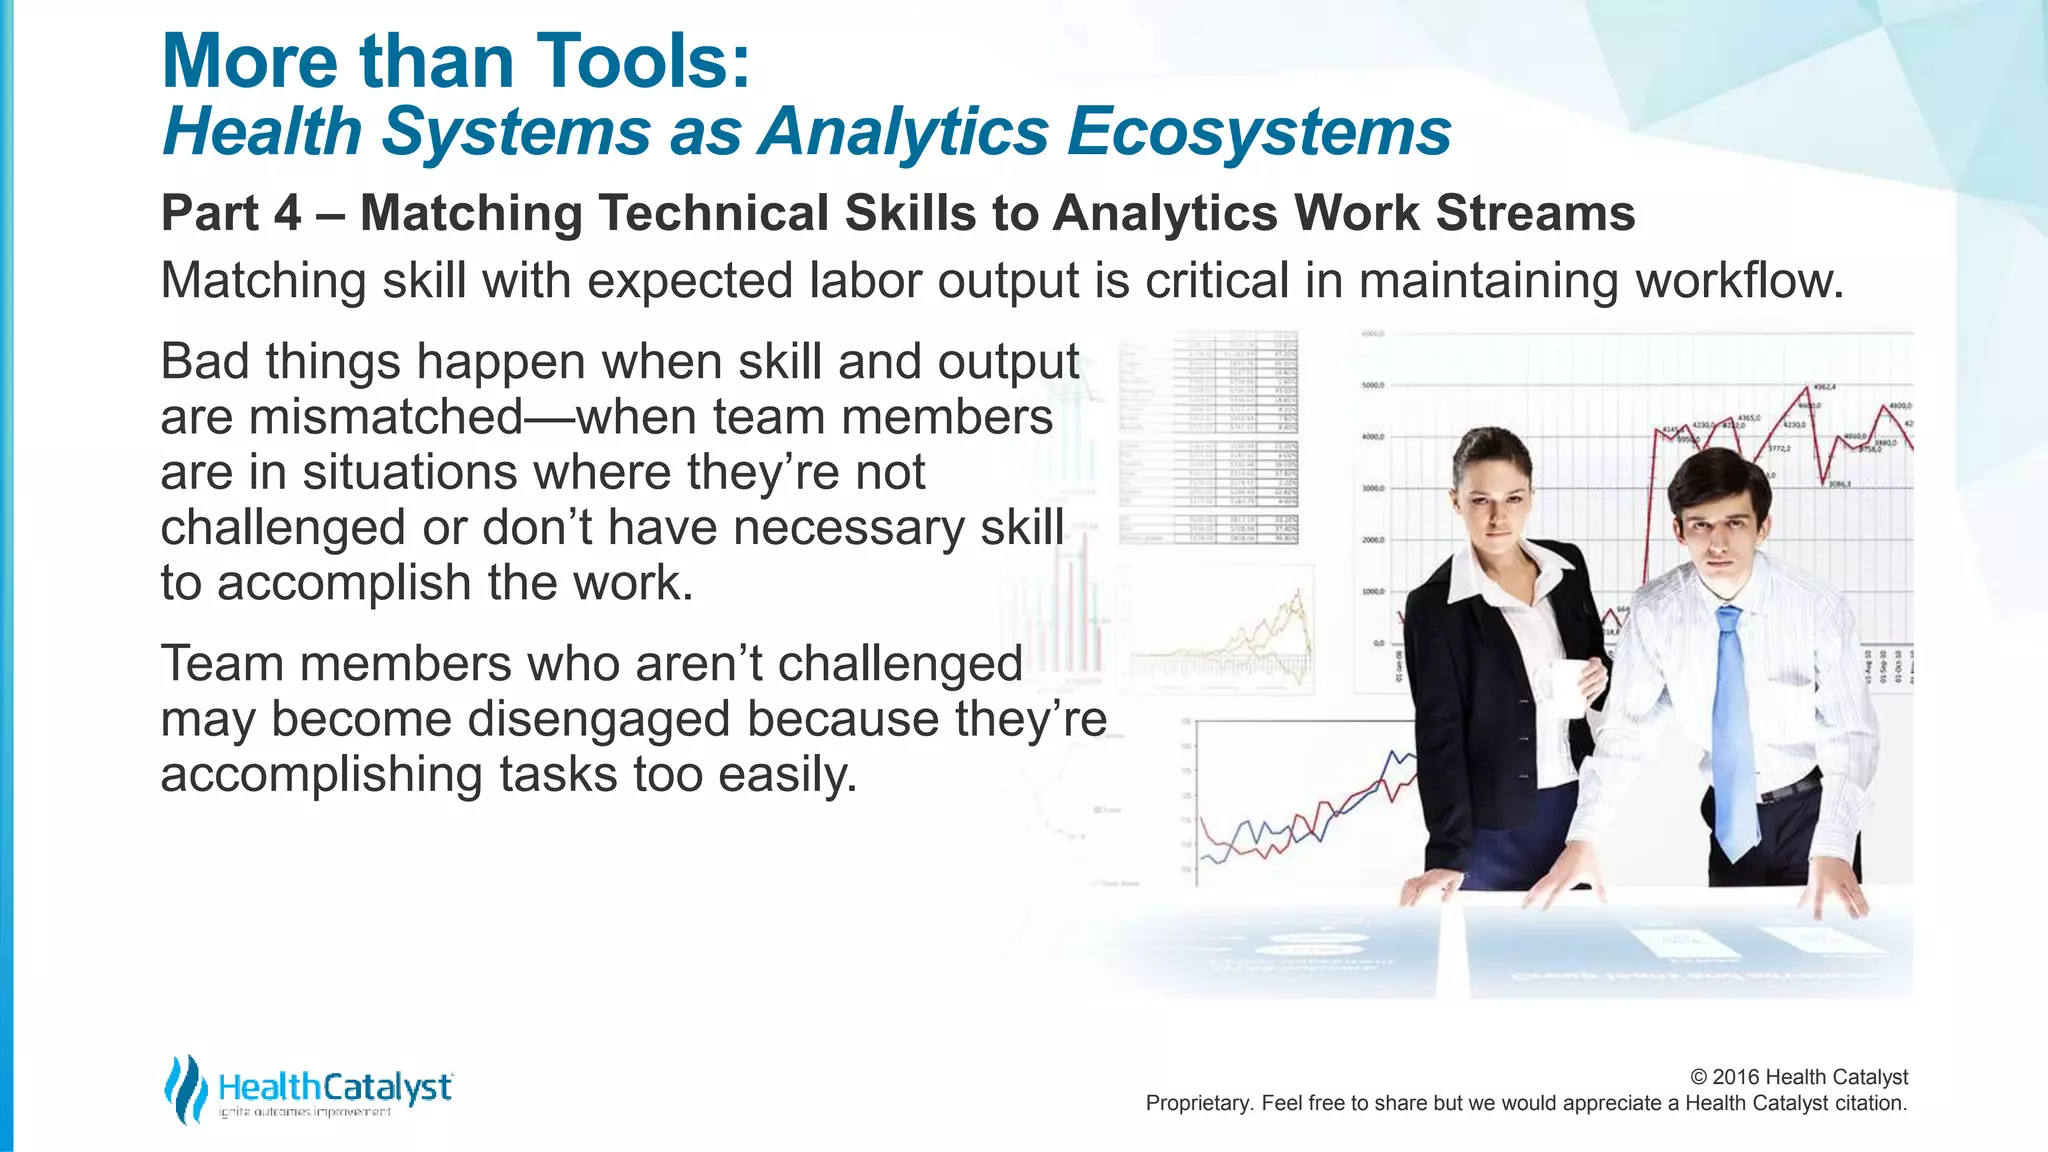
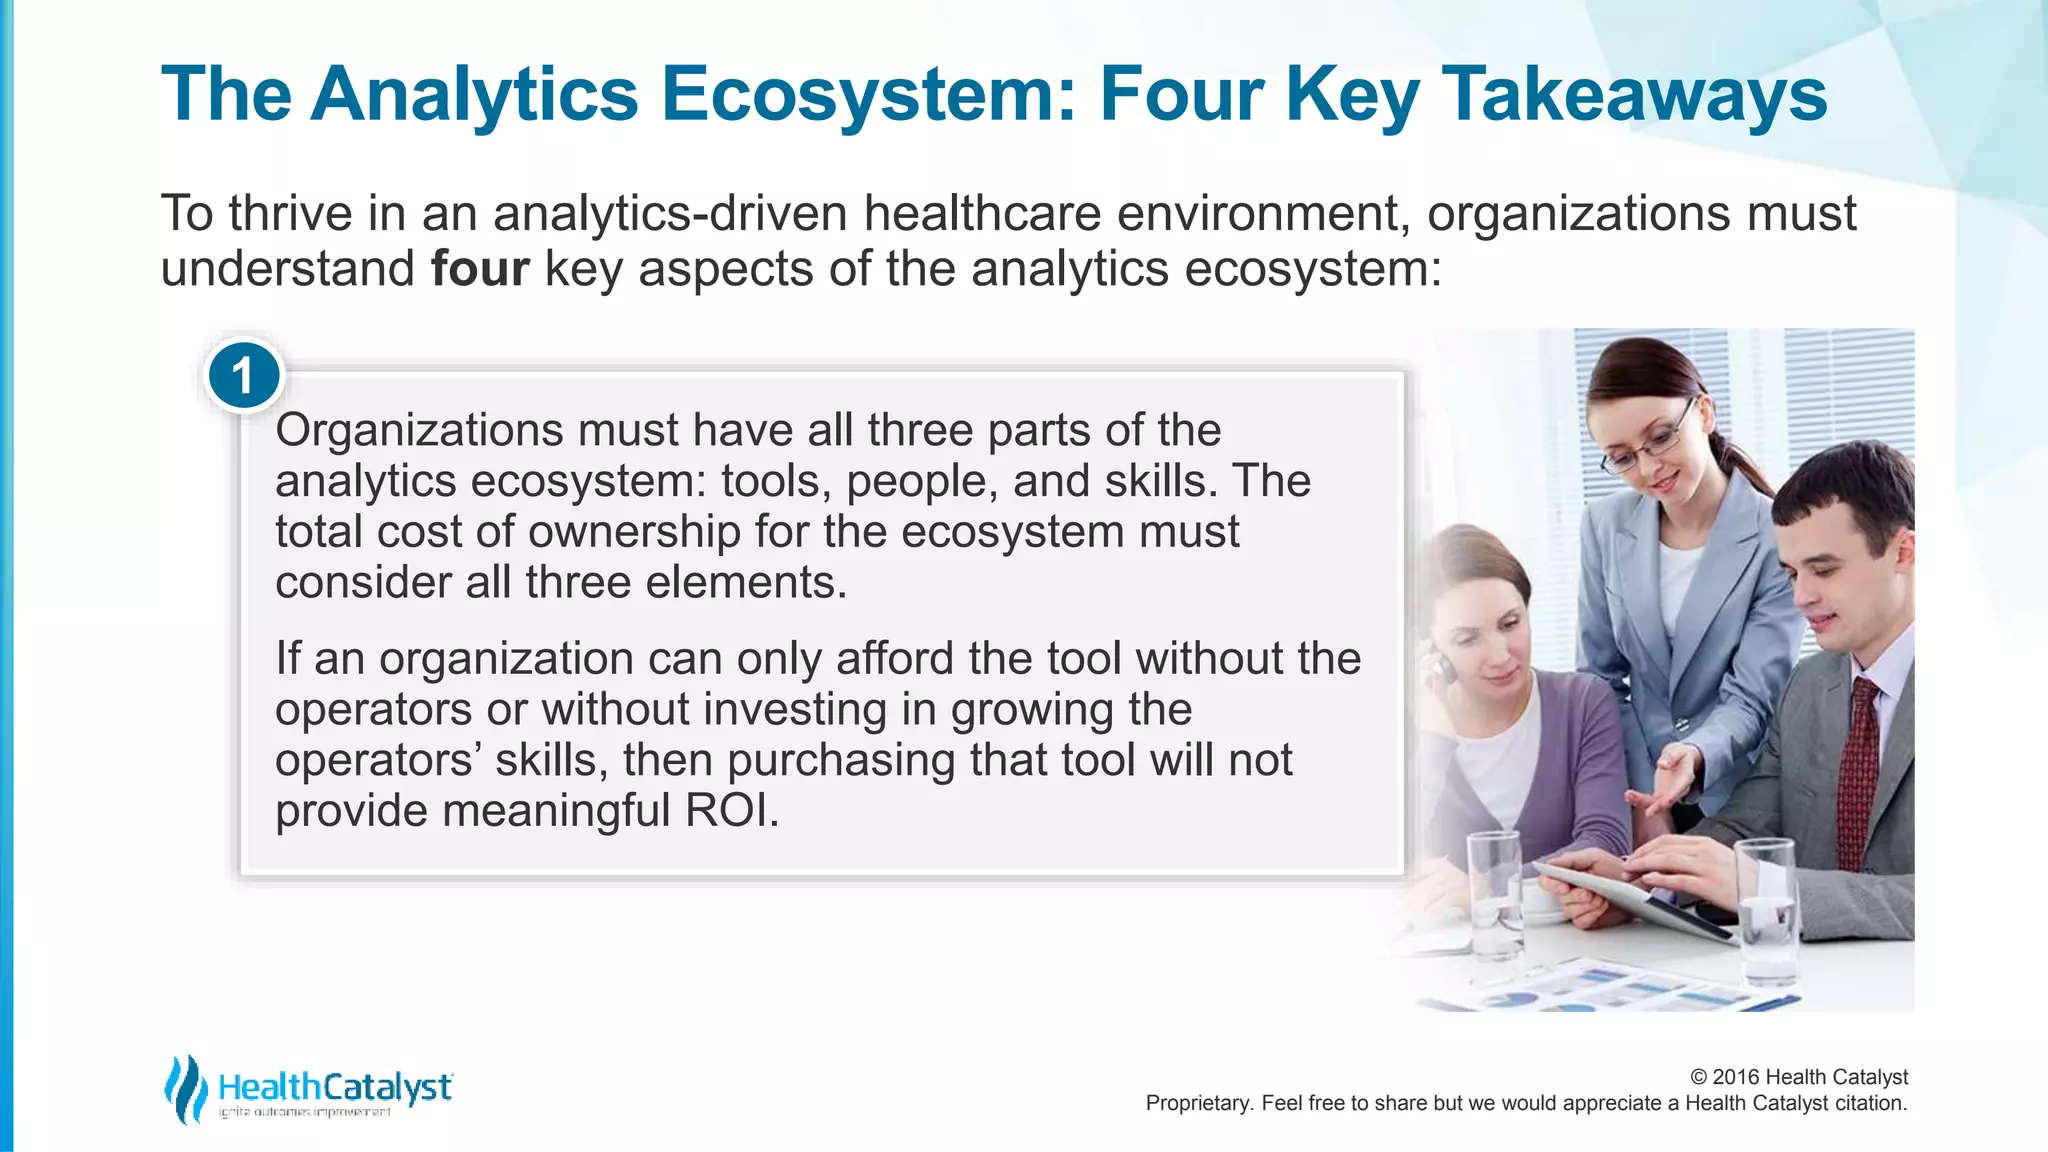
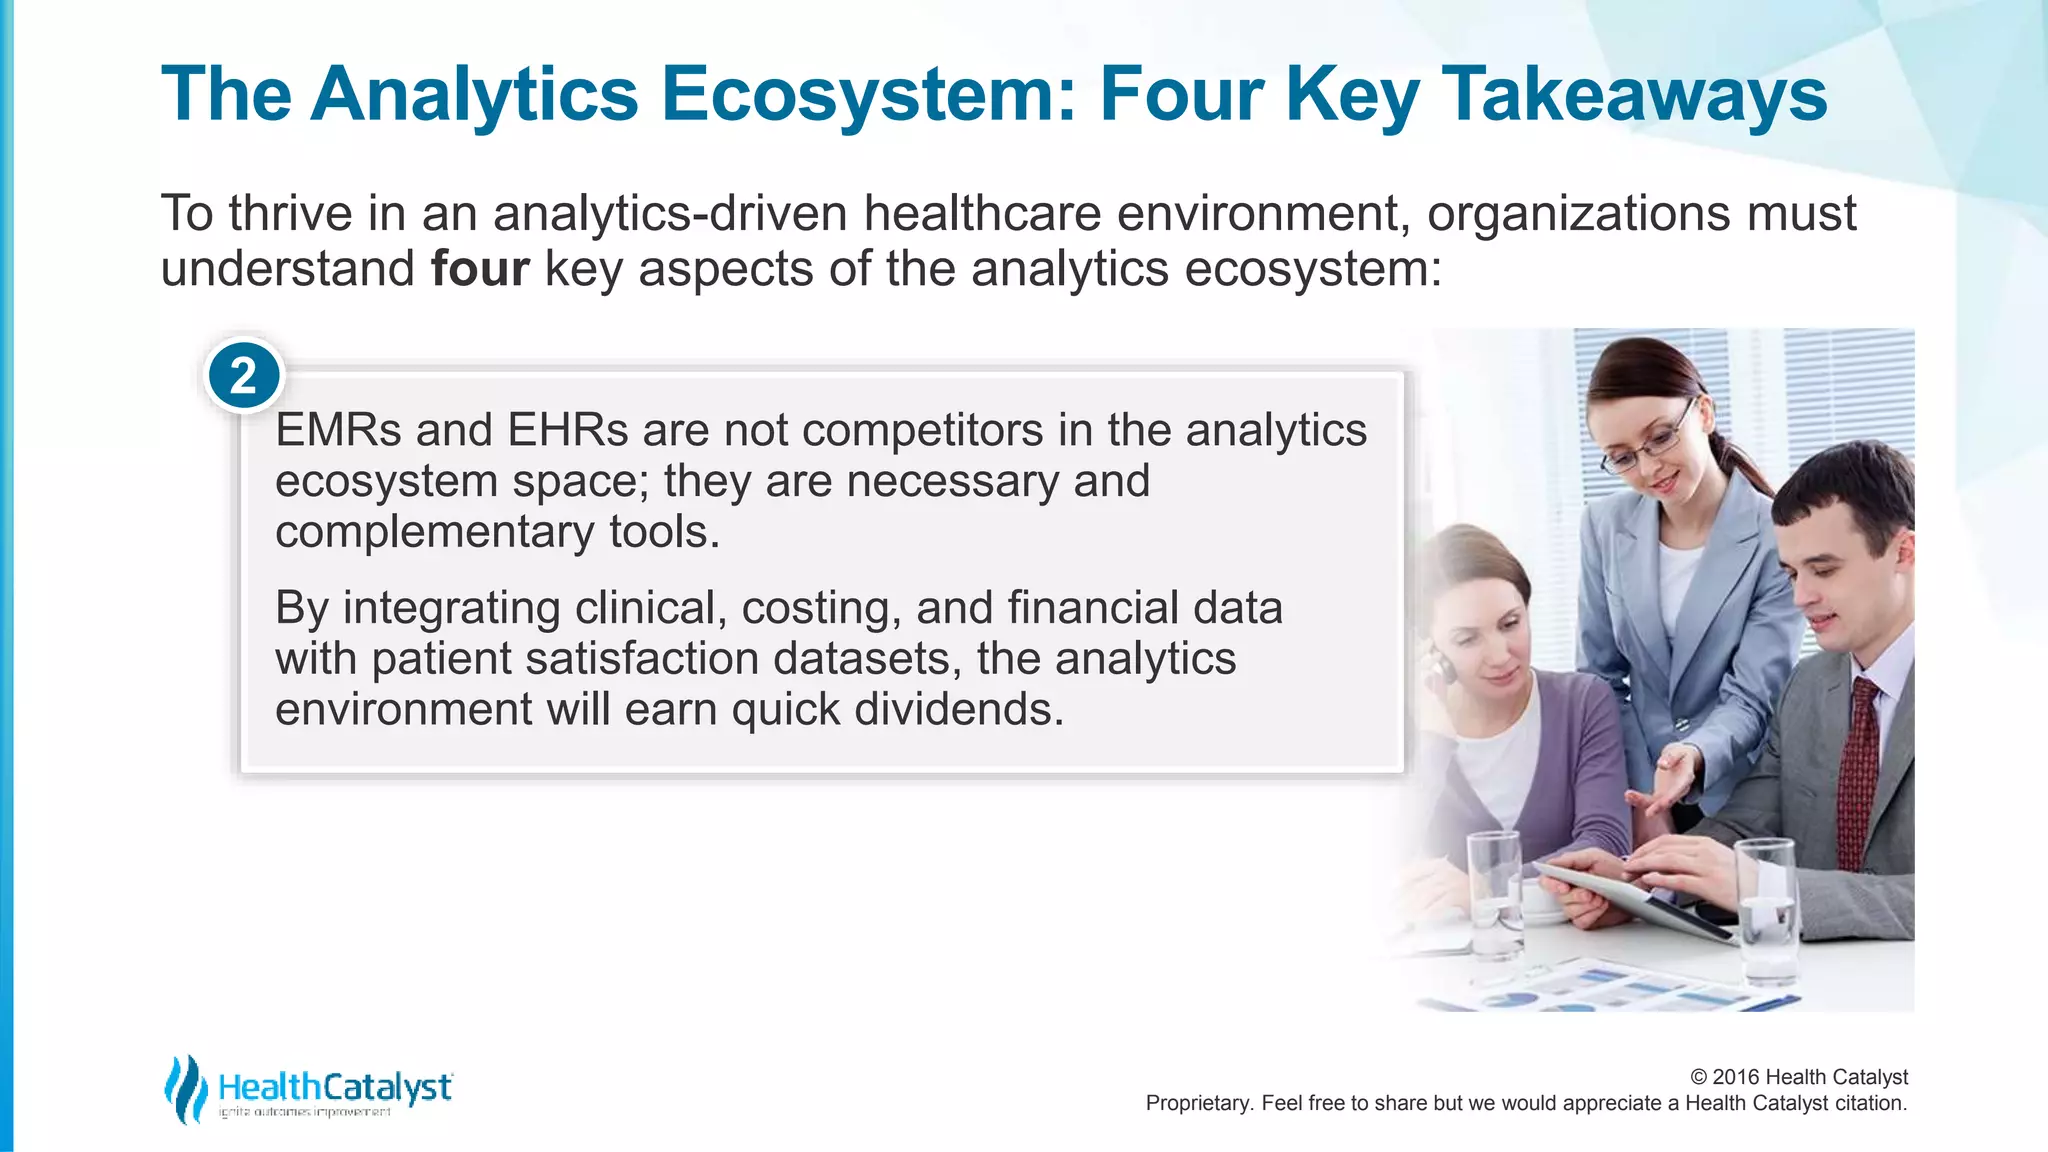
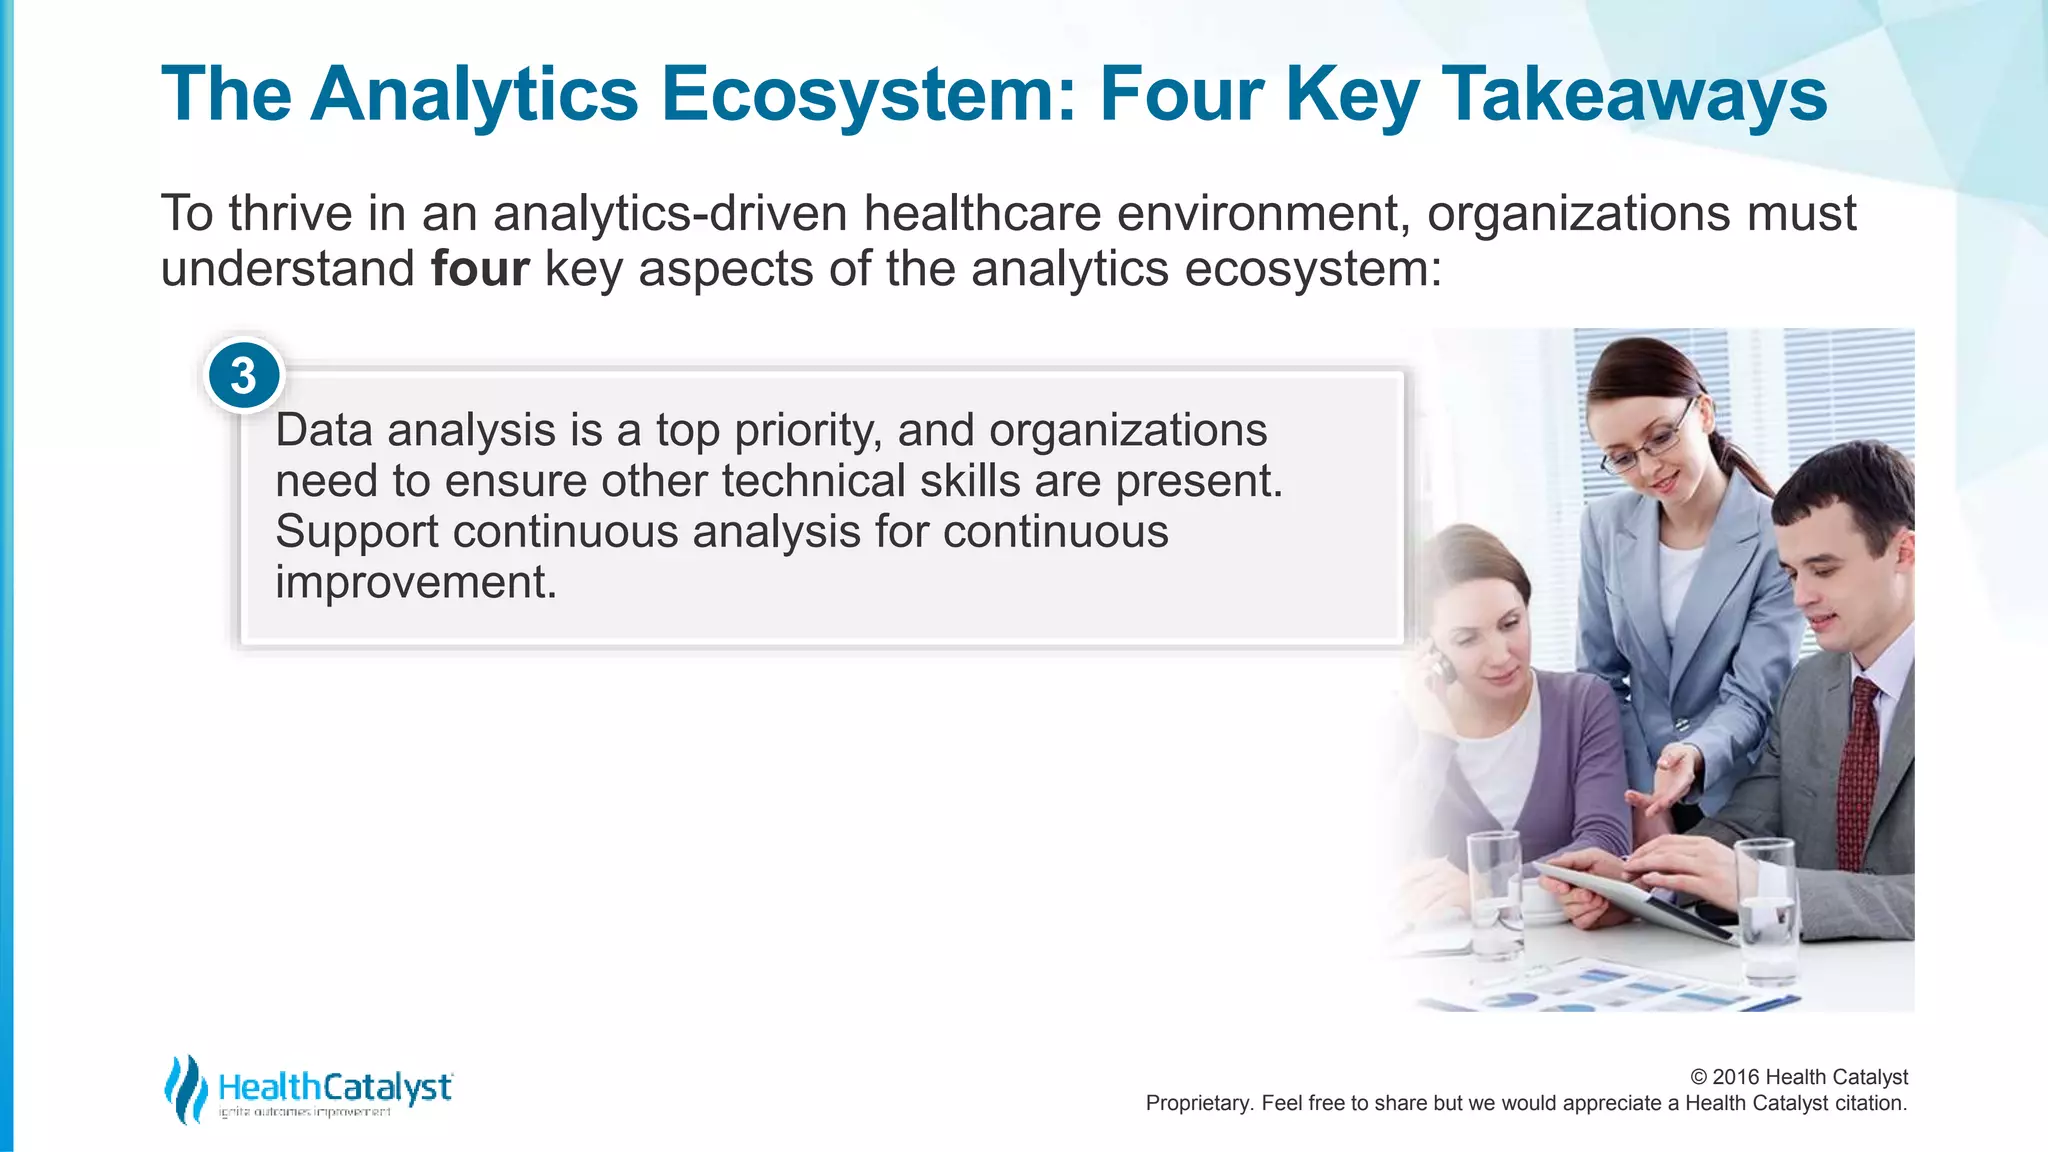
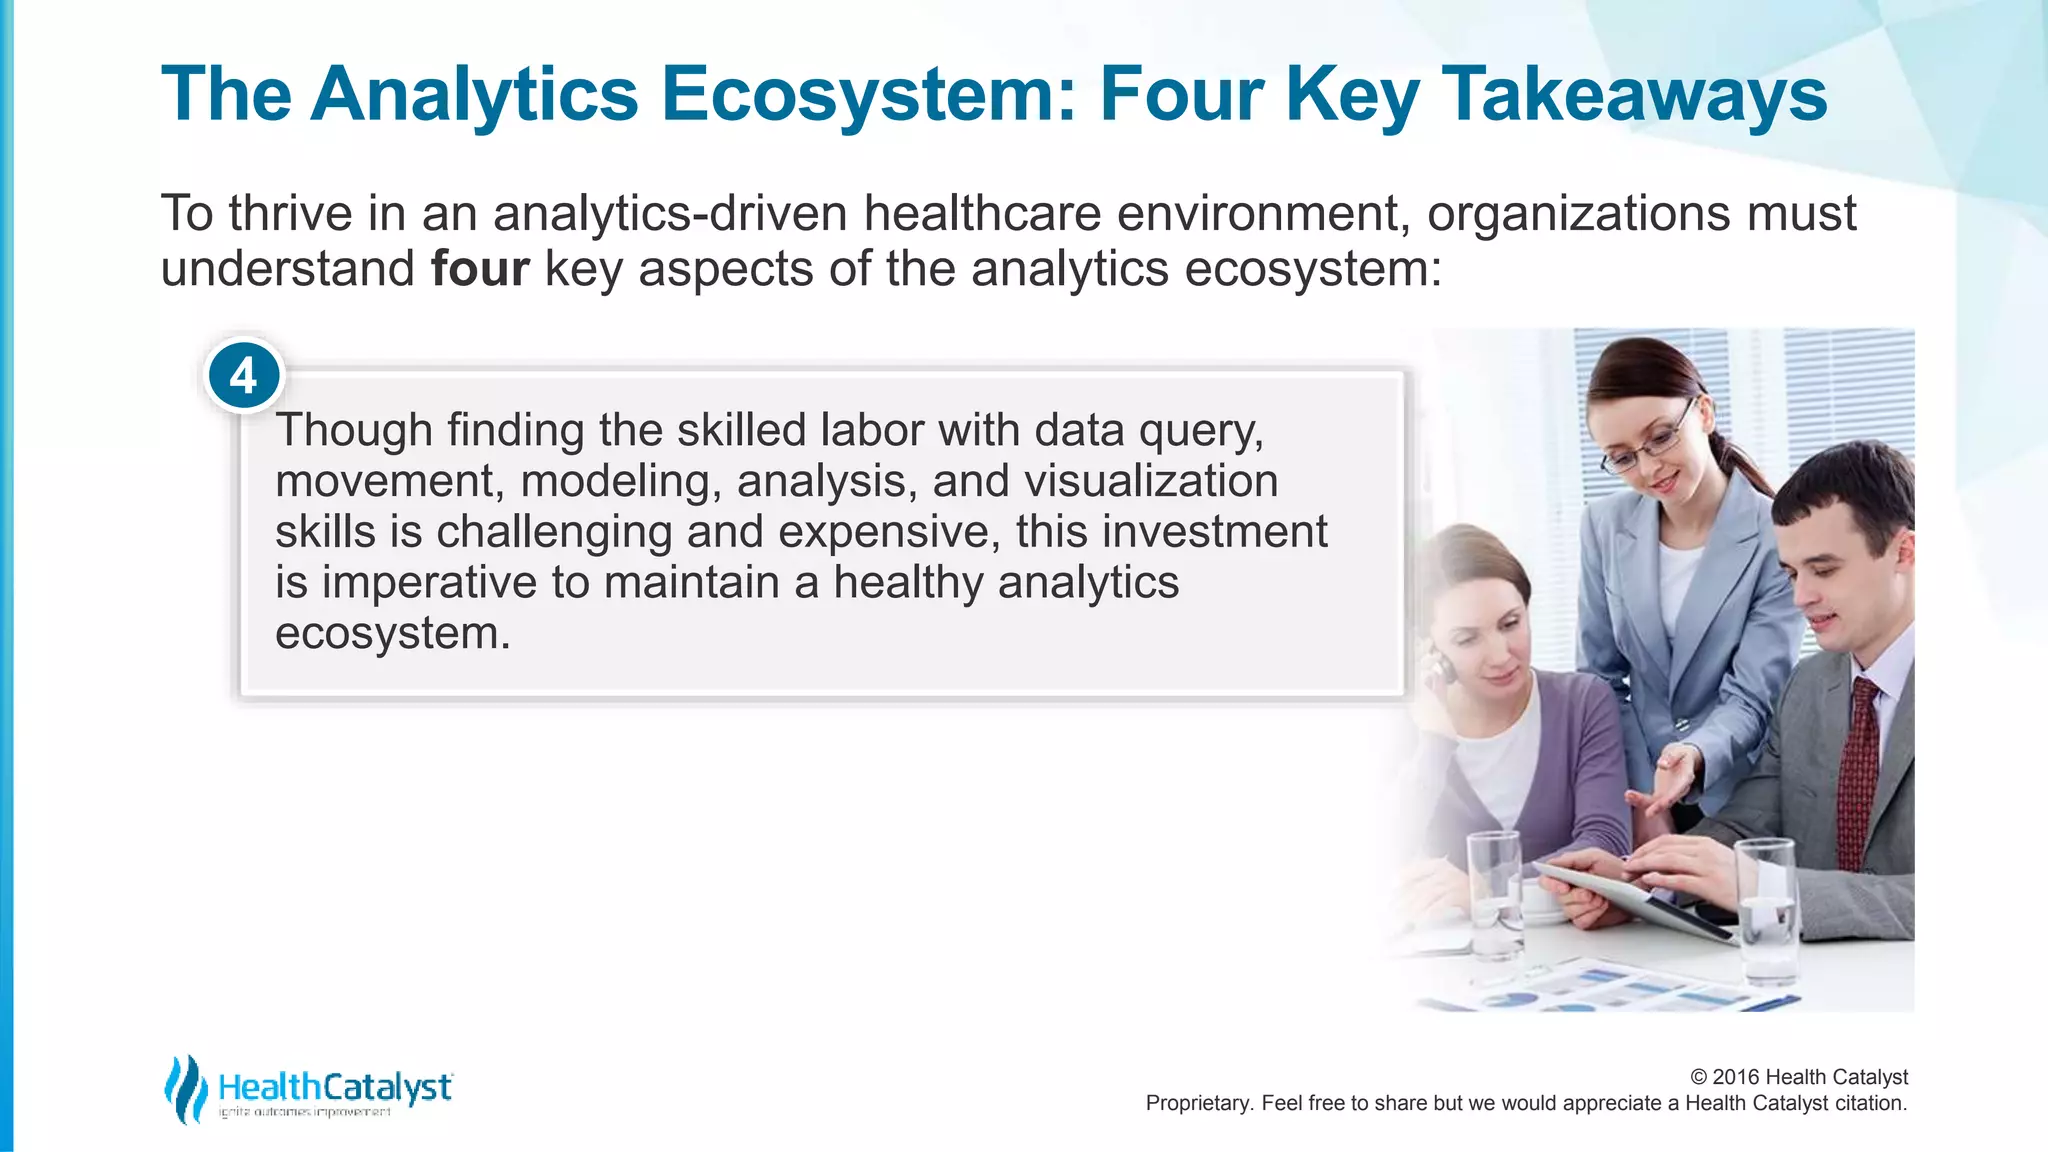
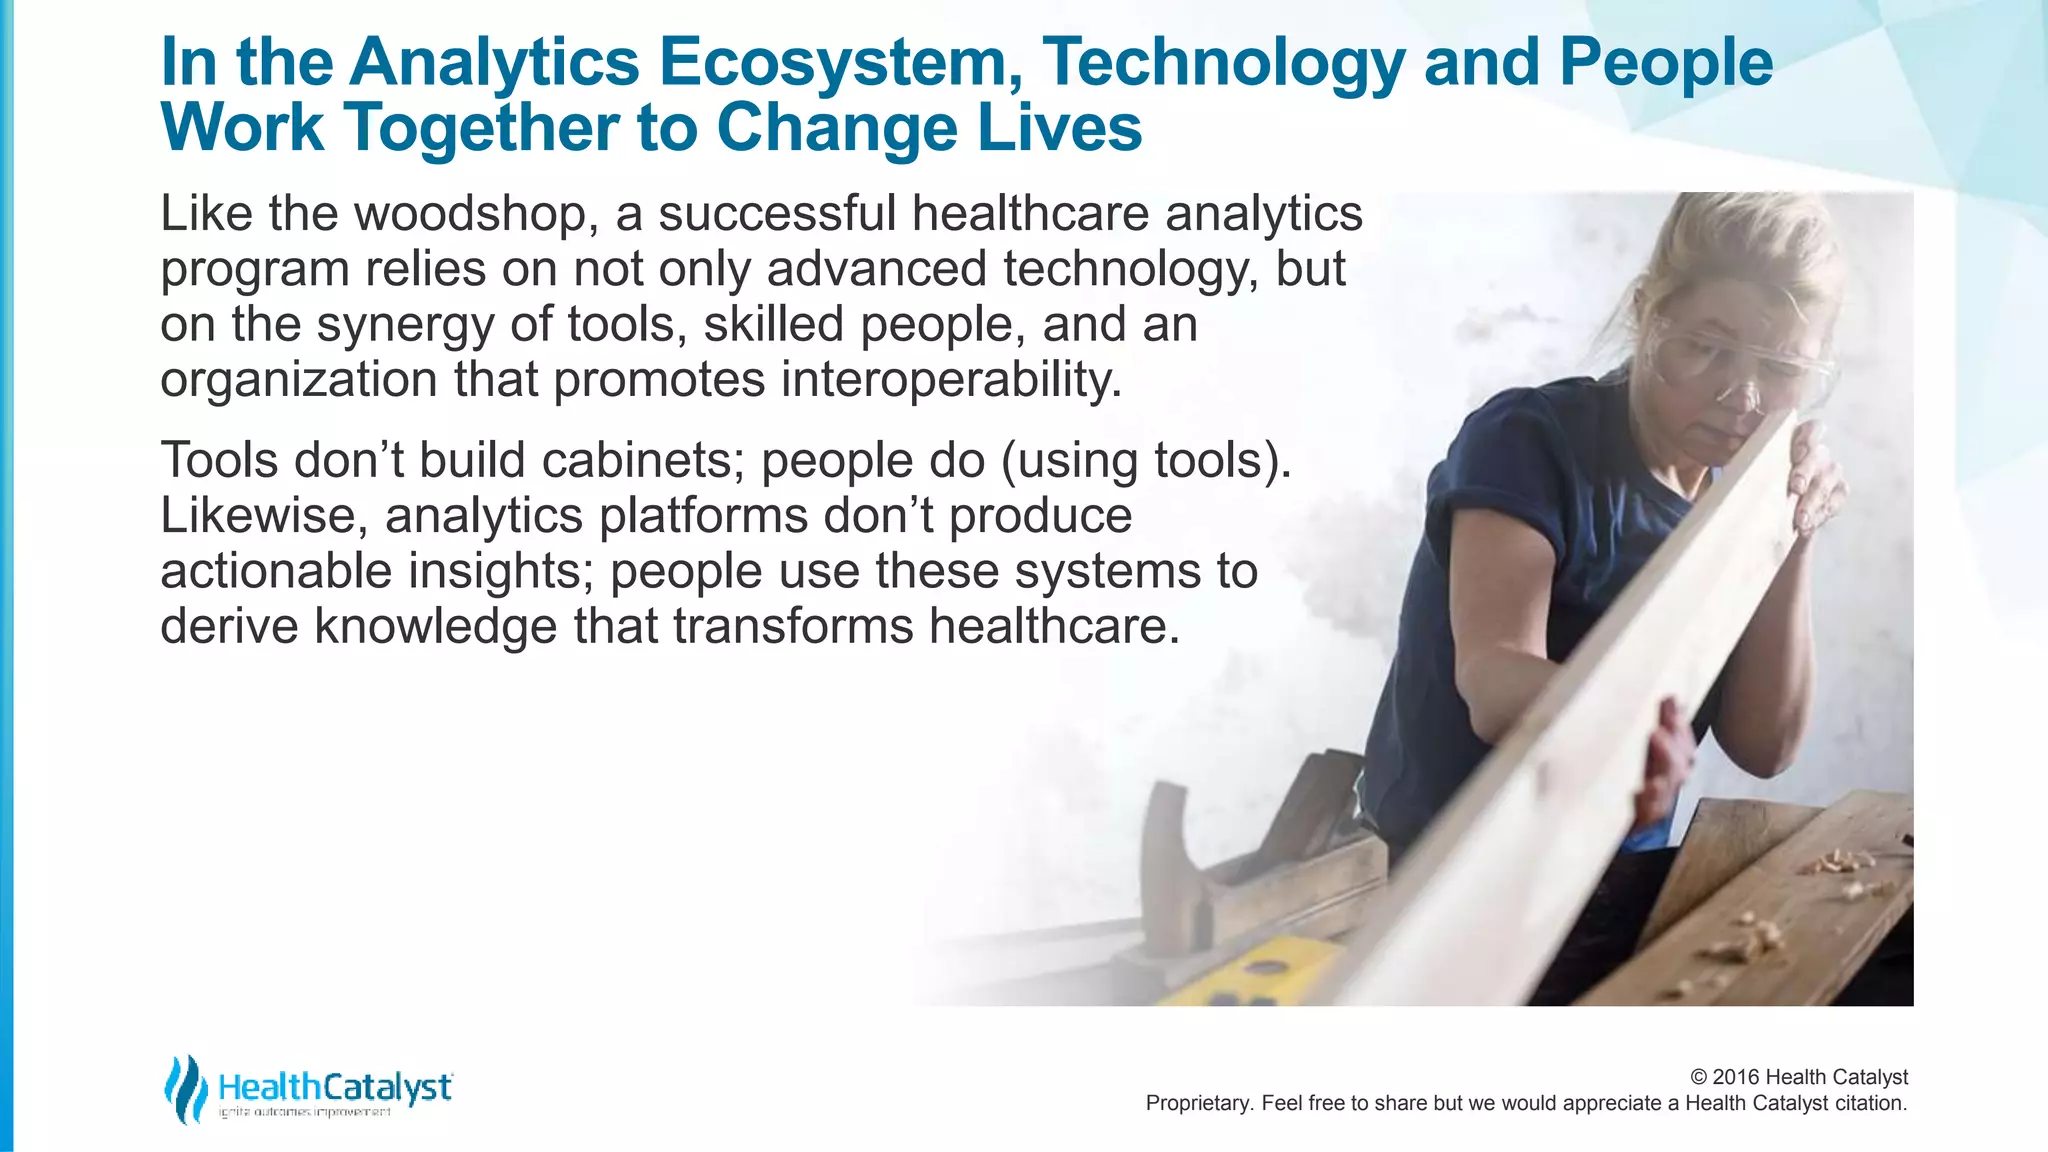
The Healthcare Analytics Ecosystem:
A Must-Have in Today’s Transformation
© 2016 Health Catalyst
Proprietary. Feel free to share but we would appreciate a Health Catalyst citation.
The Healthcare Analytics Ecosystem
The healthcare industry continues to welcome
advances in technology, but data analysts and
architects know that better IT tools alone won’t
help organizations achieve the Quadruple Aim.
Instead of relying disproportionately on tools,
healthcare organizations will reach the
Quadruple Aim by cultivating a rich analytics
ecosystem—one with a synergy of technology,
highly skilled people in analyst roles, and an
organization that promotes interoperability.
Improve Health of Population
Enhancing Patient Experience
Reducing Costs
Reducing Clinician and
Staff Burnout
The Quadr uple Aim
© 2016 Health Catalyst
Proprietary. Feel free to share but we would appreciate a Health Catalyst citation.
The Healthcare Analytics Ecosystem
The woodworking industry provides a
straightforward example of a productive
ecosystem.
The tools and raw materials are
different in a woodshop compared to
a healthcare analytics ecosystem,
but the goal is the same: both entities
work to transform something rough
and undefined into a valuable
finished product.
© 2016 Health Catalyst
Proprietary. Feel free to share but we would appreciate a Health Catalyst citation.
Woodworking and Healthcare Analytics:
Both Thrive on Synergy
Woodworking runs as an ecosystem built on a synergy between sophisticated
tools, the people who operate them, and an efficient and dynamic process:
The woodworking process turns raw lumber into a
finished product (e.g., a cabinet); analytics turns
raw data into actionable insight.
Woodworking is step-by-step process, moving
incrementally improved parts from station to
station; the step-by-step analytics process
collects, shares, and analyzes data.
>
>
© 2016 Health Catalyst
Proprietary. Feel free to share but we would appreciate a Health Catalyst citation.
Woodworking and Healthcare Analytics:
Both Thrive on Synergy
In both woodworking and analytics, interoperability
is the seamless workflow from station to station or
step to step.
Interoperability is a function of the shop layout or
the analytics organizational structure. If the layout
enables projects to progress smoothly between
stations, the workflow is efficient and accurate.
Even the most advanced woodworking tools have
an operator (just like healthcare IT tools need a
skilled data analyst).
Both woodworking and data tools are automated to
reduce avoidable human error, but neither is
designed to operate without human supervision.
© 2016 Health Catalyst
Proprietary. Feel free to share but we would appreciate a Health Catalyst citation.
More than Tools:
Health Systems as Analytics Ecosystems
To thrive in a value-based, analytics-driven
environment, today’s healthcare
organizations must function as ecosystems.
Like a woodshop, the analytics ecosystem
includes a community and its environment
functioning as a unit, with each contributor’s
(whether human or technology) strength
affecting the end product.
© 2016 Health Catalyst
Proprietary. Feel free to share but we would appreciate a Health Catalyst citation.
More than Tools:
Health Systems as Analytics Ecosystems
Healthcare IT risks isolating itself from the
analytics ecosystem by focusing too heavily on
advances and new tools.
And by not focusing enough on the people with
the skills to effectively leverage these exciting
technologies and the environments in which
they work.
Like a woodshop without tool operators and an
efficient layout, the most advanced analytics
tools are useless without skilled people to run
them and an organization that supports the work.
© 2016 Health Catalyst
Proprietary. Feel free to share but we would appreciate a Health Catalyst citation.
More than Tools:
Health Systems as Analytics Ecosystems
Five main parts
make up the
analytics
ecosystem:
© 2016 Health Catalyst
Proprietary. Feel free to share but we would appreciate a Health Catalyst citation.
More than Tools:
Health Systems as Analytics Ecosystems
Part 1 – Must-Have Tools
Human capital is paramount in the analytics ecosystem,
and these highly skilled team members need the right
tools to turn raw data into actionable insights.
Fortunately, the must-have tools in the analytics
ecosystem are foundational technologies that many
health systems already have:
© 2016 Health Catalyst
Proprietary. Feel free to share but we would appreciate a Health Catalyst citation.
More than Tools:
Health Systems as Analytics Ecosystems
Part 1 – Must-Have Tools
1. An EMR to document the care delivered to a patient.
2. A costing tool to understand the actual cost of that care delivery.
3. A patient satisfaction tool to capture how the patient perceives
the overall care experience.
4. A billing and accounts receivable (AR) tool
to bill for services rendered and collect and
document payment received.
5. A data operating system (DOS™) to
empower the data from the previous
four transaction systems and put that
information onto a common platform
that can be used for analytics and more.
© 2016 Health Catalyst
Proprietary. Feel free to share but we would appreciate a Health Catalyst citation.
More than Tools:
Health Systems as Analytics Ecosystems
Part 1 – Must-Have Tools
IT Tools Are Important; The Inordinate Spend on Them Is Not
Health systems must have the five technologies described
above to build out their analytics ecosystem; they don’t,
however, have to spend an inordinate portion of their
IT budgets to do this.
Organizations that spend too much on certain tools
end up with an imbalance in their analytics ecosystem
and executive pressure to maximize that investment.
This can lead to misguided recommendations on
how the organization uses the technology.
Inordinate spending can also lead the organization
to neglect other technologies and the people
who support them.
© 2016 Health Catalyst
Proprietary. Feel free to share but we would appreciate a Health Catalyst citation.
More than Tools:
Health Systems as Analytics Ecosystems
Part 1 – Must-Have Tools
IT Tools Are Important; The Inordinate Spend on Them Is Not
Inordinate spending is a common pitfall of EMR
rollouts, as some organizations place more
importance on the EMR than other tools.
While the EMR is critical to care delivery and
improvement, it should be a part of the analytics
ecosystem, not the entire ecosystem.
© 2016 Health Catalyst
Proprietary. Feel free to share but we would appreciate a Health Catalyst citation.
More than Tools:
Health Systems as Analytics Ecosystems
Part 2 – People and Their Skills
The human side of the analytics ecosystem—the people and their
technical skills and contextual understanding of issues and
challenges—operate the tools to improve outcomes.
These people need five technical skills to drive
sustained outcomes improvement:
1. Data query.
2. Data movement.
3. Data modeling.
4. Data analysis.
5. Data visualization.
© 2016 Health Catalyst
Proprietary. Feel free to share but we would appreciate a Health Catalyst citation.
More than Tools:
Health Systems as Analytics Ecosystems
Part 2 – People and Their Skills
Technical skills alone provide limited value.
They need to be coupled with the knowledge
of where to find the multiple rich data
narratives that surround a patient encounter
(e.g., EMR, costing, and claims data).
Add to the skills a deep contextual
understanding of what the analytics are
measuring, and the skills gain
extraordinary value.
© 2016 Health Catalyst
Proprietary. Feel free to share but we would appreciate a Health Catalyst citation.
More than Tools:
Health Systems as Analytics Ecosystems
Part 2 – People and Their Skills
1. DATA QUERY
Data query, also known as structured
query language (SQL), is the language of
how data is stored within an organization’s
transaction system.
Data query allows analysts to explore the
relationships between data stored within
transaction systems and to establish
custom relationships between different
transaction systems (e.g., within an EDW
or big data in data lakes).
© 2016 Health Catalyst
Proprietary. Feel free to share but we would appreciate a Health Catalyst citation.
More than Tools:
Health Systems as Analytics Ecosystems
Part 2 – People and Their Skills
1. DATA QUERY
With data query, analysts can move beyond
the predefined structures a transaction
system comes with, and begin to answer
personalized questions about the
transaction data.
The ability to access and manipulate data
within their own systems gives organizations
more control over their analytics future.
© 2016 Health Catalyst
Proprietary. Feel free to share but we would appreciate a Health Catalyst citation.
More than Tools:
Health Systems as Analytics Ecosystems
Part 2 – People and Their Skills
2. DATA MOVEMENT
Data movement refers to the extract, transform, or load (ETL) portion of the
technical work. It has two objectives:
1: It brings together multiple
data narratives from
disparate sources that
previously have not talked
to one another.
Analysts can tell the right
story or a more complete
story than they can with
data from a single source.
2: It makes data more accessible. Data movement
is one of the most expensive parts of analytics
workflow, so users only want to move data to
make actionable information accessible, and do
so efficiently. Because the effort required for
data movement is a huge source of waste and
frustration for the majority of healthcare
analysts, health systems should embrace
technologies and practices with the lowest
possible expectations for data movement.
© 2016 Health Catalyst
Proprietary. Feel free to share but we would appreciate a Health Catalyst citation.
More than Tools:
Health Systems as Analytics Ecosystems
Part 2 – People and Their Skills
3. DATA MODELING
Data modeling takes a real-world concept
and builds a virtual proxy for it in a database.
For example, how might a database
represent someone as having diabetes?
What would the database use in terms of
data to represent such a cohort?
Are there specific codes that could be
leveraged, such as international classification
of diseases (ICD) 9/10 or current procedural
terminology (CPT) codes that would qualify
or exclude someone from the registry?
© 2016 Health Catalyst
Proprietary. Feel free to share but we would appreciate a Health Catalyst citation.
More than Tools:
Health Systems as Analytics Ecosystems
Part 2 – People and Their Skills
3. DATA MODELING
Best practice in data modeling stores logic at
the database level, making logic visible and
accessible to those in the organization who
need it (versus performing data modeling in
Excel, which has logic visible to only the
analyst who created it).
Making logic available to subject matter
experts for each measured domain, for
example, helps health systems design more
accurate and robust data models.
© 2016 Health Catalyst
Proprietary. Feel free to share but we would appreciate a Health Catalyst citation.
More than Tools:
Health Systems as Analytics Ecosystems
Part 2 – People and Their Skills
4. DATA ANALYSIS
Data analysis is about making information
accessible to the right people at the right time.
Data analysis relies on data query, movement,
and modeling.
Meaningful analysis requires deep
contextual understanding of the
processes being measured.
Analysis without contextual under-
standing puts an analytic effort
at risk of long-term credibility issues.
© 2016 Health Catalyst
Proprietary. Feel free to share but we would appreciate a Health Catalyst citation.
More than Tools:
Health Systems as Analytics Ecosystems
Part 2 – People and Their Skills
5. DATA VISUALIZATION
Most healthcare professionals interact with
an analytics platform through some sort of
visualization, such as reporting, key
products indicators (KPIs), dashboards, or
ad hoc reports.
Data visualization is the vehicle for broad
analytics adoption within an organization.
Most people who want information to help
them do their job don’t have the ability, time,
or interest in doing data query, movement,
modeling, or analysis.
© 2016 Health Catalyst
Proprietary. Feel free to share but we would appreciate a Health Catalyst citation.
More than Tools:
Health Systems as Analytics Ecosystems
Part 2 – People and Their Skills
5. DATA VISUALIZATION
The visualization step uses underlying data
models with their embedded cohorts, their
rules of inclusion or exclusion, and their
associated metrics.
Content is more important than how the
visualization looks.
Visualizations are only as good as the
understanding and the trust of the
underlying data.
© 2016 Health Catalyst
Proprietary. Feel free to share but we would appreciate a Health Catalyst citation.
More than Tools:
Health Systems as Analytics Ecosystems
Part 2 – People and Their Skills
5. DATA VISUALIZATION
Figure 1 on the next slide shows the
technical skills, data query, movement,
modeling, and analysis—described across
the X axis—and the level of proficiency with
that scale along a Y axis.
The colored bars represent different
rankings of skills: blue bars for a senior
analyst; red for midlevel analyst; and green
for each scale of junior analyst.
© 2016 Health Catalyst
Proprietary. Feel free to share but we would appreciate a Health Catalyst citation.
More than Tools:
Health Systems as Analytics Ecosystems
Part 2 – People and Their Skills
Figure 1: Must-have technical skills for healthcare analysts.
© 2016 Health Catalyst
Proprietary. Feel free to share but we would appreciate a Health Catalyst citation.
More than Tools:
Health Systems as Analytics Ecosystems
Part 3 – Reactive, Descriptive, and Prescriptive Analytics
After establishing an understanding of the technical
skills needed for analysts to be effective, organizations
must understand the analytics work stream.
Figure 2 on the next slide shows the difference
between various analytics work streams (prescriptive,
descriptive, and reactive).
The rise along the Y axis represents an increase in
analytics complexity; the X axis has a compound axis,
a combination of the technical skills described above
and a contextual understanding of how analysts will
use that information.
© 2016 Health Catalyst
Proprietary. Feel free to share but we would appreciate a Health Catalyst citation.
More than Tools:
Health Systems as Analytics Ecosystems
Part 3 – Reactive, Descriptive, and Prescriptive Analytics
Figure 2: Differences between various analytic work streams.
© 2016 Health Catalyst
Proprietary. Feel free to share but we would appreciate a Health Catalyst citation.
More than Tools:
Health Systems as Analytics Ecosystems
Part 3 – Reactive, Descriptive, and Prescriptive Analytics
Reactive Analytics
Reactive analytics show counts of activities
or lists of patients.
They can include basic calculations on
industry-accepted metrics, such as a
diabetes admission.
Reactive analytics answer anticipated
questions; for example, a family practice
physician wants to know how many patients
with diabetes are on a panel.
© 2016 Health Catalyst
Proprietary. Feel free to share but we would appreciate a Health Catalyst citation.
More than Tools:
Health Systems as Analytics Ecosystems
Part 3 – Reactive, Descriptive, and Prescriptive Analytics
Reactive Analytics
Analysts can make minor adjustments to the
look and the feel of a reactive analytics report;
that’s the extent of customization, however,
because reactive analytics are generally
confined to a single source of data.
Reactive analytics fall short when the report
writer doesn’t have a solid contextual
understanding of the analytics they’re
measuring and why it matters.
© 2016 Health Catalyst
Proprietary. Feel free to share but we would appreciate a Health Catalyst citation.
More than Tools:
Health Systems as Analytics Ecosystems
Part 3 – Reactive, Descriptive, and Prescriptive Analytics
Reactive Analytics
Reactive analytics explain some of the what has
happened or what is happening, but they don’t
explain the why—that requires another level of
complexity (descriptive analytics).
© 2016 Health Catalyst
Proprietary. Feel free to share but we would appreciate a Health Catalyst citation.
More than Tools:
Health Systems as Analytics Ecosystems
Part 3 – Reactive, Descriptive, and Prescriptive Analytics
Descriptive Analytics
Descriptive analytics get users much closer to
addressing not just what is happening, but also why
it happened.
Analysts perform descriptive analytics outside the
vended systems—often within a dedicated analytics
environment, such as DOS or big data environment.
Descriptive analytics leverage highly customizable
data models.
© 2016 Health Catalyst
Proprietary. Feel free to share but we would appreciate a Health Catalyst citation.
More than Tools:
Health Systems as Analytics Ecosystems
Part 3 – Reactive, Descriptive, and Prescriptive Analytics
Descriptive Analytics
These data models are populated with multiple
sources of data (an EMR, claims, external lab,
professional billing, etc.), and the models are
organized around a common domain.
For example, data provisioning and integration efforts
in a DOS platform allow a more comprehensive view
of the activities within the entire health system.
Work in this arena is an ongoing and iterative process.
© 2016 Health Catalyst
Proprietary. Feel free to share but we would appreciate a Health Catalyst citation.
More than Tools:
Health Systems as Analytics Ecosystems
Part 3 – Reactive, Descriptive, and Prescriptive Analytics
Descriptive Analytics
If a health system is motivated by regulatory
penalties to reduce heart failure readmissions, it
can look to the CMS explicit definition of cohort and
readmission criteria.
Descriptive analytics leverages that CMS construct
to determine what gets loaded into the data model.
Clinicians will scour and approve available sources
to capture: diagnosis codes, admit discharge
codes, readmission windows, and patient types (as
defined by CMS).
© 2016 Health Catalyst
Proprietary. Feel free to share but we would appreciate a Health Catalyst citation.
More than Tools:
Health Systems as Analytics Ecosystems
Part 3 – Reactive, Descriptive, and Prescriptive Analytics
Prescriptive Analytics
Prescriptive analytics make it clear that issue
warrants intervention.
Once analysts understand the root cause of
an issue, they can begin to identify
interventions for meaningful change.
Sustained prescriptive analytics require
technical and domain experts to work
side by side in permanent teams.
© 2016 Health Catalyst
Proprietary. Feel free to share but we would appreciate a Health Catalyst citation.
More than Tools:
Health Systems as Analytics Ecosystems
Part 4 – Matching Technical Skills to Analytics Work Streams
Each analytics work stream relies on a certain
combination of the core technical skills of data
query, movement, modeling, analysis, and
visualization.
Figure 3 on the next slide shows the required
technical skill by analytics work stream.
© 2016 Health Catalyst
Proprietary. Feel free to share but we would appreciate a Health Catalyst citation.
More than Tools:
Health Systems as Analytics Ecosystems
Part 4 – Matching Technical Skills to Analytics Work Streams
Figure 3: Required technical skill by analytics work stream.
© 2016 Health Catalyst
Proprietary. Feel free to share but we would appreciate a Health Catalyst citation.
More than Tools:
Health Systems as Analytics Ecosystems
Part 4 – Matching Technical Skills to Analytics Work Streams
Certain skills are associated with each work stream.
In Figure 3, each bar color corresponds to an
associated skill and makes three important points
about technical skills in the analytics work stream:
• Reactive analytics are an entry point along this analytics
continuum.
• Skill levels vary across the analytic streams, but all skills are
necessary to effectively accomplish the work.
• Analysts need high levels of both skill and contextual
understanding to effectively prescribe a course of
action using analytics.
© 2016 Health Catalyst
Proprietary. Feel free to share but we would appreciate a Health Catalyst citation.
More than Tools:
Health Systems as Analytics Ecosystems
Part 4 – Matching Technical Skills to Analytics Work Streams
Matching skill with expected labor output is critical in maintaining workflow.
Bad things happen when skill and output
are mismatched—when team members
are in situations where they’re not
challenged or don’t have necessary skill
to accomplish the work.
Team members who aren’t challenged
may become disengaged because they’re
accomplishing tasks too easily.
© 2016 Health Catalyst
Proprietary. Feel free to share but we would appreciate a Health Catalyst citation.
More than Tools:
Health Systems as Analytics Ecosystems
Part 4 – Matching Technical Skills to Analytics Work Streams
A large integrated health system recently worked
with a systems vendor to assess its intake process
for analytics requests and its organization of
analytics work.
The health system findings were similar to those
from other comparable organizations:
• In the reactive analytic space, the technical staff
was performing work well beneath its abilities.
• In the descriptive space, the team was
attempting work largely beyond its abilities.
• The skill gap in the predictive space was even
more evident.
© 2016 Health Catalyst
Proprietary. Feel free to share but we would appreciate a Health Catalyst citation.
More than Tools:
Health Systems as Analytics Ecosystems
Part 5 – Interoperability
Interoperability is a byproduct of the analytic work streams
(the analytics equivalent of the wood shop layout).
Each work stream requires the skilled labor to
understand not only its role, but also its role
relative to the work streams surrounding it.
That can only happen if leadership responsible
for the overall analytics space can effectively
appreciate the analytics continuum: the
reactive space, the descriptive space, and
the prescriptive space.
© 2016 Health Catalyst
Proprietary. Feel free to share but we would appreciate a Health Catalyst citation.
More than Tools:
Health Systems as Analytics Ecosystems
Part 5 – Interoperability
Interoperability is a function of the tools and
the work stream layout.
If leadership fails to identify and stitch
together the seams of these analytics work
streams, these teams will forever run up
against one another in a competitive way,
killing analytics interoperability.
The organization should reflect years of
combined experience and months of
deliberate planning.
© 2016 Health Catalyst
Proprietary. Feel free to share but we would appreciate a Health Catalyst citation.
The Analytics Ecosystem: Four Key Takeaways
To thrive in an analytics-driven healthcare environment, organizations must
understand four key aspects of the analytics ecosystem:
Organizations must have all three parts of the
analytics ecosystem: tools, people, and skills. The
total cost of ownership for the ecosystem must
consider all three elements.
If an organization can only afford the tool without the
operators or without investing in growing the
operators’ skills, then purchasing that tool will not
provide meaningful ROI.
1
© 2016 Health Catalyst
Proprietary. Feel free to share but we would appreciate a Health Catalyst citation.
The Analytics Ecosystem: Four Key Takeaways
To thrive in an analytics-driven healthcare environment, organizations must
understand four key aspects of the analytics ecosystem:
EMRs and EHRs are not competitors in the analytics
ecosystem space; they are necessary and
complementary tools.
By integrating clinical, costing, and financial data
with patient satisfaction datasets, the analytics
environment will earn quick dividends.
2
© 2016 Health Catalyst
Proprietary. Feel free to share but we would appreciate a Health Catalyst citation.
The Analytics Ecosystem: Four Key Takeaways
To thrive in an analytics-driven healthcare environment, organizations must
understand four key aspects of the analytics ecosystem:
Data analysis is a top priority, and organizations
need to ensure other technical skills are present.
Support continuous analysis for continuous
improvement.
3
© 2016 Health Catalyst
Proprietary. Feel free to share but we would appreciate a Health Catalyst citation.
The Analytics Ecosystem: Four Key Takeaways
To thrive in an analytics-driven healthcare environment, organizations must
understand four key aspects of the analytics ecosystem:
Though finding the skilled labor with data query,
movement, modeling, analysis, and visualization
skills is challenging and expensive, this investment
is imperative to maintain a healthy analytics
ecosystem.
4
© 2016 Health Catalyst
Proprietary. Feel free to share but we would appreciate a Health Catalyst citation.
In the Analytics Ecosystem, Technology and People
Work Together to Change Lives
An effective analytics ecosystem is made up of must-have tools;
qualified people with the right skills; reactive, descriptive, and
predictive analytics; matching technical skills to analytics work
streams; and interoperability.
Organizations that understand the value
of—and work hard to implement—this
analytics ecosystem will change lives
for the better by making high quality
information available to clinicians
and caregivers.
© 2016 Health Catalyst
Proprietary. Feel free to share but we would appreciate a Health Catalyst citation.
In the Analytics Ecosystem, Technology and People
Work Together to Change Lives
Like the woodshop, a successful healthcare analytics
program relies on not only advanced technology, but
on the synergy of tools, skilled people, and an
organization that promotes interoperability.
Tools don’t build cabinets; people do (using tools).
Likewise, analytics platforms don’t produce
actionable insights; people use these systems to
derive knowledge that transforms healthcare.
© 2016 Health Catalyst
Proprietary. Feel free to share but we would appreciate a Health Catalyst citation.
For more information:
“This book is a fantastic piece of work”
– Robert Lindeman MD, FAAP, Chief Physician Quality Officer
© 2016 Health Catalyst
Proprietary. Feel free to share but we would appreciate a Health Catalyst citation.
More about this topic
Link to original article for a more in-depth discussion.
The Healthcare Analytics Ecosystem: A Must-Have in Today’s Transformation
The Best Way to Maximize Healthcare Analytics ROI
Bobbi Brown, Senior VP; Leslie Hough Falk, Senior VP
4 Ways Healthcare Data Analysts Can Provide Their Full Value
Russ Staheli, Analytics, VP
How to Avoid the 3 Most Common Healthcare Analytics Pitfalls and Related Inefficiencies
Russ Staheli, Analytics, VP
The Best Approach to Healthcare Analytics
Tom Burton, Senior VP and Co-Founder
Driving Strategic Advantage Through Widespread Analytics Adoption
Health Catalyst Success Story
© 2016 Health Catalyst
Proprietary. Feel free to share but we would appreciate a Health Catalyst citation.
Joined Health Catalyst in September 2011 as a senior data architect. Prior to Health
Catalyst, he worked for Intermountain Healthcare and for ARUP Laboratories as a data
architect. John has a Master of Science degree in biomedical informatics from the
University of Utah, School of Medicine.
Other Clinical Quality Improvement Resources
Click to read additional information at www.healthcatalyst.com
John Wadsworth

The Healthcare Analytics Ecosystem: A Must-Have in Today’s Transformation

  • 1.
    The Healthcare AnalyticsEcosystem: A Must-Have in Today’s Transformation
  • 2.
    © 2016 HealthCatalyst Proprietary. Feel free to share but we would appreciate a Health Catalyst citation. The Healthcare Analytics Ecosystem The healthcare industry continues to welcome advances in technology, but data analysts and architects know that better IT tools alone won’t help organizations achieve the Quadruple Aim. Instead of relying disproportionately on tools, healthcare organizations will reach the Quadruple Aim by cultivating a rich analytics ecosystem—one with a synergy of technology, highly skilled people in analyst roles, and an organization that promotes interoperability. Improve Health of Population Enhancing Patient Experience Reducing Costs Reducing Clinician and Staff Burnout The Quadr uple Aim
  • 3.
    © 2016 HealthCatalyst Proprietary. Feel free to share but we would appreciate a Health Catalyst citation. The Healthcare Analytics Ecosystem The woodworking industry provides a straightforward example of a productive ecosystem. The tools and raw materials are different in a woodshop compared to a healthcare analytics ecosystem, but the goal is the same: both entities work to transform something rough and undefined into a valuable finished product.
  • 4.
    © 2016 HealthCatalyst Proprietary. Feel free to share but we would appreciate a Health Catalyst citation. Woodworking and Healthcare Analytics: Both Thrive on Synergy Woodworking runs as an ecosystem built on a synergy between sophisticated tools, the people who operate them, and an efficient and dynamic process: The woodworking process turns raw lumber into a finished product (e.g., a cabinet); analytics turns raw data into actionable insight. Woodworking is step-by-step process, moving incrementally improved parts from station to station; the step-by-step analytics process collects, shares, and analyzes data. > >
  • 5.
    © 2016 HealthCatalyst Proprietary. Feel free to share but we would appreciate a Health Catalyst citation. Woodworking and Healthcare Analytics: Both Thrive on Synergy In both woodworking and analytics, interoperability is the seamless workflow from station to station or step to step. Interoperability is a function of the shop layout or the analytics organizational structure. If the layout enables projects to progress smoothly between stations, the workflow is efficient and accurate. Even the most advanced woodworking tools have an operator (just like healthcare IT tools need a skilled data analyst). Both woodworking and data tools are automated to reduce avoidable human error, but neither is designed to operate without human supervision.
  • 6.
    © 2016 HealthCatalyst Proprietary. Feel free to share but we would appreciate a Health Catalyst citation. More than Tools: Health Systems as Analytics Ecosystems To thrive in a value-based, analytics-driven environment, today’s healthcare organizations must function as ecosystems. Like a woodshop, the analytics ecosystem includes a community and its environment functioning as a unit, with each contributor’s (whether human or technology) strength affecting the end product.
  • 7.
    © 2016 HealthCatalyst Proprietary. Feel free to share but we would appreciate a Health Catalyst citation. More than Tools: Health Systems as Analytics Ecosystems Healthcare IT risks isolating itself from the analytics ecosystem by focusing too heavily on advances and new tools. And by not focusing enough on the people with the skills to effectively leverage these exciting technologies and the environments in which they work. Like a woodshop without tool operators and an efficient layout, the most advanced analytics tools are useless without skilled people to run them and an organization that supports the work.
  • 8.
    © 2016 HealthCatalyst Proprietary. Feel free to share but we would appreciate a Health Catalyst citation. More than Tools: Health Systems as Analytics Ecosystems Five main parts make up the analytics ecosystem:
  • 9.
    © 2016 HealthCatalyst Proprietary. Feel free to share but we would appreciate a Health Catalyst citation. More than Tools: Health Systems as Analytics Ecosystems Part 1 – Must-Have Tools Human capital is paramount in the analytics ecosystem, and these highly skilled team members need the right tools to turn raw data into actionable insights. Fortunately, the must-have tools in the analytics ecosystem are foundational technologies that many health systems already have:
  • 10.
    © 2016 HealthCatalyst Proprietary. Feel free to share but we would appreciate a Health Catalyst citation. More than Tools: Health Systems as Analytics Ecosystems Part 1 – Must-Have Tools 1. An EMR to document the care delivered to a patient. 2. A costing tool to understand the actual cost of that care delivery. 3. A patient satisfaction tool to capture how the patient perceives the overall care experience. 4. A billing and accounts receivable (AR) tool to bill for services rendered and collect and document payment received. 5. A data operating system (DOS™) to empower the data from the previous four transaction systems and put that information onto a common platform that can be used for analytics and more.
  • 11.
    © 2016 HealthCatalyst Proprietary. Feel free to share but we would appreciate a Health Catalyst citation. More than Tools: Health Systems as Analytics Ecosystems Part 1 – Must-Have Tools IT Tools Are Important; The Inordinate Spend on Them Is Not Health systems must have the five technologies described above to build out their analytics ecosystem; they don’t, however, have to spend an inordinate portion of their IT budgets to do this. Organizations that spend too much on certain tools end up with an imbalance in their analytics ecosystem and executive pressure to maximize that investment. This can lead to misguided recommendations on how the organization uses the technology. Inordinate spending can also lead the organization to neglect other technologies and the people who support them.
  • 12.
    © 2016 HealthCatalyst Proprietary. Feel free to share but we would appreciate a Health Catalyst citation. More than Tools: Health Systems as Analytics Ecosystems Part 1 – Must-Have Tools IT Tools Are Important; The Inordinate Spend on Them Is Not Inordinate spending is a common pitfall of EMR rollouts, as some organizations place more importance on the EMR than other tools. While the EMR is critical to care delivery and improvement, it should be a part of the analytics ecosystem, not the entire ecosystem.
  • 13.
    © 2016 HealthCatalyst Proprietary. Feel free to share but we would appreciate a Health Catalyst citation. More than Tools: Health Systems as Analytics Ecosystems Part 2 – People and Their Skills The human side of the analytics ecosystem—the people and their technical skills and contextual understanding of issues and challenges—operate the tools to improve outcomes. These people need five technical skills to drive sustained outcomes improvement: 1. Data query. 2. Data movement. 3. Data modeling. 4. Data analysis. 5. Data visualization.
  • 14.
    © 2016 HealthCatalyst Proprietary. Feel free to share but we would appreciate a Health Catalyst citation. More than Tools: Health Systems as Analytics Ecosystems Part 2 – People and Their Skills Technical skills alone provide limited value. They need to be coupled with the knowledge of where to find the multiple rich data narratives that surround a patient encounter (e.g., EMR, costing, and claims data). Add to the skills a deep contextual understanding of what the analytics are measuring, and the skills gain extraordinary value.
  • 15.
    © 2016 HealthCatalyst Proprietary. Feel free to share but we would appreciate a Health Catalyst citation. More than Tools: Health Systems as Analytics Ecosystems Part 2 – People and Their Skills 1. DATA QUERY Data query, also known as structured query language (SQL), is the language of how data is stored within an organization’s transaction system. Data query allows analysts to explore the relationships between data stored within transaction systems and to establish custom relationships between different transaction systems (e.g., within an EDW or big data in data lakes).
  • 16.
    © 2016 HealthCatalyst Proprietary. Feel free to share but we would appreciate a Health Catalyst citation. More than Tools: Health Systems as Analytics Ecosystems Part 2 – People and Their Skills 1. DATA QUERY With data query, analysts can move beyond the predefined structures a transaction system comes with, and begin to answer personalized questions about the transaction data. The ability to access and manipulate data within their own systems gives organizations more control over their analytics future.
  • 17.
    © 2016 HealthCatalyst Proprietary. Feel free to share but we would appreciate a Health Catalyst citation. More than Tools: Health Systems as Analytics Ecosystems Part 2 – People and Their Skills 2. DATA MOVEMENT Data movement refers to the extract, transform, or load (ETL) portion of the technical work. It has two objectives: 1: It brings together multiple data narratives from disparate sources that previously have not talked to one another. Analysts can tell the right story or a more complete story than they can with data from a single source. 2: It makes data more accessible. Data movement is one of the most expensive parts of analytics workflow, so users only want to move data to make actionable information accessible, and do so efficiently. Because the effort required for data movement is a huge source of waste and frustration for the majority of healthcare analysts, health systems should embrace technologies and practices with the lowest possible expectations for data movement.
  • 18.
    © 2016 HealthCatalyst Proprietary. Feel free to share but we would appreciate a Health Catalyst citation. More than Tools: Health Systems as Analytics Ecosystems Part 2 – People and Their Skills 3. DATA MODELING Data modeling takes a real-world concept and builds a virtual proxy for it in a database. For example, how might a database represent someone as having diabetes? What would the database use in terms of data to represent such a cohort? Are there specific codes that could be leveraged, such as international classification of diseases (ICD) 9/10 or current procedural terminology (CPT) codes that would qualify or exclude someone from the registry?
  • 19.
    © 2016 HealthCatalyst Proprietary. Feel free to share but we would appreciate a Health Catalyst citation. More than Tools: Health Systems as Analytics Ecosystems Part 2 – People and Their Skills 3. DATA MODELING Best practice in data modeling stores logic at the database level, making logic visible and accessible to those in the organization who need it (versus performing data modeling in Excel, which has logic visible to only the analyst who created it). Making logic available to subject matter experts for each measured domain, for example, helps health systems design more accurate and robust data models.
  • 20.
    © 2016 HealthCatalyst Proprietary. Feel free to share but we would appreciate a Health Catalyst citation. More than Tools: Health Systems as Analytics Ecosystems Part 2 – People and Their Skills 4. DATA ANALYSIS Data analysis is about making information accessible to the right people at the right time. Data analysis relies on data query, movement, and modeling. Meaningful analysis requires deep contextual understanding of the processes being measured. Analysis without contextual under- standing puts an analytic effort at risk of long-term credibility issues.
  • 21.
    © 2016 HealthCatalyst Proprietary. Feel free to share but we would appreciate a Health Catalyst citation. More than Tools: Health Systems as Analytics Ecosystems Part 2 – People and Their Skills 5. DATA VISUALIZATION Most healthcare professionals interact with an analytics platform through some sort of visualization, such as reporting, key products indicators (KPIs), dashboards, or ad hoc reports. Data visualization is the vehicle for broad analytics adoption within an organization. Most people who want information to help them do their job don’t have the ability, time, or interest in doing data query, movement, modeling, or analysis.
  • 22.
    © 2016 HealthCatalyst Proprietary. Feel free to share but we would appreciate a Health Catalyst citation. More than Tools: Health Systems as Analytics Ecosystems Part 2 – People and Their Skills 5. DATA VISUALIZATION The visualization step uses underlying data models with their embedded cohorts, their rules of inclusion or exclusion, and their associated metrics. Content is more important than how the visualization looks. Visualizations are only as good as the understanding and the trust of the underlying data.
  • 23.
    © 2016 HealthCatalyst Proprietary. Feel free to share but we would appreciate a Health Catalyst citation. More than Tools: Health Systems as Analytics Ecosystems Part 2 – People and Their Skills 5. DATA VISUALIZATION Figure 1 on the next slide shows the technical skills, data query, movement, modeling, and analysis—described across the X axis—and the level of proficiency with that scale along a Y axis. The colored bars represent different rankings of skills: blue bars for a senior analyst; red for midlevel analyst; and green for each scale of junior analyst.
  • 24.
    © 2016 HealthCatalyst Proprietary. Feel free to share but we would appreciate a Health Catalyst citation. More than Tools: Health Systems as Analytics Ecosystems Part 2 – People and Their Skills Figure 1: Must-have technical skills for healthcare analysts.
  • 25.
    © 2016 HealthCatalyst Proprietary. Feel free to share but we would appreciate a Health Catalyst citation. More than Tools: Health Systems as Analytics Ecosystems Part 3 – Reactive, Descriptive, and Prescriptive Analytics After establishing an understanding of the technical skills needed for analysts to be effective, organizations must understand the analytics work stream. Figure 2 on the next slide shows the difference between various analytics work streams (prescriptive, descriptive, and reactive). The rise along the Y axis represents an increase in analytics complexity; the X axis has a compound axis, a combination of the technical skills described above and a contextual understanding of how analysts will use that information.
  • 26.
    © 2016 HealthCatalyst Proprietary. Feel free to share but we would appreciate a Health Catalyst citation. More than Tools: Health Systems as Analytics Ecosystems Part 3 – Reactive, Descriptive, and Prescriptive Analytics Figure 2: Differences between various analytic work streams.
  • 27.
    © 2016 HealthCatalyst Proprietary. Feel free to share but we would appreciate a Health Catalyst citation. More than Tools: Health Systems as Analytics Ecosystems Part 3 – Reactive, Descriptive, and Prescriptive Analytics Reactive Analytics Reactive analytics show counts of activities or lists of patients. They can include basic calculations on industry-accepted metrics, such as a diabetes admission. Reactive analytics answer anticipated questions; for example, a family practice physician wants to know how many patients with diabetes are on a panel.
  • 28.
    © 2016 HealthCatalyst Proprietary. Feel free to share but we would appreciate a Health Catalyst citation. More than Tools: Health Systems as Analytics Ecosystems Part 3 – Reactive, Descriptive, and Prescriptive Analytics Reactive Analytics Analysts can make minor adjustments to the look and the feel of a reactive analytics report; that’s the extent of customization, however, because reactive analytics are generally confined to a single source of data. Reactive analytics fall short when the report writer doesn’t have a solid contextual understanding of the analytics they’re measuring and why it matters.
  • 29.
    © 2016 HealthCatalyst Proprietary. Feel free to share but we would appreciate a Health Catalyst citation. More than Tools: Health Systems as Analytics Ecosystems Part 3 – Reactive, Descriptive, and Prescriptive Analytics Reactive Analytics Reactive analytics explain some of the what has happened or what is happening, but they don’t explain the why—that requires another level of complexity (descriptive analytics).
  • 30.
    © 2016 HealthCatalyst Proprietary. Feel free to share but we would appreciate a Health Catalyst citation. More than Tools: Health Systems as Analytics Ecosystems Part 3 – Reactive, Descriptive, and Prescriptive Analytics Descriptive Analytics Descriptive analytics get users much closer to addressing not just what is happening, but also why it happened. Analysts perform descriptive analytics outside the vended systems—often within a dedicated analytics environment, such as DOS or big data environment. Descriptive analytics leverage highly customizable data models.
  • 31.
    © 2016 HealthCatalyst Proprietary. Feel free to share but we would appreciate a Health Catalyst citation. More than Tools: Health Systems as Analytics Ecosystems Part 3 – Reactive, Descriptive, and Prescriptive Analytics Descriptive Analytics These data models are populated with multiple sources of data (an EMR, claims, external lab, professional billing, etc.), and the models are organized around a common domain. For example, data provisioning and integration efforts in a DOS platform allow a more comprehensive view of the activities within the entire health system. Work in this arena is an ongoing and iterative process.
  • 32.
    © 2016 HealthCatalyst Proprietary. Feel free to share but we would appreciate a Health Catalyst citation. More than Tools: Health Systems as Analytics Ecosystems Part 3 – Reactive, Descriptive, and Prescriptive Analytics Descriptive Analytics If a health system is motivated by regulatory penalties to reduce heart failure readmissions, it can look to the CMS explicit definition of cohort and readmission criteria. Descriptive analytics leverages that CMS construct to determine what gets loaded into the data model. Clinicians will scour and approve available sources to capture: diagnosis codes, admit discharge codes, readmission windows, and patient types (as defined by CMS).
  • 33.
    © 2016 HealthCatalyst Proprietary. Feel free to share but we would appreciate a Health Catalyst citation. More than Tools: Health Systems as Analytics Ecosystems Part 3 – Reactive, Descriptive, and Prescriptive Analytics Prescriptive Analytics Prescriptive analytics make it clear that issue warrants intervention. Once analysts understand the root cause of an issue, they can begin to identify interventions for meaningful change. Sustained prescriptive analytics require technical and domain experts to work side by side in permanent teams.
  • 34.
    © 2016 HealthCatalyst Proprietary. Feel free to share but we would appreciate a Health Catalyst citation. More than Tools: Health Systems as Analytics Ecosystems Part 4 – Matching Technical Skills to Analytics Work Streams Each analytics work stream relies on a certain combination of the core technical skills of data query, movement, modeling, analysis, and visualization. Figure 3 on the next slide shows the required technical skill by analytics work stream.
  • 35.
    © 2016 HealthCatalyst Proprietary. Feel free to share but we would appreciate a Health Catalyst citation. More than Tools: Health Systems as Analytics Ecosystems Part 4 – Matching Technical Skills to Analytics Work Streams Figure 3: Required technical skill by analytics work stream.
  • 36.
    © 2016 HealthCatalyst Proprietary. Feel free to share but we would appreciate a Health Catalyst citation. More than Tools: Health Systems as Analytics Ecosystems Part 4 – Matching Technical Skills to Analytics Work Streams Certain skills are associated with each work stream. In Figure 3, each bar color corresponds to an associated skill and makes three important points about technical skills in the analytics work stream: • Reactive analytics are an entry point along this analytics continuum. • Skill levels vary across the analytic streams, but all skills are necessary to effectively accomplish the work. • Analysts need high levels of both skill and contextual understanding to effectively prescribe a course of action using analytics.
  • 37.
    © 2016 HealthCatalyst Proprietary. Feel free to share but we would appreciate a Health Catalyst citation. More than Tools: Health Systems as Analytics Ecosystems Part 4 – Matching Technical Skills to Analytics Work Streams Matching skill with expected labor output is critical in maintaining workflow. Bad things happen when skill and output are mismatched—when team members are in situations where they’re not challenged or don’t have necessary skill to accomplish the work. Team members who aren’t challenged may become disengaged because they’re accomplishing tasks too easily.
  • 38.
    © 2016 HealthCatalyst Proprietary. Feel free to share but we would appreciate a Health Catalyst citation. More than Tools: Health Systems as Analytics Ecosystems Part 4 – Matching Technical Skills to Analytics Work Streams A large integrated health system recently worked with a systems vendor to assess its intake process for analytics requests and its organization of analytics work. The health system findings were similar to those from other comparable organizations: • In the reactive analytic space, the technical staff was performing work well beneath its abilities. • In the descriptive space, the team was attempting work largely beyond its abilities. • The skill gap in the predictive space was even more evident.
  • 39.
    © 2016 HealthCatalyst Proprietary. Feel free to share but we would appreciate a Health Catalyst citation. More than Tools: Health Systems as Analytics Ecosystems Part 4 – Matching Technical Skills to Analytics Work Streams A large integrated health system recently worked with a systems vendor to assess its intake process for analytics requests and its organization of analytics work. The health system findings were similar to those from other comparable organizations: • In the reactive analytic space, the technical staff was performing work well beneath its abilities. • In the descriptive space, the team was attempting work largely beyond its abilities. • The skill gap in the predictive space was even more evident.
  • 40.
    © 2016 HealthCatalyst Proprietary. Feel free to share but we would appreciate a Health Catalyst citation. More than Tools: Health Systems as Analytics Ecosystems Part 5 – Interoperability Interoperability is a byproduct of the analytic work streams (the analytics equivalent of the wood shop layout). Each work stream requires the skilled labor to understand not only its role, but also its role relative to the work streams surrounding it. That can only happen if leadership responsible for the overall analytics space can effectively appreciate the analytics continuum: the reactive space, the descriptive space, and the prescriptive space.
  • 41.
    © 2016 HealthCatalyst Proprietary. Feel free to share but we would appreciate a Health Catalyst citation. More than Tools: Health Systems as Analytics Ecosystems Part 5 – Interoperability Interoperability is a function of the tools and the work stream layout. If leadership fails to identify and stitch together the seams of these analytics work streams, these teams will forever run up against one another in a competitive way, killing analytics interoperability. The organization should reflect years of combined experience and months of deliberate planning.
  • 42.
    © 2016 HealthCatalyst Proprietary. Feel free to share but we would appreciate a Health Catalyst citation. The Analytics Ecosystem: Four Key Takeaways To thrive in an analytics-driven healthcare environment, organizations must understand four key aspects of the analytics ecosystem: Organizations must have all three parts of the analytics ecosystem: tools, people, and skills. The total cost of ownership for the ecosystem must consider all three elements. If an organization can only afford the tool without the operators or without investing in growing the operators’ skills, then purchasing that tool will not provide meaningful ROI. 1
  • 43.
    © 2016 HealthCatalyst Proprietary. Feel free to share but we would appreciate a Health Catalyst citation. The Analytics Ecosystem: Four Key Takeaways To thrive in an analytics-driven healthcare environment, organizations must understand four key aspects of the analytics ecosystem: EMRs and EHRs are not competitors in the analytics ecosystem space; they are necessary and complementary tools. By integrating clinical, costing, and financial data with patient satisfaction datasets, the analytics environment will earn quick dividends. 2
  • 44.
    © 2016 HealthCatalyst Proprietary. Feel free to share but we would appreciate a Health Catalyst citation. The Analytics Ecosystem: Four Key Takeaways To thrive in an analytics-driven healthcare environment, organizations must understand four key aspects of the analytics ecosystem: Data analysis is a top priority, and organizations need to ensure other technical skills are present. Support continuous analysis for continuous improvement. 3
  • 45.
    © 2016 HealthCatalyst Proprietary. Feel free to share but we would appreciate a Health Catalyst citation. The Analytics Ecosystem: Four Key Takeaways To thrive in an analytics-driven healthcare environment, organizations must understand four key aspects of the analytics ecosystem: Though finding the skilled labor with data query, movement, modeling, analysis, and visualization skills is challenging and expensive, this investment is imperative to maintain a healthy analytics ecosystem. 4
  • 46.
    © 2016 HealthCatalyst Proprietary. Feel free to share but we would appreciate a Health Catalyst citation. In the Analytics Ecosystem, Technology and People Work Together to Change Lives An effective analytics ecosystem is made up of must-have tools; qualified people with the right skills; reactive, descriptive, and predictive analytics; matching technical skills to analytics work streams; and interoperability. Organizations that understand the value of—and work hard to implement—this analytics ecosystem will change lives for the better by making high quality information available to clinicians and caregivers.
  • 47.
    © 2016 HealthCatalyst Proprietary. Feel free to share but we would appreciate a Health Catalyst citation. In the Analytics Ecosystem, Technology and People Work Together to Change Lives Like the woodshop, a successful healthcare analytics program relies on not only advanced technology, but on the synergy of tools, skilled people, and an organization that promotes interoperability. Tools don’t build cabinets; people do (using tools). Likewise, analytics platforms don’t produce actionable insights; people use these systems to derive knowledge that transforms healthcare.
  • 48.
    © 2016 HealthCatalyst Proprietary. Feel free to share but we would appreciate a Health Catalyst citation. For more information: “This book is a fantastic piece of work” – Robert Lindeman MD, FAAP, Chief Physician Quality Officer
  • 49.
    © 2016 HealthCatalyst Proprietary. Feel free to share but we would appreciate a Health Catalyst citation. More about this topic Link to original article for a more in-depth discussion. The Healthcare Analytics Ecosystem: A Must-Have in Today’s Transformation The Best Way to Maximize Healthcare Analytics ROI Bobbi Brown, Senior VP; Leslie Hough Falk, Senior VP 4 Ways Healthcare Data Analysts Can Provide Their Full Value Russ Staheli, Analytics, VP How to Avoid the 3 Most Common Healthcare Analytics Pitfalls and Related Inefficiencies Russ Staheli, Analytics, VP The Best Approach to Healthcare Analytics Tom Burton, Senior VP and Co-Founder Driving Strategic Advantage Through Widespread Analytics Adoption Health Catalyst Success Story
  • 50.
    © 2016 HealthCatalyst Proprietary. Feel free to share but we would appreciate a Health Catalyst citation. Joined Health Catalyst in September 2011 as a senior data architect. Prior to Health Catalyst, he worked for Intermountain Healthcare and for ARUP Laboratories as a data architect. John has a Master of Science degree in biomedical informatics from the University of Utah, School of Medicine. Other Clinical Quality Improvement Resources Click to read additional information at www.healthcatalyst.com John Wadsworth