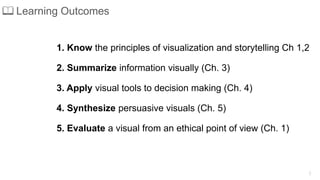
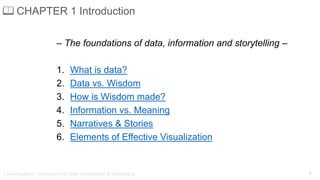
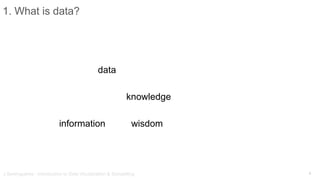
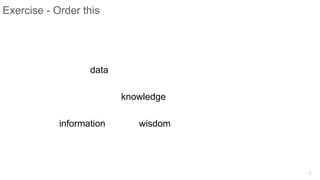
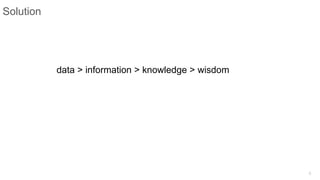
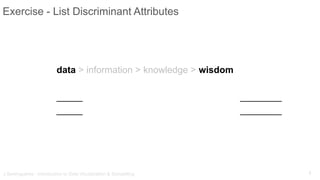
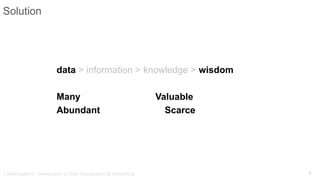
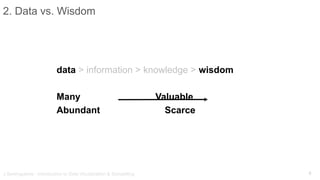
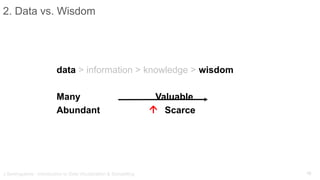
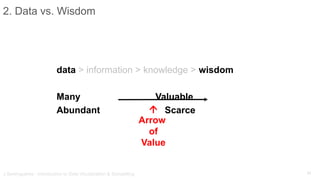
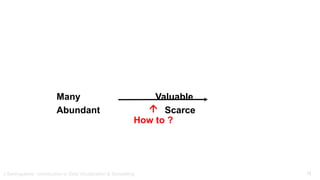
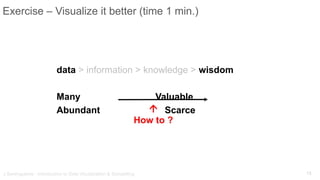
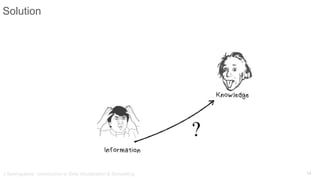
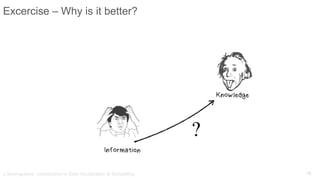
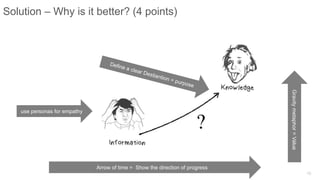
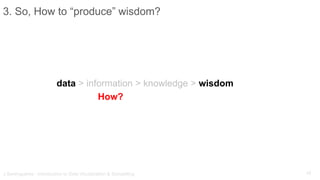
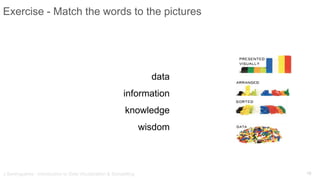
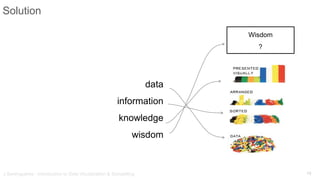
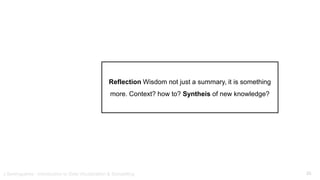
 BOOK SLIDES
1. Know the principles of visualization and storytelling Ch 1,2
2. Summarize information visually (Ch. 3)
3. Apply visual tools to decision making (Ch. 4)
4. Synthesize persuasive visuals (Ch. 5)
5. Evaluate a visual from an ethical point of view (Ch. 1)
📖 Learning Outcomes
2
– The foundations of data, information and storytelling –
1. What is data?
2. Data vs. Wisdom
3. How is Wisdom made?
4. Information vs. Meaning
5. Narratives & Stories
6. Elements of Effective Visualization
📖 CHAPTER 1 Introduction
3J Berengueres - Introduction to Data Visualization & Storytelling
data
knowledge
information wisdom
1. What is data?
J Berengueres - Introduction to Data Visualization & Storytelling 4
data
knowledge
information wisdom
Exercise - Order this
5
data > information > knowledge > wisdom
Solution
6
data > information > knowledge > wisdom
_____ ________
_____ ________
J Berengueres - Introduction to Data Visualization & Storytelling 7
Exercise - List Discriminant Attributes
data > information > knowledge > wisdom
Many Valuable
Abundant Scarce
J Berengueres - Introduction to Data Visualization & Storytelling 8
Solution
data > information > knowledge > wisdom
Many Valuable
Abundant Scarce
J Berengueres - Introduction to Data Visualization & Storytelling 9
2. Data vs. Wisdom
data > information > knowledge > wisdom
Many Valuable
Abundant Scarce
J Berengueres - Introduction to Data Visualization & Storytelling 10
2. Data vs. Wisdom

data > information > knowledge > wisdom
Many Valuable
Abundant Scarce
J Berengueres - Introduction to Data Visualization & Storytelling 11
2. Data vs. Wisdom

Arrow
of
Value
Many Valuable
Abundant Scarce
J Berengueres - Introduction to Data Visualization & Storytelling 12

How to ?
data > information > knowledge > wisdom
Many Valuable
Abundant Scarce
J Berengueres - Introduction to Data Visualization & Storytelling 13
Exercise – Visualize it better (time 1 min.)

How to ?
J Berengueres - Introduction to Data Visualization & Storytelling 14
Solution
J Berengueres - Introduction to Data Visualization & Storytelling 15
Excercise – Why is it better?
16
Solution – Why is it better? (4 points)
use personas for empathy
Gravitymetaphor=Value
Arrow of time = Show the direction of progress
J Berengueres - Introduction to Data Visualization & Storytelling 17
3. So, How to “produce” wisdom?
data > information > knowledge > wisdom
How?
J Berengueres - Introduction to Data Visualization & Storytelling 18
Exercise - Match the words to the pictures
data
information
knowledge
wisdom
J Berengueres - Introduction to Data Visualization & Storytelling 19
Solution
Wisdom
?
data
information
knowledge
wisdom
J Berengueres - Introduction to Data Visualization & Storytelling 20
Reflection Wisdom not just a summary, it is something
more. Context? how to? Syntheis of new knowledge?
J Berengueres - Introduction to Data Visualization & Storytelling 21
Exercise – Summarize the last 18 slides in 15 words
___________________________________
___________________________________
___________________________________
___________________________________
___________________________________
___________________________________
___________________________________
J Berengueres - Introduction to Data Visualization & Storytelling 22
Exercise – Now draw it!
J Berengueres - Introduction to Data Visualization & Storytelling 23
SHARE SOLUTIONS
J Berengueres - Introduction to Data Visualization & Storytelling 24
4. Info vs. Meaning
25
5. Narratives
26
Exercise
Identify:
Narrative
Story
Data
Call to action
27
Solution
28
Exercise
Summarize the relation between story,
narrative and data in a visual titled Elements
of Effective Visualization that uses an
Airbus360 as a story. Time 3 minutes.
29
Solution 1/2
Add:
Narrative
Story
Data
30
Solution 2/2

Introduction to data visualization and storytelling - Chapter 1 slides

  • 1.
  • 2.
    1. Know theprinciples of visualization and storytelling Ch 1,2 2. Summarize information visually (Ch. 3) 3. Apply visual tools to decision making (Ch. 4) 4. Synthesize persuasive visuals (Ch. 5) 5. Evaluate a visual from an ethical point of view (Ch. 1) 📖 Learning Outcomes 2
  • 3.
    – The foundationsof data, information and storytelling – 1. What is data? 2. Data vs. Wisdom 3. How is Wisdom made? 4. Information vs. Meaning 5. Narratives & Stories 6. Elements of Effective Visualization 📖 CHAPTER 1 Introduction 3J Berengueres - Introduction to Data Visualization & Storytelling
  • 4.
    data knowledge information wisdom 1. Whatis data? J Berengueres - Introduction to Data Visualization & Storytelling 4
  • 5.
  • 6.
    data > information> knowledge > wisdom Solution 6
  • 7.
    data > information> knowledge > wisdom _____ ________ _____ ________ J Berengueres - Introduction to Data Visualization & Storytelling 7 Exercise - List Discriminant Attributes
  • 8.
    data > information> knowledge > wisdom Many Valuable Abundant Scarce J Berengueres - Introduction to Data Visualization & Storytelling 8 Solution
  • 9.
    data > information> knowledge > wisdom Many Valuable Abundant Scarce J Berengueres - Introduction to Data Visualization & Storytelling 9 2. Data vs. Wisdom
  • 10.
    data > information> knowledge > wisdom Many Valuable Abundant Scarce J Berengueres - Introduction to Data Visualization & Storytelling 10 2. Data vs. Wisdom 
  • 11.
    data > information> knowledge > wisdom Many Valuable Abundant Scarce J Berengueres - Introduction to Data Visualization & Storytelling 11 2. Data vs. Wisdom  Arrow of Value
  • 12.
    Many Valuable Abundant Scarce JBerengueres - Introduction to Data Visualization & Storytelling 12  How to ?
  • 13.
    data > information> knowledge > wisdom Many Valuable Abundant Scarce J Berengueres - Introduction to Data Visualization & Storytelling 13 Exercise – Visualize it better (time 1 min.)  How to ?
  • 14.
    J Berengueres -Introduction to Data Visualization & Storytelling 14 Solution
  • 15.
    J Berengueres -Introduction to Data Visualization & Storytelling 15 Excercise – Why is it better?
  • 16.
    16 Solution – Whyis it better? (4 points) use personas for empathy Gravitymetaphor=Value Arrow of time = Show the direction of progress
  • 17.
    J Berengueres -Introduction to Data Visualization & Storytelling 17 3. So, How to “produce” wisdom? data > information > knowledge > wisdom How?
  • 18.
    J Berengueres -Introduction to Data Visualization & Storytelling 18 Exercise - Match the words to the pictures data information knowledge wisdom
  • 19.
    J Berengueres -Introduction to Data Visualization & Storytelling 19 Solution Wisdom ? data information knowledge wisdom
  • 20.
    J Berengueres -Introduction to Data Visualization & Storytelling 20 Reflection Wisdom not just a summary, it is something more. Context? how to? Syntheis of new knowledge?
  • 21.
    J Berengueres -Introduction to Data Visualization & Storytelling 21 Exercise – Summarize the last 18 slides in 15 words ___________________________________ ___________________________________ ___________________________________ ___________________________________ ___________________________________ ___________________________________ ___________________________________
  • 22.
    J Berengueres -Introduction to Data Visualization & Storytelling 22 Exercise – Now draw it!
  • 23.
    J Berengueres -Introduction to Data Visualization & Storytelling 23 SHARE SOLUTIONS
  • 24.
    J Berengueres -Introduction to Data Visualization & Storytelling 24 4. Info vs. Meaning
  • 25.
  • 26.
  • 27.
  • 28.
    28 Exercise Summarize the relationbetween story, narrative and data in a visual titled Elements of Effective Visualization that uses an Airbus360 as a story. Time 3 minutes.
  • 29.
  • 30.

Editor's Notes

  • #5 ✏️ Order this
  • #19 think out of box
  • #20 think out of box
  • #21 Reflection: Wisdom not just a summary, it is something more. Context? how to?
  • #22 Reflection: Wisdom not just a summary, it is something more. Context? how to?
  • #23 Reflection: Wisdom not just a summary, it is something more. Context? how to?
  • #24 Reflection: Wisdom not just a summary, it is something more. Context? how to?