1. CONTENTS
1.Introduction ....................................................................................Error! Bookmark not defined.
1.1.Prupose....................................................................................Error! Bookmark not defined.
1.2.Hydrogen ............................................................................................................................ 3
1.2.1.Hydrogen as a fuel......................................................................................................... 3
1.2.3.Hydrogen obtaining methods .......................................................................................... 6
1.2.3.Hydrogen transfer and storage........................................................................................ 7
1.3.Electomagnetic waves.......................................................................................................... 9
1.3.1.Electromagnetic spectrum.............................................................................................. 9
1.4.Cellulose ............................................................................................................................10
1.5.Photocatalyser....................................................................................................................10
1.5.1.Titaniumdioxide (TiO2).................................................................................................12
2.MATERIALS AND METHODS................................................................................................14
2.1.Materials............................................................................................................................14
2.2.Methods.............................................................................................................................14
2.2.1.Titaniumdioxide (TiO2) Surface Modification by Ag.......................................................14
2.2.2. The measurement of Ag-TiO2 Photocatalytic effect.......................................................16
2.2.3.UV-VIS Spectrophotometry ..........................................................................................16
2.2.4.Hydrogen Production From Cellulose by Photocatalytic Method .....................................17
3. RESULTS................................................................................................................................18
4.CONCLUSIONS AND DISCUSSION .......................................................................................21
5.COMMENTS..................................................................................Error! Bookmark not defined.
6.REFERENCES.........................................................................................................................22
2. HYDROGEN, THE FUTURE ENERGY, PRODUCTION FROM GREEN
WASTE BY PHOTOCATALYSIS VIA VISIBLE SOLAR SPECTRUM
1. INTRODUCTION
Progressively increasing population density and developing technology boosts energy
demand. Considering the limited fossil fuel reserves and environmental hazards such as air
pollution, climate changes and global warming, countries inevitably directed their energy
policies toward renewable energy sources. Hydrogen energy possesses distinct importance
among other renewable energy types including solar, wind and hydroelectric energies.
Although high production expenses seem to be a major disadvantage, hydrogen involves the
maximum amount of energy per unit mass among all fuels. Fuel cells, converting hydrogen to
the electricity, constitute an important place among future energy production sources.
Concerning the storage issue, sodium boron hydride generated from boron mineral is known
to be one of the hydrogen storage agents. Taken into account that our country involves the
70% of the boron reserves of the world and United Nations International Centre of Hydrogen
Energy Technologies (ICHET) is located in Istanbul, hydrogen energy comprising an
important place in the future of Turkey cannot be underestimated.
In recent studies, scientists have accomplished producing hydrogen gas from cellulose.
TiO2 Crystalline, as a photocatalyst, was doped with Platinum (Pt), Palladium (Pd), Nickel
(Ni), Gold (Au) metals and considerable amounts of hydrogen gas were generated. Though
the use of Pt metal was the most efficient, Ni metal was suggested due to high cost (Caravaca
et al., 2016; Zhang et al., 2015). Studies on the photocatalytic activity of TiO2 reported Ag
metal to be very efficient following Pt and Pd (Karakaş et al., 2008; Yurdakal et al., 2016).
Our project is a distinct one as we aim to obtain hydrogen gas from waste cellulose by using a
photocatalyzer that we produced by modifying Ag metal, cheaper than Platinum, to a less
costly surface (TiO2 crystalline was not doped). Hydrogen gas production from cellulose by
an Ag/TiO2 photocatalyzer would be a leading study in the literature.
1.1 Purpose
1) Modifying TiO2 surface, a photocatalyzer normally in the UV (Ultraviolet) region,
by Silver (Ag) nanoparticles in order to achieve photocatalytic effect in the visible
(VIS) region of the spectrum.
2) Obtaining hydrogen gas from cellulose (grass clippings), the most abundant
biopolymer worldwide, with the help of solar energy via modified Ag/TiO2
catalyzer.
3. 1.2. Hydrogen
Hydrogen, discovered in 1500s, constitutes the 75% of the mass and 90% of the total
number of atoms in universe and completely non-toxic, colorless, odorless hydrogen gas is
14.4 times lighter than the air. The sun is a star consisting of hydrogen. The energy earth
receives from the sun is the energy generated by the conversion of hydrogen into helium in
the fusion reactions. There are three isotopes of hydrogen in nature. These are 1H, 2H and 3H.
Hydrogen is a nonmetallic element with the atomic number of 1. H, containing 1 proton and
an electron, is the most abundant isotope in nature with 99.98 % availability. Another stable
isotope of hydrogen is 2H, which is known as deuterium. It has 1 proton and 1 neutron in its
atomic nucleus. Deuterium accounts for 0.0184% of hydrogen in the earth. It is not
radioactive. The 3H isotope is known as tritium and it contains 2 neutrons and 1 proton in its
atomic nucleus. It's a radioactive isotope. It has a half-life of 12.32 years and it decays into
Helium-3 with a beta decay reaction. Tritium exists in very small quantities and is produced
as a result of the interaction of cosmic rays and atmospheric gases. The boiling point of the
hydrogen with an average atomic mass of 1.00794 g/mol is 20.28 °K (-252.87 ° C) and its
density is 0.00008988 g/cm³ (0 °C, 101.325 kPa).
1.2.1. Hydrogen as a fuel
Hydrogen can be presented as “fuel” or “electricity” to the consumers. Hydrogen is a
secondary energy source. That is, it is not available in the nature; however, hydrogen is
produced via various energy sources. Electricity is an energy carrier that put its stamp on the
20th century. Hydrogen, on the other hand, is the one for 21st century.
Hydrogen is not hazardous as other gases because of its rapid dispersion property. In a
fire event, hydrogen gas rapidly burns and goes upward. Other gases and fuels, nevertheless,
cause also the blazing of their environments while burning. Whereas the thermal value of 1 kg
of liquefied hydrogen is 120 millions joule, the one of 1 kg of liquid plane fuel is 44 millions
joule. The thermal value of hydrogen is higher than all fuels. Due to that property, liquefied
hydrogen has been used in space shuttles (Aslan, 2007).
Hydrogen has the highest energy content per unit mass of all known fuels. One
kilogram of hydrogen involves the amount of energy of 2.1 kg of natural gas or 2.8 kg of
petroleum. It is more economical and efficient in several situations. However, the volume per
unit energy is quite high. Hydrogen can be produced using any energy source, including
renewable energy sources. Hydrogen can be stored in the gaseous form (large scale storage),
liquid form (air and space transport) or metal hydride form (vehicles and other small scale
storage). Hydrogen can be transported by pipelines or tankers at long distances. Hydrogen is
no more dangerous than other fuels although it requires different safety equipments and
procedures. Hydrogen takes its place in the safety order between propane and methane
(natural gas). Considering fire hazard and toxicity, hydrogen is the most reliable fuel.
Hydrogen does not produce any pollutants or harmful substances to the environment during
its production from electricity or solar energy, transmission, storage or use. Water is the only
end product as a result of the hydrogen combustion or consumption in the fuel cell (Şenaktaş,
2005). Hydrogen is one of the safest fuels with safety factor 1 in the safety assessment which
4. is made by considering features such as toxicity of the fuel itself and its combustion products,
diffusion coefficient and ignition energy. Safety factor of gasoline was calculated as 0.53 and
methane as 0.80. Comparison of the safety factors of hydrogen, gasoline and methane is
presented in Table-1, and the flash points and flammability rates of some gases in are shown
in Table-2 (Ultanır, 2004).
Table 1. Ranking of fuels according to the safety factors
Characteristics Gasoline Methane Hydrogen
Toxicity of the fuel 3 2 1
Toxicity of the
combustion products
(CO, NOx, SOx,)
3 2 1
Density 3 2 1
Diffusion Coefficient 3 2 1
Specific Heat 3 2 1
Ignition Level 1 2 3
Ignition Energy 2 1 3
Ignition Temperature 3 2 1
Flame Temperature 3 1 2
Boost Energy 3 2 1
Emissivity 3 2 1
Total Points 30 20 16
Safety Factors 0,53 0,80 1,00
(*)1 en emniyetli,2 daha az emniyetli, 3 en az emniyetli
Table-2 Flash points and flammability rates of some gases
1.2.2. Hydrogen Policies of Countries and Companies
In 1974, suggesting that hydrogen energy is the only energy to replace renewable and
fossil fuels, Prof. Dr. Nejat Veziroğlu has attracted the attention of the scientific world at the
5. International Conference on Hydrogen Economy attended by 700 scientists and started
working with a group of scientists. The United Nations (UN) has appointed itself as a
consultant on this issue. The UN has accepted the establishment of a 'central country' and
Turkey to be the central country.
The agreement related to the establishment of ICHET was signed between The
Republic of Turkey and United Nations Industrial Development Organization on 21 October
2003 in Vienne.
Turkey undertook a historic mission by hosting the United Nations International
Hydrogen Energy Technology Centre (UNIDO-ICHET) in Istanbul in May 2004. The aim of
UNIDO-ICHET is to be the bridge of hydrogen technology between developed and
developing countries, to develop hydrogen technologies, to promote the adoption and use in
Turkey and in the world and to carry out applied R&D studies. To ensure the feasibility and
the widespread use of this fuel, UNIDO-ICHET develops pilot projects in almost all
continents of the world, especially in developing countries. Among these are hydrogen
productions from hydroelectricity in China, from solar energy in Libya and from wind energy
in Argentina. Additionally, the production of hydrogen from wind energy in Bozcaada and the
operation of hydrogen fueled buses in Istanbul are taking place in Turkey. With the
establishment of ICHET in Istanbul, Turkey has become one of the leading countries to
provide clean, abundant and long-lasting energy for humanity (Kurtuluş and Ark., 2006).
In 2012, with the cooperation of Istanbul Metropolitan Municipality and UNIDO-
ICHET, Hyundai ix35 Fuel Cell vehicle was filled in the first hydrogen filling station in
Turkey. The Hyundai ix35 Fuel Cell was the first hydrogen vehicle on the road in Turkey.
Toyota's Mirai fuel cell car has begun to be sold in numerous countries.
Hydrogen is the main source of hope even for Iceland, which has renewable energy
reserves in large quantities. Iceland, making great use of geothermal energy, is planning to
become the world's first ''hydrogen economy''. Iceland is making preparations in order to
export the electricity produced by geothermal energy. Transmission system to Scotland and
the Netherlands is thought to involve cables laid under the sea. However, energy loss during
transmission leads them to consider the export of the excess electricity in terms of hydrogen
by the separation of water into oxygen and hydrogen by electrolysis. The famous analyst Neil
Prothero states that "They are aiming to run all cars and all buses in the country completely by
hydrogen, to get rid of their fossil oil needs, and to have established a hydrogen economy by
2050".
Countries such as India, the Netherlands and Norway have officially announced in
their senates that they will prohibit the sales of gasoline and diesel vehicles in 2025 and
Germany in 2030 (Anonymous Internet News, 2016). Various countries including France,
Denmark, Sweden, Finland, Switzerland and Brazil are trying to find temporary solutions to
air pollution by prohibiting the entry of fossil-fueled vehicles in some regions.
In Japan, the potential for reduction of nitrogen oxide emissions by the use of
hydrogen in the Tokyo metropolitan area is being investigated in the WE-NET (World Energy
Network) project. In this program, Japan has allocated a budget of 4 billions of dollars until
2020 to improve the hydrogen energy system. In the future, they plan to produce hydrogen by
electrolysis from sea water via solar radiation in an artificial island in the equatorial region of
the Pacific sea. In Tokyo alone, 40,000 kW of the city's electricity needs are derived from
hydrogen energy systems. Germany is also planning to establish a solar hydrogen production
facility near Saudi Arabia's Riyadh with the Hysolar program jointly executed with Saudi
Arabia. Saudi Arabia will export hydrogen. A consortium of governments, universities,
6. transport companies, factories and multinational automobile and oil companies has been
established in Iceland, the country planning to go completely into hydrogen energy by 2030.
The hydrogen filling station has been opened by Shell in Iceland and in the United States.
Haipu is the largest hydro power plant in Brazil and South America. Electrolytic hydrogen gas
is produced here (General Directorate of Renewable Energy, 2016).
1.2.3. Hydrogen obtaining methods
Hydrogen can be obtained by numerous ways. Several industrial obtaining methods
involve fossil fuels. It is one of the most common methods to produce hydrogen from water
by electrolysis using electricity generated from renewable energy sources. However, this
method results in the waste of our already limited water resources.
Hydrogen in the laboratory can be obtained mainly by four methods.
1) By adding acids on various metals (Mg, Al, Mn, Zn, Fe, Cd, Ca….)
Mg + 2HCl MgCl2 + H2
2Al + 3H2SO4⟶ Al2(SO4)3 + 3 H2
2) By the reaction of the active metals (1A group metals and Ca, Sr, Ba) with water at the
room temperature
Na + H2O ⟶ NaOH +1/2 H2
3) The reaction of sodium boron hydride (NaBH4) and water
NaBH4 + 2H2O ⟶ NaBO2 + 4H2
4) The electrolysis of water
H2O ⟶ H2 +1/2O2
Industrial hydrogen generation, on the other hand, generally involves high temperature
requiring processes.
1) Hydrogen can be produced by passing water vapor through metals (Fe, Mg) which are
heated to the red temperature.
3Fe + 4H2O ⟶ Fe3O4 + 4 H2
2) If water vapor at 1000 oC is passed over hot coke, CO and H2 mixture which is known as
water gas and used as fuel is obtained. This reaction can also be achieved in a single step on
Ni catalyst using lignite charcoal.
C +2H2O ⟶ CO2 +H2
3) Can be obtained by the reaction between hydrocarbons and water vapor via Ni catalyst on
high temperatures.
C2H6 +4H2O ⇌ 2CO2 +7H2
7. 4) Hydrogen can be obtained by electrolysis water in industry. The electricity used in this
method is usually derived from renewable energy sources (Yeşilel , 2011).
H2O H2 +1/2O2
The generation scheme of hydrogen by electrolysis method is briefly summarized in Figure-1.
ULUSAL
ELEKTRİK
ŞEBEKESİ
GÜNEŞ
PİLİ
RÜZGAR
TÜRBİNİ
SU
ELEKTROLİZ
ÜNİTESİ
HİDRÜR DEPO YAKIT
PİLİ
ELEKTRİK ENERJİSİ
H2 H2
a)
b)
Figure-1 Hydrogen production by electricity.
a) Non-stored energy generated in the city electricity network
b) Energy from renewable energy sources
Hydrogen can also be produced biologically by biophotolysis, photo-fermentation and
dark-fermentation, or a combination of these processes. Green algae and blue-green algae
break down water molecules into hydrogen ions and oxygen with direct and indirect
biophotolysis. Hydrogen production rate being very low and the reactivity very sensitive in
the published studies are seen as disadvantages. In addition, organic compounds produce
hydrogen by dark fermentation. Sugar containing biomasses (sugar beet, sugar cane), Starch
biomasses (potato, cereal), Lignocellulosic biomasses (grass, tree, straw) etc. are used as raw
materials. Prior to the fermentation unit in the lignocellulosic biomass, lignin removal is an
important problem. Unlike cellulose and hemicelluloses, lignin is not converted to simple
sugars and it may inhibit the growth of hydrogen-producing microorganisms (Genç, 2009;
Senturk and Büyükgüngör, 2010)
In recent years, studies on hydrogen production from cellulose by photocatalytic
method have also been carried out. In these studies, TiO2 modified with surface metal is used
as a photocatalyst. This catalyst produced a significant amount of hydrogen gas from its
modified Pd, Pt, Ni, and Au metals on its surface (Caravaca and Ark, 2016).
1.2.3. Hydrogen Transfer and Storage
Hydrogen is basically storable and transferrable by pipelines or tankers. It is stated that
natural gas pipelines can be used for future hydrogen transport. Although pipeline transport in
gaseous form is the preferred method, transport by tankers is carried out with high pressure
8. gaseous and liquefied forms. This process increases the transfer cost. For this reason, in recent
years, several methods have been investigated to transport hydrogen with low cost methods.
Studies on metal organic cage adsorbents have demonstrated appropriate hydrogen storage
(Sekizkardeşler et al., 2010). It has been proven that studies on hydrogen storage and transport
in carbon nanotubes are effective methods (Darkrim et al., 2002). It is also seen as an
advantage that these nanotubes are reusable (Atkinson et al., 2001). Storing and transporting
the hydrogen with hydrides are also considered important. Developed hydrides are titanium
alloys (especially iron-titanium), palladium alloys, zirconium alloys or their mixed alloys.
Hydrogen used as a fuel in fuel cells is among clean, environmentally friendly and high-
efficiency energy conversion technologies. Without using a steam boiler or turbine, only
electrical energy is generated by chemical reaction. Fuel cells, which are obtained by the
electrochemical reaction between hydrogen (H2) and oxygen (O2) and which can achieve total
efficiencies up to 80%, are also known as permanent running batteries or electrochemical
machines.
Hydrogen can also be stored as hydrides. NaAlH4 and NaBH4 are also among the most
widely used hydrides. Especially NaBH4 is important for our country. Considering that
approximately 70% of world's boron reserves are in Turkey, our country might have a voice
in the storage and the acquisition of the future energy. NaBH4 contains 10.5% hydrogen in
terms of mass in solid state.
NaOH
NaBH4+ 2H2O 4H2 + NaBO2
The projects on the NaBH4 issue are usually focusing on the conversion of the sodium
metaborate, the product of the reaction, to NaBH4 again. NaBH4 can be obtained in 2-4 hours
under high hydrogen pressure (1-70 bar) at 350-750 oC with sodium metaborate MgH2 or
Mg2Si (Kojima and Haga , 2002). As a result of this reaction, MgO and other similar products
can be decomposed to obtain pure NaBH4.
Flowchart for NaBH4 use in automotive and similar applications is shown in Figure-2
(Amendola et al., 2000).
9. Figure-2. Flowchart of Liquid Based Sodium Borohydride System for Automotive and
Similar Applications.
1.3. Electromagnetic waves
Electromagnetic waves are a kind of vibration that can travel in space. The
electromagnetic name comes from the combination of electric fields and magnetic fields of
waves. An electromagnetic wave is a piece of electrical and magnetic field in the same
frequency at right angles to each other, as shown in figure-3.
Figure-3. The components of electromagnetic waves.
1.3.1. Electromagnetic Spectrum
The electromagnetic spectrum is a sequence containing all known electromagnetic
waves from gamma rays to radio waves. As shown in Figure 4, the wave length in the
electromagnetic spectrum ranges from 1010 meters (electric waves) to 10-16 meters (cosmic
rays). The lowest wavelength rays have the greatest energy. Ultraviolet (UV) rays have
smaller wavelengths than visible region (VIS) rays and have larger energies.
About 5% of the solar spectrum is composed of UV rays, and a large part of that
spectrum involves rays of VIS region. Even though the UV region rays have more
photocatalytic activity, the use of solar rays as a photocatalyst is limited because of the low
density of sunlight. Photocatalysts must be able to function in the visible region for solar
radiation to be effective on the photocatalyst.
Figure-4. Electromagnetic spectrum.
10. 1.4. Cellulose
Cellulose is the most abundant biopolymer in the world. This polymer, a
polysaccharide and having the general formula (C6H10O5)n, forms the wood structure of
plants. Cellulose is insoluble in solvents such as water, benzene, alcohol, and chloroform.
Chemical structure of cellulose is given in Figure-5.
Figure-5 The polymer structure of the cellulose.
Cellulose can be obtained from various park, garden and greenhouse wastes. In the
Antalya region, where intensive greenhouse cultivation is made, 111.480.99 tons of dry mass
and 15.870.39 tons of biomass wastes are released only from tomato greenhouses every year
(Çıtak et al., 2006).
1.5. Photocatalyzer
According to the principles of quantum mechanics there are certain energy levels at
which electrons can be found in an atom. When the same type of atom is brought together to
form a crystal, energy levels are different from individual atoms. According to this theory
energy levels are composed of "energy bands". The band completely filled with electrons is
called the "valence band". The electrons in this band cannot move freely because they
constitute the chemical bonds in the solid crystal. The empty or partially filled band is called
the "conductivity band". The electrons in this band can continuously move freely in the solid.
Energy levels are given in Figure-6.
ENERGY
CONDUCTIVITY BAND
VALNCEBAND
11. Figure-6 Energy levels
According to their conductivities, solid matters are categorized as conductors,
semiconductors and insulators. Differences between these groups can be explained by the
energy differences between the valence band and the conductivity band. Figure-7 Shows the
classification of the participation according to the electronic structures. In conductive
materials, the valence band and the conductivity band overlap. As a result, the electrons in the
valence band can move freely through the solid. In the insulating materials, the valence band
and the conductivity band are separated from each other by a huge band gap. The energy
difference between two bands is so great that electrons in the valence band cannot pass into
the conductivity band and conductivity property cannot be achieved. In semiconductors, the
energy difference allows the passage of electrons with a small energy, and the electrons that
are excited in such a way switch between the two bands.
a b c
Şekil-7. a) insulator b) semiconductor c) conductor
In particular, metal oxides and sulfites are chosen as photocatalysts (TiO2, ZrO2,
Fe2O3, SiO2, Nb2O5, CdS...) among semiconductors. Band gap energy is one of the most
important parameters in photocatalyst selection. This energy has a distinct value for each
semiconductor. Figure 8 Shows the band gaps of some semiconductors (Benli, 2014).
CONDUCTI
VITY BAND
VALNCE
BAND
CONDUCTI
VITY BAND
VALNCE
BAND
VALNCE
BAND
CONDUCTIVIT
Y BAND
12. Figure-8 The band gaps of some semiconductors
Provided that the band gap is too high, the energy required for electron excitation is
high, that is, the wavelength is small. This will cause receding from the visible area. When the
gap energy is small, the excited electron returns back in a very short time period and does not
show the desired activity. Taking all these characteristics into account, the 3.2 V gap energy
of a photocatalyst is ideal. TiO2 and ZnO seem to be appropriate catalysts with this energy.
TiO2 Is one of the most ideal photocatalysts as ZnO dissolves in the acidic solutions and has a
limited application area..
1.5.1. Titanium dioxide (TiO2)
TiO2 Crystals are present in three forms as brookite, rutile and anatase in nature.
Brookit form is very rare and is almost never used as a photocatalyst. Rutile and anatase
phases are generally used as photocatalysts, though TiO2 in the anatase phase has been
reported to have the highest photocatalytic activity (ŞAM et al., 2007). TiO2 is a photocatalyst
activated by UV light. Only a fraction of the solar spectrum consists of UV rays. For this
reason TiO2 must be doped with metal or nonmetal atoms in order to be functional when
exposed to sunlight. Several studies have been conducted to increase the photocatalytic effect
of TiO2 (Mohammadi et al., 2013, Süslü et al., 2009; Sun et al, 2015; Yurdakal et al., 2016;
Yurtsever and Çifçioğlu, 2015). Most of these studies used TiO2, commonly known as P25
(Degussa). Projects only investigating P25 are also available (Hurum et al., 2003).The energy
bands of the rutile and anatase crystals of TiO2 are presented in Figure 9.
Figure-9. The energy bands of the rutile and anatase crystals
TiO2 is a material that can break organic groups. It is used in water distillation, self-
disinfecting surface preparation and cancer treatment as a result of photochemical activities.
Titanium dioxide can be applied in film coatings by some methods (chemical vapor
deposition, electron beam evaporation, sol-gel, etc.).
13. The photocatalytic mechanism of the TiO2 (P25) surface modified with Ag
nanoparticles is given in Figure-10.
Figure-10 Ag/TiO2 photocatalytic effect.
The mechanism of the production of hydrogen gas from cellulose under sunlight by Ag/TiO2
catalyst is given in Figure-11.
14. Figure-11 The mechanism of production of hydrogen gas from cellulose by solar rays.
2. MATERIALS AND METHODS
2.1. Materials
Erlenmeyer flask (200ml, 500ml)
Beaker (200ml, 500ml)
Pipette (10ml, 50ml)
Round bottom flask (500 ml, 1000 ml)
Rubber bulb
Test tube (10ml, 50ml)
Balloon (Plastic child balloon)
Mechanical mixer (RW20)
Balance (OHAUS)
Sonicator (Isolab SN2015)
Oven (core-EV018)
Centrifugal device (Electro.mag M4808 P)
H2 sensor (PCE Gas H2 ppm)
Xe lamp (35W)
UV-VIS Spectrophotometer (Varan 5000)
Solar box (Solarbox 1500)
TiO2-P25 (Degussa)
AgNO3 (Merck)
NH3 (Merck)
Glucose (Merck)
Methylene blue (Merck)
Grass (grass clippings)
Cotton (silk, hydrophilic cotton)
Experiments were carried out at the laboratory of our school and at the laboratory of the
chemistry department of the university located in our city.
2.2. Methods
2.2.1. The modification of Titanium dioxide (TiO2) surface by Ag
For the preparation of 1% Ag-TiO2 nanoparticle;
Water was added to 0.0787 grams of AgNO3 for final volume of 500 ml
10 ml of 25% NH3 solution was added dropwise with the help of burette.
5 grams of TiO2 was added and stirred for 1 hour in the magnetic stirrer.
15. Şekil-12a) TiO2 (P25) b)Ag-TiO2 mix c) Ag/TiO2
The mixture was centrifuged and the filtrate was separated.
0.002 M 500 ml of glucose solutionwasaddedtothe solidmixture and allowed to
stand for 15 min while being stirred in a magnetic stirrer under room conditions.
Followingcentrifugation,the separatedfiltratewasaddedandthe mixture was
stirredfor15 minuteswithamagneticstirrer.
The whole mixture was filtered by centrifugation at 4000 rpm for 15 min and 50
ml of water was added to the solid portion for 15 min in the sonicator. Mixture
was again filtered by centrifugation. (This has been repeated twice)
The mixture was centrifuged again and dried in a vacuum oven at 45 °C for 24
hours
The dried sample was grinded by a granite mortar and characterized in XRD,
SEM, TEM, UV-VIS Spectrophotometer. Figure-12
a b
c
16. 2.2.2. The measurement of the photocatalytic effect of Ag-TiO2
0.5 grams of methylene blue was poured into a 1 liter balloon jug and brought to a
final volume of 1000 ml. 10 ml of this solution was brought to a final volume of 500 ml, and a
10 ppm methylene blue solution was obtained. In each of the 4 test tubes, 6 grams of 10 ppm
methylene blue solution was placed. As being control group, first test tube involved
methylene blue alone, second test tube involved 0.06 grams of unmodified TiO2 (P25), third
test tube involved 0.06 grams of Ag/TiO2, and fourth test tube contained 0.03 grams Ag/TiO2
in order to observe the amount-dependent effect. In Solarbox (Figure-13) IRRADIANCE 11
was also run. The samples exposed to light during 35 minutes were photographed in every 5
minutes and the color changes were observed. The light exposure for 5 minutes in solar box
corresponds approximately to 21-hour exposure of sunlight.
Figure-13 The solarbox device.
2.2.3. UV-VIS Spectrophotometer
The absorbance valuesof Ag/TiO2and TiO2 (P25) were measuredbyUV-VISspectrophotometerat
the wavelengths rangingbetween200nmand 800nm. The measurementswere carriedoutasthe
powdersampleswere placedinthe barof the device (Figure-14).
Figure-14 UV-VIS Spectrophotometer device
17. 2.2.4. Hydrogen production from cellulose by photocatalytic method.
In this section, firstly a preliminary study was carried out to observe the gas discharge. For
this purpose, following mixtures were added to Erlenmeyer flasks;
1. Erlenmeyer flask: 0.2 grams of cotton + 0.15 grams of Ag/TiO2 + 200 ml of pure water
2. Erlenmeyer flask: 0.2 grams of grass + 0.15 grams of Ag/TiO2 + 200 ml of pure water
3. Erlenmeyer flask: 0,2 grams of grass, + 0,15 grams of Ag/TiO2 + 200 ml of pure water
4. Erlenmeyer flask: 0,15 grams of Ag/TiO2 + 200 ml of pure water (Control group)
Plastic balloons were connected to Erlenmeyer flasks and the contact points were covered
with parafilm. Flasks were placed on a magnetic stirrer and exposed to sunlight for 3 hours.
Figure-15 Shows the experimental set-up (The set-up was transferred to another location in
order to avoid shadows).
Şekil-15 a) first situation b) 3 hours later
Three-neck flask was filled with 200 ml of pure water. Grass, previously washed with
0.5 grams of pure water, dried at 90 °C, and grinded, was added. The mixture was incubated
in the Sonicator for 30 minutes. Nitrogen gas was injected to remove dissolved gases in the
water. The air in the flask was cleaned by the nitrogen gas. 0.375 grams of Ag/TiO2 catalyst
was added and the closed system was left under Xe (35W) lamp light for 3 hours. At the end
of 3-hour period, measurements were made with a PCE brand Hydrogen detector. The
experiment was repeated three times and the average amount of H2 gas was determined as 16
ppm (Figure 16)
a b
18. Şekil-16the experimental setup
As there was no gas chromatography device in Akdeniz University, the measurements
of hydrogen gas were taken in Ege University during school term. Same experimental setup
was used. 200 ml of distilled water and 5 grams of grass were mixed in the three-neck flask.
Nitrogen gas was passed through the medium and 3 grams of Ag/TiO2 catalyst was added.
The mixture was exposed Xe (35W) lamp light in a closed system for 3 hours. At the end of 3
hours, the gas sample was taken with a syringe and injected into the Gas chromatograph. The
mixture was measured to contain hydrogen at a molar concentration of 0.311%.
3. RESULTS
* XRD Results of Ag modified TiO2 (Ag/TiO2) surface are shown in Figure-17.
Şekil 17. XRD moldof Ag/TiO2
N2 gas
19. It is seen that the peaks of our sample are matched with TiO2 anatase phase, TiO2 rutile phase
and Ag metal patterns.
* TEM images of Ag/TiO2. 0.0022 g of powder sample was mixed with 10 mL of ethanol and
allowed to disperse homogeneously in an ultrasonic bath for 25 minutes. 10 μL of this
mixture was dropped onto the carbon-coated grid and the excess droplet was absorbed with a
filter paper. The liquid film formed on the grid was dried in a closed chamber without being
exposed to dust. The transmission electron microscopy (TEM) measurements were taken with
a Zeiss Leo 906E TEM apparatus. The images were captured at the magnifications of 167,000
and 100,000 (Figure-18).
Şekil-18a)100.000 b) 167.000
* SEM Images of Ag/TiO2 are presented in Figure-19.
Şekil-19SEM
a
b
20. *The test of photocatalytic activity by methylene blue; tubes were exposed to light for 35
minutes and photographed every 5 minutes of the exposure (Figure-20). The light exposure of
5 minutes in solar box corresponds approximately to 21-hour exposure of sunlight.
Test tube -1 : 10 ppm methylene blue solution (control group)
Test tube -2 : 10 ppm methylene blue solution + P25 (unprocessed TiO2)
Test tube -3 : 10 ppm methylene blue solution + 0.006 grams of Ag/TiO2
Test tube -4 : 10 ppm methylene blue solution + 0.003 grams of Ag/TiO2
Figure-20Photographstakeninevery5 minutesof the exposure.
*Ag/TiO2 ve TiO2 in UV-VIS Spektrofotometresi şekil-21 de verilmiştir.
Beginning 5.minute
minute
15.minute
20.minute
25.minute 35.minute30.minute
21. Şekil-21. UV-VIS 200nm ile 800nm arası absorbans değerleri
4. CONCLUSION AND DISCUSSION
* As targeted in the beginning of the project, the surface of TiO2 has been modified with Ag
nanoparticles and the synthesis of Ag nanoparticles by XRD was proven.
* The photocatalytic effect of TiO2 in the UV region was shifted to VIS region and enhanced
by Ag modification. These phenomena were proved by the effect on methylene blue solution.
As shown in Figure 20, the Ag/TiO2 catalyst breaks down the methylene blue before P25
does. There was no change in the control group. No significant difference was observed
between 0.07 g of Ag/TiO2 and 0.03 g of Ag/TiO2 containing test tubes.
* The measured spectra of TiO2 and Ag/TiO2 on the UV-VIS spectrophotometer indicate that
the absorbance value of Ag/TiO2 noticeably shifted to the visible region. The absorbance
value of TiO2 (P25) in the visible region was "0", whereas the absorbance value of Ag/TiO2
nanoparticles increased up to 0.2 Au (Figure-21).
* TEM And SEM images did not allow us to see Ag nanoparticles due to the measurement
interval of the device. P25 has an average particle size of 25 nm. A more sensitive
measurement is required in order to observe the Ag nanoparticles used in the modification of
the surface. However, images were captured to provide information about the particle size.
*** To conclude, by using 0,5 grams of grass clipping and 0,375 grams of Ag/TiO2
catalyst we obtained an average of 16 ppm H2 gas, measured by a PCE hydrogen gas
detector, under sunlight (Xe lamp-35W) without any pretreatment. In addition, as
measured by GC, 3110 ppm of H2 gas was produced via 5 grams of grass and 3 grams of
catalyst. The unit converter (http://www.lenntech.com/calculators/ppm/converter-parts-
per-million.htm) demonstrates that 3110 ppm gas equals to 27 mg/m3 for H2. It is
known that the total gas volume is 0,442 L and the annual eggplant and tomato
greenhouse wastes in Antalya is 127,351,38 tons (Çıtak et al, 2006). Approximately 1560
*TiO2 (P25)
*Ag/TiO2
22. tons of hydrogen gas can be produced annually from solely tomato and eggplant wastes
in Antalya with the help of solar energy. It is noteworthy to mention that the energy
equivalent is 4365 tons of fossil oil.
* Air pollution problem will also be solved when hydrogen is used as a fuel since H2O is
alone the the reaction product. Furthermore, the condensation of that water, produced
in the system, would also be a partial solution for another environmental problem: the
water supply problem. Thus, a big step will be taken FOR A BETTER LIFE.
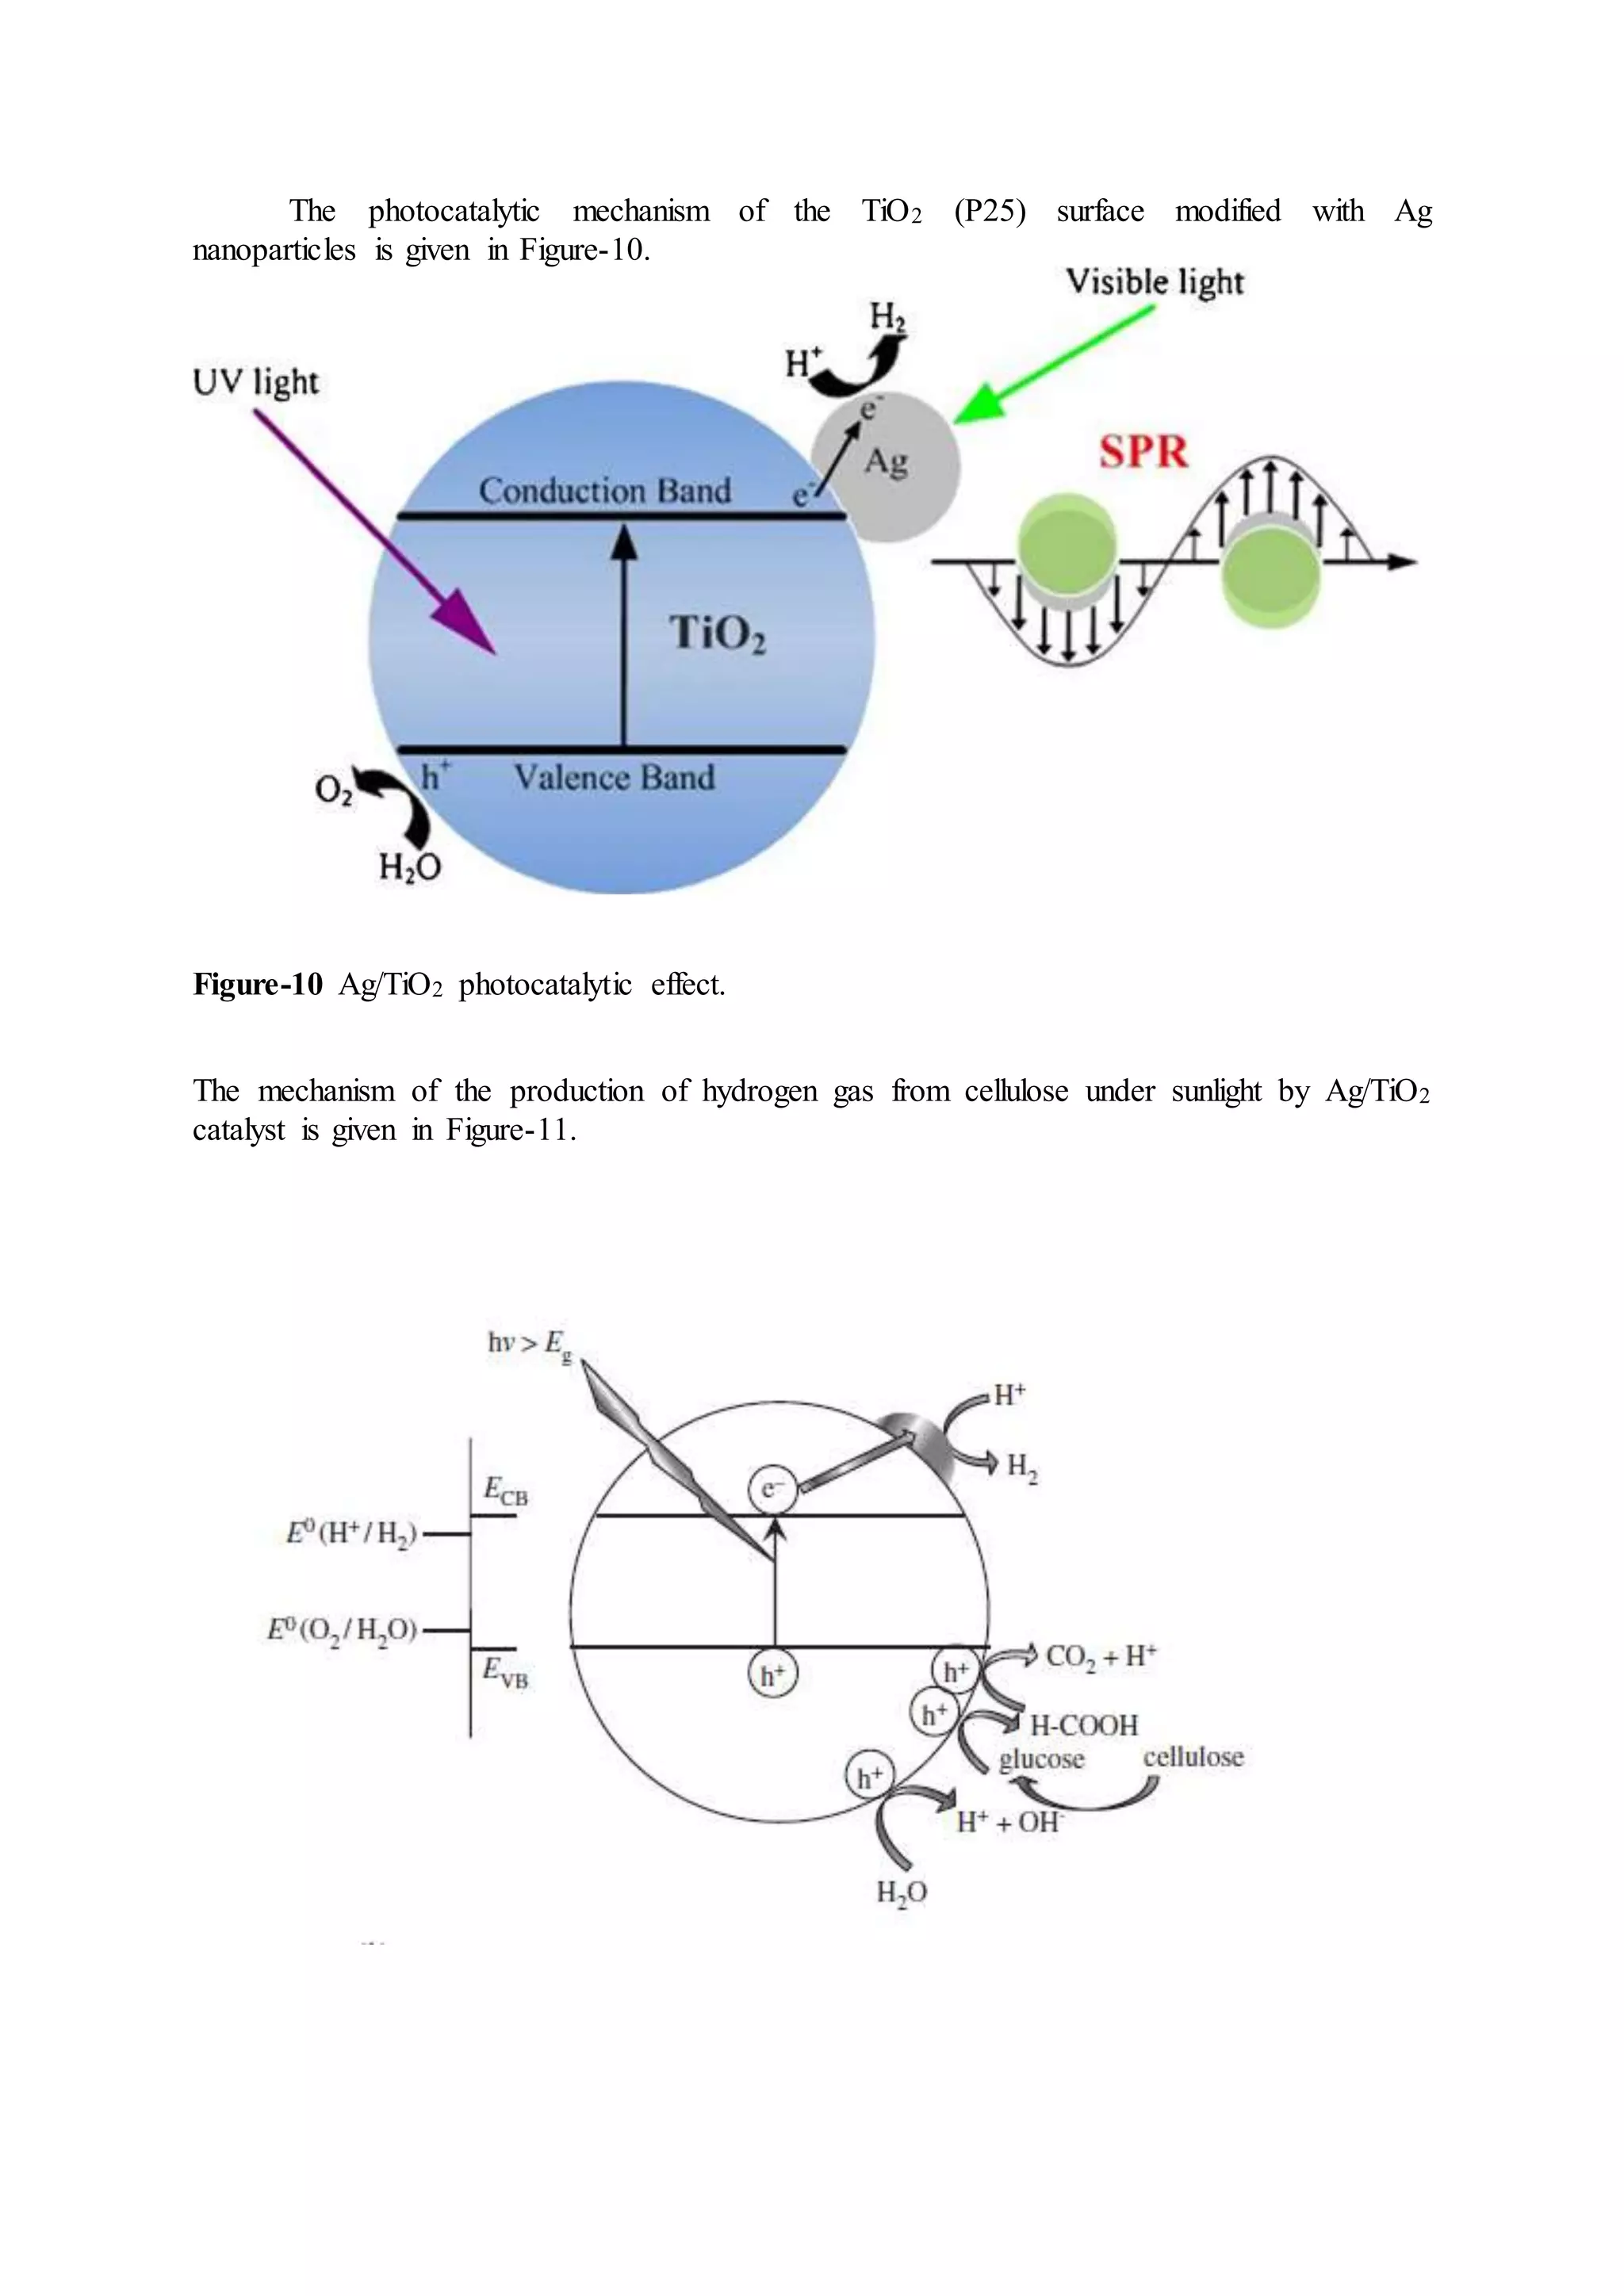
* In previous studies, TiO2 surface was doped with Ag; however, not used for the production
of hydrogen from cellulose. (Ornate, 2013; Yurdakal, 2016). Additionally, TiO2 crystal was
doped with Pt, Pd, Ni and Au, and the experiment was carried out at 60 °C to produce
hydrogen gas from the cellulose (Caravaca, 2016). In our project, on the other hand,
experiments were carried out under room conditions; that is, without additional heating. The
production of hydrogen gas from cellulose with modified Ag/TiO2 surface would be a
pioneering work in the literature.
5. COMMENTS
* The experiment was carried out at 60 °C in the previous studies. We performed the experiment
under room conditions. The effect of temperature can further be investigated by comparing the results
obtained at different temperatures.
* We used % 1 Ag/TiO2 photocatalyst. The effect of photocatalyst can be studied by changing the
Ag/TiO2 ratios.
6. REFERENCES
Anonim, 2016, İnternet haber, (son erişim tarihi: 02.01.2017)
http://www.dunyabulteni.net/haberler/367347/almanyanin-benzinli-otomobil-yasagi-
resmilesti
Amendola S.C., Sharp-Goldman S.L., Janjua M.S., Kelly M.T., Petillo P.J., Binder M., 1999 ,
"An Ultrasafe Hydrogen Generator: Aqueous, Alkaline Borohydride Solutions and Ru
Catalyst",Journal of Power Sources, 85,(2000)186-189
Aslan Ö., 2007, ‘Hidrojen Ekonomisine Doğru’İstanbul Ticaret Üniversitesi Sosyal Bilimler
Dergisi 6(11) ,283-298
Atkinson B., Roth S., Hirscher M., Griinwald W., 2001,’’Carbon nanostructures; An efl]cient
hydrogen storage medium for fuel cells?’Fuel Cells Bulletin,Germany No:38, 9-12
Benli Y., 2014,‘Gümüş İle Doplamış Nano-TiO2’in Özelliklerinin İncelenmesi’(Doktora tezi)
23. Yıldız Teknik Üniversitesi, Fen Bilimleri Enstitüsü, İstanbul
Caravaca A., Jones W., Hardacrel C., Bowkwr M., 2016 ‘H2 production by the photocatalytic
reforming of cellulose and raw biomass using Ni, Pd, Pt and Au on titania’, The Royal
Socıety, 472 (54), 1-21
Çıtak S., Sönmez S., Okturen A.F., 2006, ‘Bitki Kökenli Atıkların Tarımda Kullanılabilme
Olanakları’ Derim, Cilt.23, 40-53
Darkrim F.L., Malbrunot P., Tartaglia G.P.,2002, "Review of Hydrogen Storage by
Adsorption in Carbon Nanotubes", Int. J Hydrogen Energy, 27, 193-202
Genç N., 2009, ‘Biyolojik hidrojen üretim prosesleri’ BAÜ Fen Bilimleri Enstitüsü Dergisi,
11(2), 17-36
Hurum D.C., Agrios A.G., Gray K.A., 2003, ‘Explaining the Enhanced Photocatalytic
Activity of Degussa P25 Mixed-Phase TiO2 Using EPR’ J. Phys. Chem. 107, 4545-
4549
Karkaş G., Bakır U., Ersöz T.İ., Koç B., Bayram B., 2008, ‘Çok İşlevli Cam ve Seramik
Ürünleri İçin Yarı İletken Fotokatalitik ince Filmlerin Geliştirilmesi, TÜBİTAK Proje
No: 106M168, Ankara
Kojima Y., Haga T., 2003 "Recycling Process of Sodium Metaborate to Sodium
Borohydride" International Journal of Hydrogen Energy ,28(9), 989-993
Kutuluş G., Tabakoğlu F.Ö., Türe E., 2006, ‘Türkiye’de Hidrojen Enerjisi Çalısmaları Ve
UNIDO-ICHET’, Dünya Enerji Konseyi Türk Milli Komitesi Türkiye 10. Enerji
Kongresi, İstanbul
Mohammadi R., Rabani M., Massoumi B., 2012, ‘Photocatalytic Decomposition of
Amoxicillin Trihydrate Antibiotic in Aqueous Solutions under UV Irradiation Using
Sn/TiO2 Nanoparticles’International Journal of Photoenergy, 10.1155, 1-10
Sekizkardeşler A.K., Öztürk Z., Köse D.A., 2011, ‘Metal Organik Kafes Yapılı Adsorbanların
Hidrojen Depolama Uygulamaları’ Hitit Üniversitesi Mühendislik Fakültesi,Fen
Bilimleri Enstitüsü, 1-4
Süslü A., Özdemir M., Tekmen Ç., Çelik E., Cöcen Ü., 2009 ‘Gümüş Katkılı TiO2
Nanofiberlerin Elektro-Eğirme Yöntemi İle Üretilmesi Ve Karakterizasyonu’ Anadolu
Unıversıty Journal Of Scıence And Technology, 10(1) , 277-284
Sun T.,Liua E., Lianga X., Hub X., Fana J., 2015, ‘Enhanced hydrogen evolution from water
splitting using Fe-Nicodoped and Ag deposited anatase TiO2 synthesized by
solvothermal method’ Applied Surface Science, 347, 696-705
Şam E.D., Ürgen M., Tepehan F.Z., 2007 ‘TiO2 fotokatalistleri’ itüdergisi/d mühendislik
,6(5-6), 81-92
Şenaktaş B., 2005, ‘Hidrojen Enerjisi, Üretimi Ve Uygulamaları’ (Yüksek Lisans tezi),
Pamukkale Üniversitesi, Fen Bilimleri Enstitüsü, Denizli
24. Şentürk İ.G., Büyükgüngör H., 2010, ‘An Examınatıon Of Used Dıfferent Waste Materıals
And Bıohydrogen Productıon Methods’ Journal of Engineering and Natural
Sciences,28, 369-395,
Ültanır M.Ö., (1998) 21. Yüzyıla Girerken Türkiye’nin Enerji Stratejisinin Değerlendirilmesi,
TÜSİAD-T/98-12/239
Yenilenebilir Enerji Genel Müdürlüğü Resmi internet sitesi, Son erişim tarihi: 02.01.2017
http://www.eie.gov.tr/teknoloji/h_teknolojisi.aspx
Yeşilel O.Z., 2011, ‘Hidrojenin Elde Etme Yöntemleri ve Kullanım alanları’ Devlet Kitapları
MEB 12. Sınıf Kimya Ders Kitabı, 978-975-11-3571-1, 34-42
Yurdakal S., Teka B.S., Değirmenci Ç., Palmisanoca G., 2016, ‘Selective photocatalytic
oxidation of aromatic alcohols insolar-irradiated aqueous suspensions of Pt, Au, Pd
and Ag loaded TiO2catalysts’ Catalysis Today, 10285 (7)
Yurtsever H.A., Çiftçioğlu M., 2015, ‘Demir ve Nikel Birlikte Katkılı Titanyum dioksit İnce
Filmlerin Görünür Işık Fotokatalitik Aktiviteleri’ Adıyaman Üniversitesi Fen Bilimleri
Dergisi 5 (2),163-177