
Recommended
Recommended
More Related Content
What's hot
What's hot (20)
Similar to Kb star 2019.03 factsheet
Similar to Kb star 2019.03 factsheet (20)
Recently uploaded
Recently uploaded (20)
Kb star 2019.03 factsheet
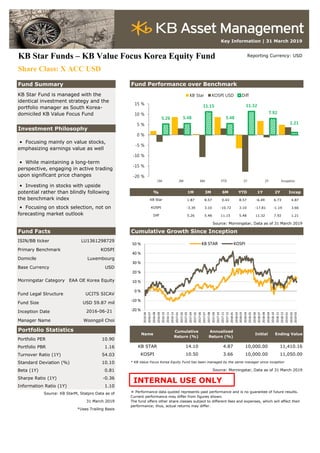
- 1. Key Information | 31 March 2019 KB Star Funds – KB Value Focus Korea Equity Fund Reporting Currency: USD Share Class: X ACC USD Fund Summary Investment Philosophy % 1M 3M 6M YTD 1Y 2Y Incep 1.87 8.57 0.43 8.57 -6.49 6.73 4.87 -3.39 3.10 -10.72 3.10 -17.81 -1.19 3.66 5.26 5.48 11.15 5.48 11.32 7.92 1.21 Source: Morningstar, Data as of 31 March 2019 Fund Facts Cumulative Growth Since Inception ISIN/BB ticker LU1361298729 Primary Benchmark KOSPI Domicile Luxembourg Base Currency USD Fund Legal Structure UCITS SICAV Fund Size USD 59.87 mil Inception Date Manager Name Woongpil Choi Portfolio Statistics Portfolio PER 10.90 Portfolio PBR 1.16 Turnover Ratio (1Y) 54.03 Standard Deviation (%) 10.10 * KB Value Focus Korea Equity Fund has been managed by the same manager since inception Beta (1Y) 0.81 Source: Morningstar, Data as of 31 March 2019 Sharpe Ratio (1Y) -0.36 Information Ratio (1Y) 1.10 Source: KB StarM, Statpro Data as of 31 March 2019 *Uses Trailing Basis • Focusing on stock selection, not on forecasting market outlook Fund Performance over Benchmark KB Star Fund is managed with the identical investment strategy and the portfolio manager as South Korea- domiciled KB Value Focus Fund • Focusing mainly on value stocks, emphasizing earnings value as well • While maintaining a long-term perspective, engaging in active trading upon significant price changes • Investing in stocks with upside potential rather than blindly following the benchmark index Morningstar Category EAA OE Korea Equity 2016-06-21 Name Cumulative Return (%) ※ Performance data quoted represents past performance and is no guarantee of future results. Current performance may differ from figures shown. The fund offers other share classes subject to different fees and expenses, which will affect their performance; thus, actual returns may differ. Initial Ending Value KB STAR 14.10 4.87 10,000.00 11,410.16 Annualized Return (%) KOSPI 10.50 3.66 10,000.00 11,050.00 KB Star KOSPI Diff 5.26 5.48 11.15 5.48 11.32 7.92 1.21 -20 % -15 % -10 % -5 % 0 % 5 % 10 % 15 % 1M 3M 6M YTD 1Y 2Y Inception KB Star KOSPI USD Diff -20 % -10 % 0 % 10 % 20 % 30 % 40 % 50 % 2016-06 2016-07 2016-08 2016-09 2016-10 2016-11 2016-12 2017-01 2017-02 2017-03 2017-04 2017-05 2017-06 2017-07 2017-08 2017-09 2017-10 2017-11 2017-12 2018-01 2018-02 2018-03 2018-04 2018-05 2018-06 2018-07 2018-08 2018-09 2018-10 2018-11 2018-12 2019-01 2019-02 2019-03 KB STAR KOSPI INTERNAL USE ONLY
- 2. Key Information | 31 March 2019 Breakdown by Cap Size Bottom-up Performance Attribution Decomposition Source: KB StarM, Data as of 28 February 2019 Top 10 Holdings % Portfolio BM Source: Statpro, 01 March 2018 ~ 28 February 2019 HANSOL CHEMICAL CO. LTD. 6.81 0.06 Bottom-up Stock Picking Effect Decomposition KOREA ZINC 6.64 0.55 SK HOLDINGS CO. LTD 6.55 1.32 Y G 1 COMPANY 6.45 0.00 FILA KOREA LTD 6.19 0.16 SOUTH KOREAN WON 5.41 0.00 COM2US CORPORATION 4.57 0.00 MERITZ FIRE & MARINE INS CO 2.99 0.16 DOOSAN BOBCAT INC 2.95 0.23 DONG - A PHARMTECH CO LTD 2.43 0.00 Sector Allocation % Source: Statpro, 01 March 2018 ~ 28 February 2019 Portfolio BM Fund Contribution by Sector Materials 25.24 9.10 Industrials 18.51 13.95 Consumer Discretionary 15.25 11.70 Consumer Staples 9.28 11.74 Health Care 8.95 0.00 Financials 6.16 6.97 Information Technology 5.41 6.07 Telecommunication Services 4.36 27.96 Utilities 3.65 7.84 Real Estate 3.20 0.18 Cash 0.00 1.92 Unclassified 0.00 0.13 Source: KB StarM, Data as of 28 February 2019 Source: Statpro, 01 March 2018 ~ 28 February 2019 Important Information 22.43 Weight (%) KOSPI KOSDAQ Large Cap 25.45 0.00 ※ Prior to investing in the Fund, an investor should read and understand the prospectus in full. The past performance of the collective investment scheme does not guarantee a return on investment for the future. Changes in the rates of exchange between currencies may cause the value of investment to fluctuate or result in loss of principal. There is a risk of loss of the invested principal in the collective investment scheme depending upon the result of its management and that such loss shall be imputed to investors. The portfolio information is shown for illustrative purposes only. The inclusion of the securities mentioned above is not to be interpreted as solicitations or recommendations to buy or sell. It is subject to be changed without notice. Stock GICS Sector Middle Cap 27.34 9.72 Small Cap 15.07 Stock Timing and Trading Effect Stock Picking Effect 0.60 % -0.40 % 9.90 % 0.45 % -2 % 0 % 2 % 4 % 6 % 8 % 10 % 12 % Stock Exclusion Effect Underweight Stock Effect Overweight Stock Effect Stock Addition Effect 10.55 % -0.39 % 10.94 % -2 % 0 % 2 % 4 % 6 % 8 % 10 % 12 % Stock Picking Effect Stock Timing and Trading Effect Stock Allocation Effect 5.16 % 0.16 % 0.00 % 0.00 % 0.00 % -0.11 % -0.12 % -0.13 % -0.40 % -0.73 % -2.03 % -7.94 % -15 % -5 % 5 % 15 % Consumer Discretionary Information Technology Unclassified Utilities Cash Energy Financials Real Estate Consumer Staples Materials Telecommunication Services Industrials KBVF Benchmark
- 3. Key Information | 31 March 2019 BEST Additions BEST Exclusions BEST Overweighed Securities WORST Overweighed Securities Source: Statpro, 01 March 2018 ~ 28 February 2019 Monthly Fund Commentary Contact Information KB Asset Management Global Investment Division Global Business Team kbgm@kbfg.com Jaesub, Lee E-Mail: jaesub.lee@kbfg.com Tel: +82-2-2167-8736 Seunghwan, Lim E-mail: seunghwan.lim@kbfg.com Tel: +82-2-2167-8204 Outlook The global economy cannot continue its rebound as it did last year, as it was a reference to the reversal of the long-term interest rate. The U.S., which has been leading the global economy, has also seen some fallout from the prolonged U.S.-China trade dispute, which has led to a series of premature predictions about the market, as concerns over a possible recession spread and expectations of a rate cut. In fact, despite growing expectations for liquidity supply, it is not expected to repeat the upward trend in market capitalization. Rather, it is expected that as 1Q earnings is announced, companies that post steady corporate profits even during the unsteady global economic situation will show significant performance deviations from those that do not. As global economic conditions do not seem to be able to rebound rapidly in the short term, we plan to evaluate corporate values under more conservative assumptions and build and operate the portfolio by focusing on stocks with large gaps in corporate value and stock price. In addition, we will actively consider expanding the weight of the stocks related to the stewardship code and shareholder return. Companies' annual reports for 2018 were released, resulting in large gaps in earnings among stocks. In addition, while Samsung Electronics has expressed concerns about its performance with a rare public disclosure, the market shock of the semiconductor sector has been reflected as its profit estimate has been lowered. On top of that, global markets have seen both economic recession concerns and another liquidity supply expectation as a result of the U.S. mention of a possible reversal of its short- and long-term interest rate schedule. Also, companies` shareholders` meeting highlighted the importance of the stewardship code, with Chairman Cho Yang-ho stepping down as chairman of Korean Air. The fund rose 1.87% over the month and out formed KOSPI by 5.26% as KOSPI fell -3.39%. Fila Korea, which recorded positive performance, contributed greatly to the increase, and Meritz Financial Group and Meritz Fire & Marine Insurance contributed to the increase. On the other hand, Com2us and Hansol Chemical contributed to the decline. 41F, Three IFC 10, Gukjegeumyung-ro, Yeongdeungpo-Gu, Seoul 07326, Korea 2.07 % 1.32 % 0.74 % 0.23 % 0.16 % 0 0.5 1 1.5 2 2.5 DONG - A PHARMTECH CO LTD SBI FINTECH SOLUTIONS CO.… SEOUL AUCTION CO LTD DAIBECK ADVANCED MATERIALS HAANSOFT INC. 0.84 % 0.35 % 0.34 % 0.26 % 0.25 % 0 0.2 0.4 0.6 0.8 1 ORCHEM CO LTD KB FINANCIAL GROUP INC. POSCO SAMSUNG LIFE INSURANCE CO HYUNDAI MOTOR CO 5.54 % 2.05 % 0.62 % 0.57 % 0.55 % -2 0 2 4 6 FILA KOREA LTD HANSOL CHEMICAL CO. LTD. SK HOLDINGS CO. LTD DOOSAN BOBCAT INC MERITZ FIRE & MARINE INS… -1.88 % -0.71 % -0.44 % -0.42 % -0.40 % -2 -1.5 -1 -0.5 0 HYOSUNG CORP WOONGJIN THINKBIG CO LTD (NEW) HANKOOK TIRE CO LTD (NEW) HYOSUNG ADVANCED MATERIALS… HYUNDAI DEVELOPMENT COMPANY % % % %