
Recommended
More Related Content
Viewers also liked
Viewers also liked (20)
Similar to Corn 10min dual megatrend backtest
Similar to Corn 10min dual megatrend backtest (20)
More from fibarchie
More from fibarchie (11)
Recently uploaded
Recently uploaded (20)
Corn 10min dual megatrend backtest
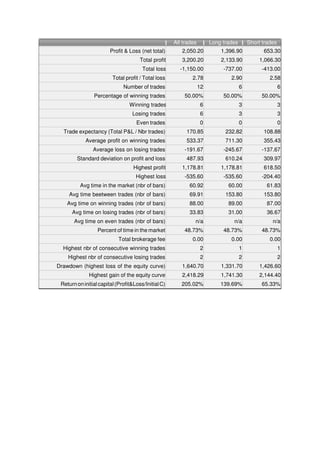
- 1. All trades Long trades Short trades Profit & Loss (net total) 2,050.20 1,396.90 653.30 Total profit 3,200.20 2,133.90 1,066.30 Total loss -1,150.00 -737.00 -413.00 Total profit / Total loss 2.78 2.90 2.58 Number of trades 12 6 6 Percentage of winning trades 50.00% 50.00% 50.00% Winning trades 6 3 3 Losing trades 6 3 3 Even trades 0 0 0 Trade expectancy (Total P&L / Nbr trades) 170.85 232.82 108.88 Average profit on winning trades 533.37 711.30 355.43 Average loss on losing trades -191.67 -245.67 -137.67 Standard deviation on profit and loss 487.93 610.24 309.97 Highest profit 1,178.81 1,178.81 618.50 Highest loss -535.60 -535.60 -204.40 Avg time in the market (nbr of bars) 60.92 60.00 61.83 Avg time beetween trades (nbr of bars) 69.91 153.80 153.80 Avg time on winning trades (nbr of bars) 88.00 89.00 87.00 Avg time on losing trades (nbr of bars) 33.83 31.00 36.67 Avg time on even trades (nbr of bars) n/a n/a n/a Percent of time in the market 48.73% 48.73% 48.73% Total brokerage fee 0.00 0.00 0.00 Highest nbr of consecutive winning trades 2 1 1 Highest nbr of consecutive losing trades 2 2 2 Drawdown (highest loss of the equity curve) 1,640.70 1,331.70 1,426.60 Highest gain of the equity curve 2,418.29 1,741.30 2,144.40 Return on initial capital (Profit&Loss/Initial C) 205.02% 139.69% 65.33%