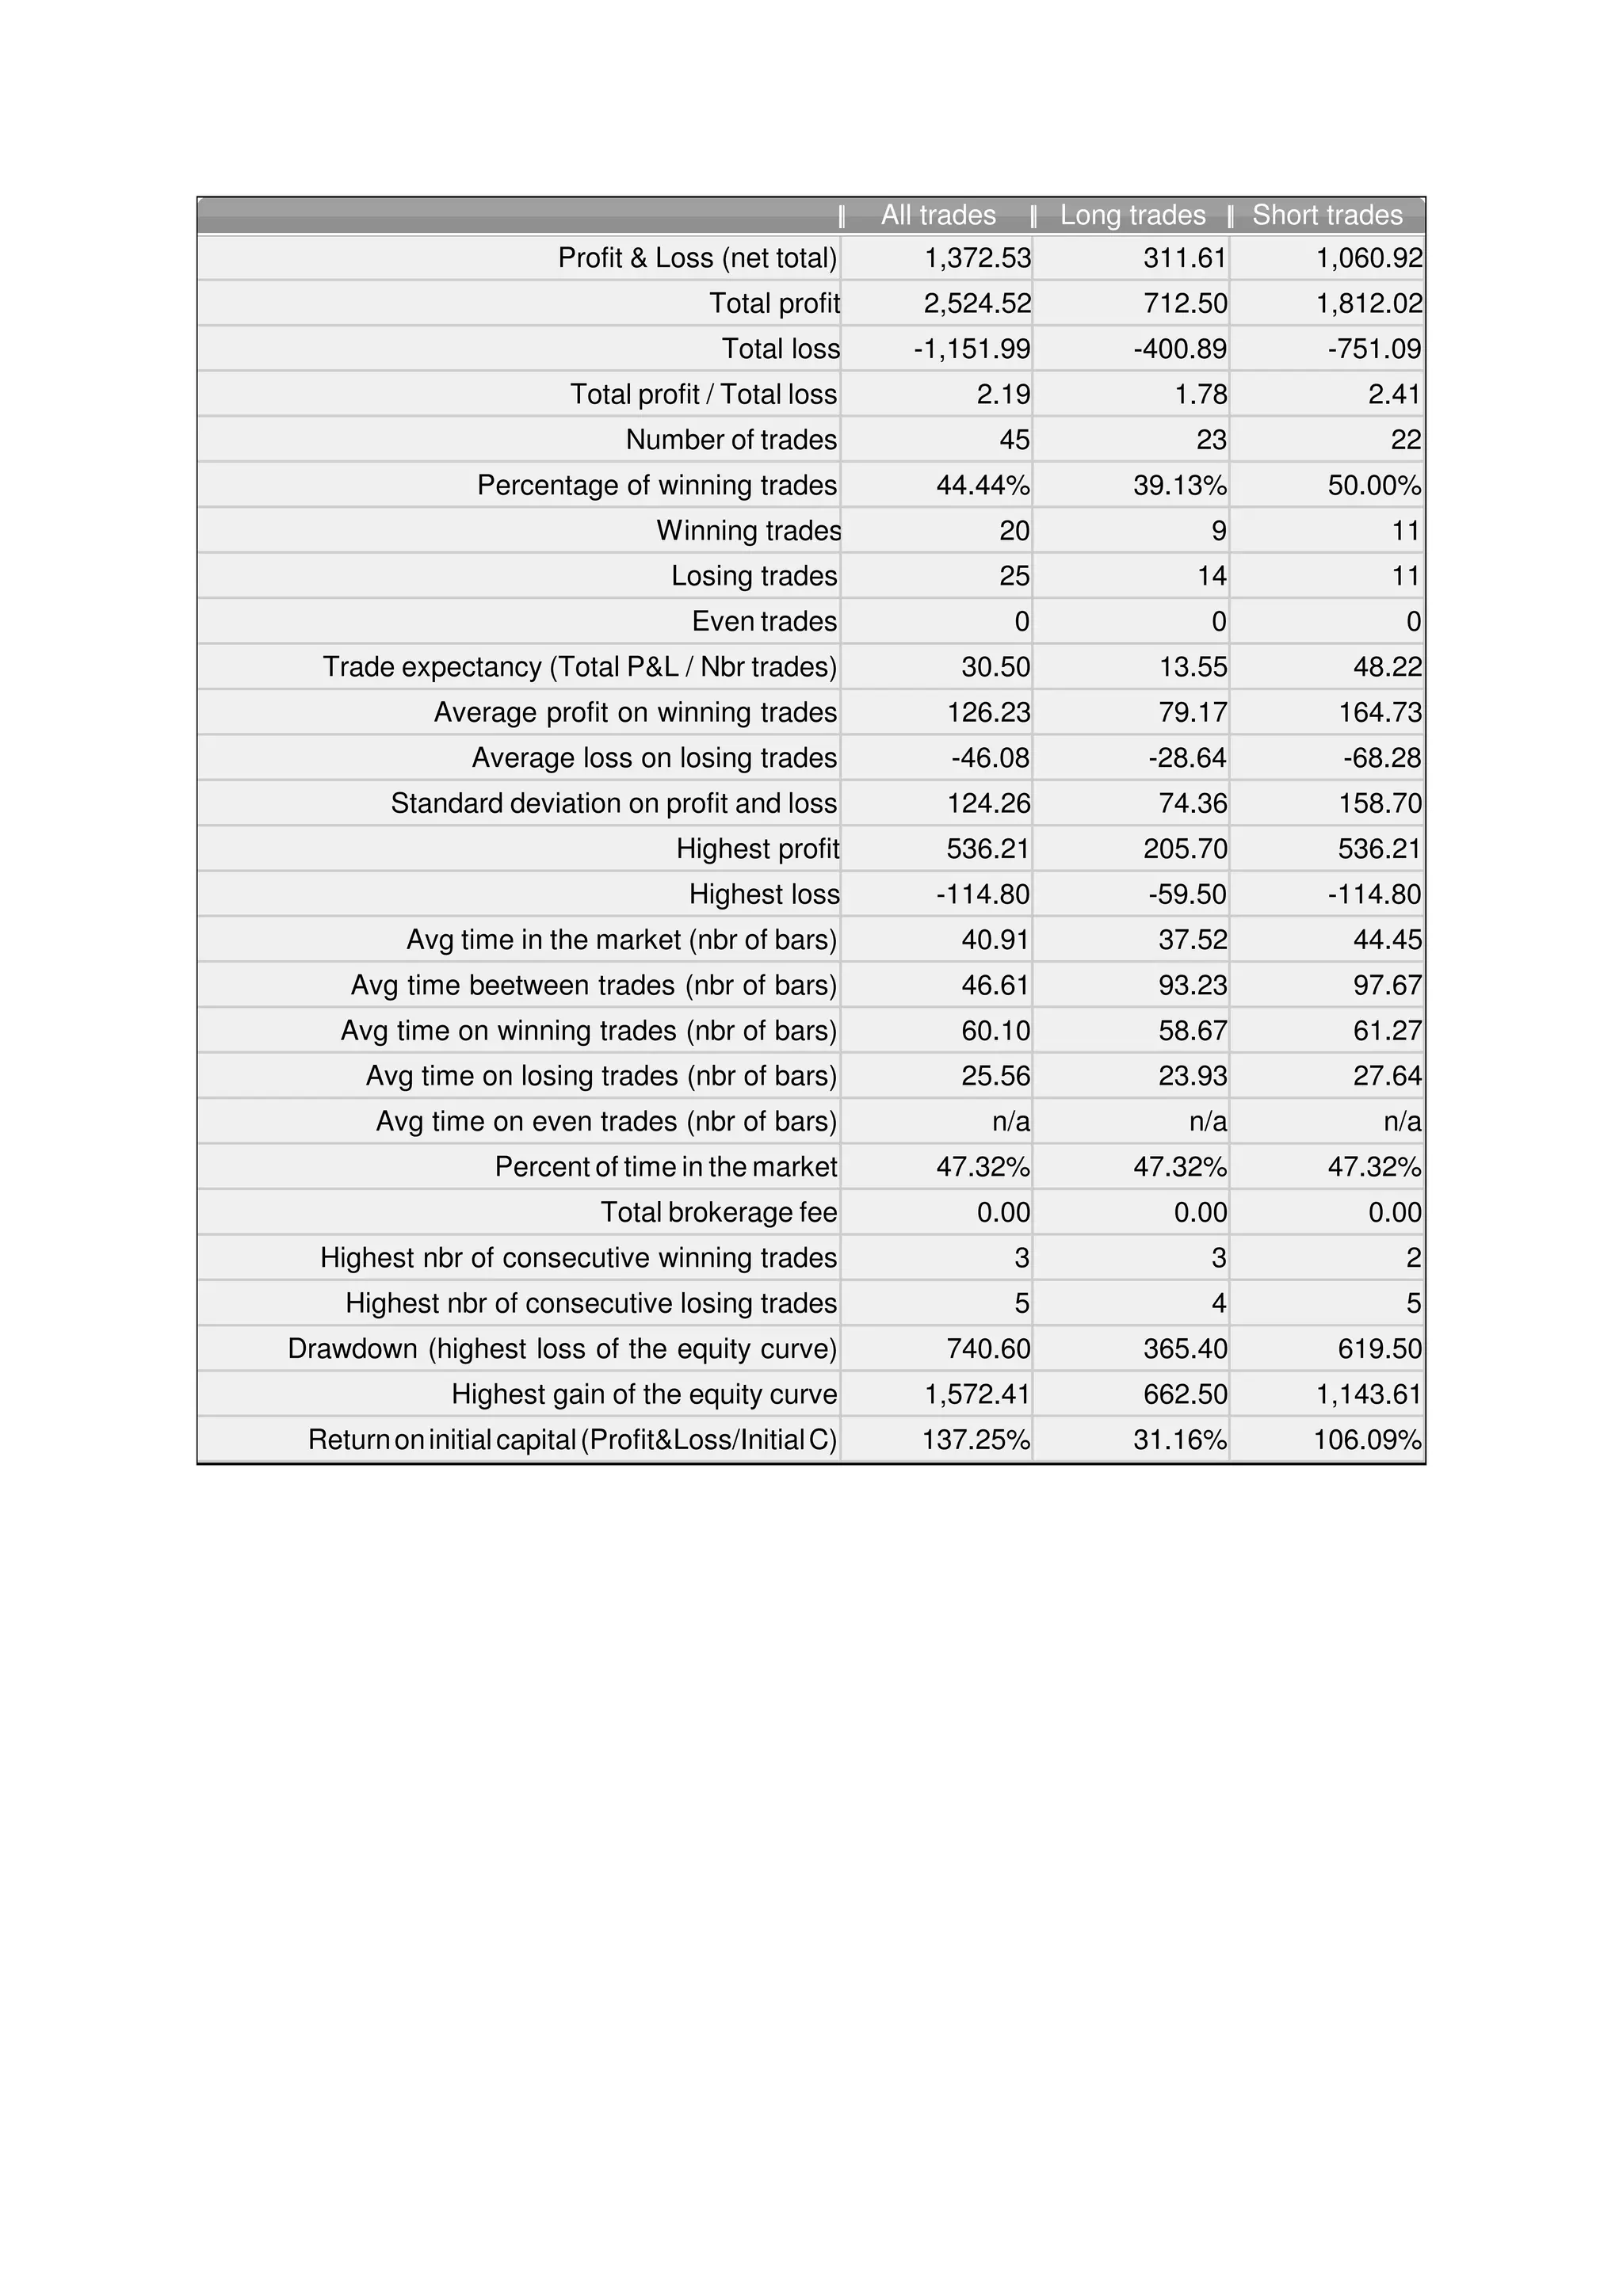
1. All trades Long trades Short trades
Profit & Loss (net total) 1,372.53 311.61 1,060.92
Total profit 2,524.52 712.50 1,812.02
Total loss -1,151.99 -400.89 -751.09
Total profit / Total loss 2.19 1.78 2.41
Number of trades 45 23 22
Percentage of winning trades 44.44% 39.13% 50.00%
Winning trades 20 9 11
Losing trades 25 14 11
Even trades 0 0 0
Trade expectancy (Total P&L / Nbr trades) 30.50 13.55 48.22
Average profit on winning trades 126.23 79.17 164.73
Average loss on losing trades -46.08 -28.64 -68.28
Standard deviation on profit and loss 124.26 74.36 158.70
Highest profit 536.21 205.70 536.21
Highest loss -114.80 -59.50 -114.80
Avg time in the market (nbr of bars) 40.91 37.52 44.45
Avg time beetween trades (nbr of bars) 46.61 93.23 97.67
Avg time on winning trades (nbr of bars) 60.10 58.67 61.27
Avg time on losing trades (nbr of bars) 25.56 23.93 27.64
Avg time on even trades (nbr of bars) n/a n/a n/a
Percent of time in the market 47.32% 47.32% 47.32%
Total brokerage fee 0.00 0.00 0.00
Highest nbr of consecutive winning trades 3 3 2
Highest nbr of consecutive losing trades 5 4 5
Drawdown (highest loss of the equity curve) 740.60 365.40 619.50
Highest gain of the equity curve 1,572.41 662.50 1,143.61
Return on initial capital (Profit&Loss/Initial C) 137.25% 31.16% 106.09%