SlideShare a Scribd company logo
1 of 35
December 2013 (12:4) | MIS Quarterly Executive 213
MISQUarterly
Executive
Data Monetization in the Supply Chain1,2
Data is now being created and transferred at an unprecedented
rate, fueling the growth
in business intelligence and analytics (BI&A)3 to discover
opportunities for improving and
innovating in supply chains and to enhance supply-chain
collaboration.4 In retailing, new
supplier/customer ecosystems are emerging in which BI&A
services are offered through a
supplier portal, which can be cloud-based. Cloud-based BI&A
platforms allow retailers and
their suppliers to share data and analytics, often for a price. Or
a company may monetize its
data by exchanging it for other benefits (e.g., merchandising
benefits). These data-sharing
ecosystems often involve new players (e.g., public cloud
platform providers and/or third-party
data coordinators, negotiators or analysts).
Many companies would like to monetize their data. Data
monetization is when the intangible
value of data is converted into real value, usually by selling it.
Data may also be monetized by
1 Cynthia Beath, Jeanne Ross and Barbara Wixom are the
accepting senior editors for this article.
2 An earlier version of this article was presented at the pre-ICIS
SIM/MISQE workshop in Orlando, Florida, in December 2012.
We are grateful to Omar El Sawy and other participants at the
workshop for their insightful comments. We would also like to
thank
the anonymous retailer and big data analytics company that
provided so much time and insight concerning their experiences
with
monetizing big data.
3 For background information on big data and BI&A, see Chen,
H., Chiang, R. H. L. and Storey, V. C. “Business Intelligence
and Analytics,” MIS Quarterly (36:4), 2012, pp. 1165-1188;
Hopkins, M. S., LaValle, S., Lesser, E., Shockley, R. and
Kruschwitz,
N. “Big Data, Analytics and the Path from Insights to Value,”
Sloan Management Review (52:2), 2011, pp. 21-32; and Wixom,
B.
H., Watson, H. J. and Werner, T. “Developing an Enterprise
Business Intelligence Capability: The Norfolk Southern
Journey,” MIS
Quarterly Executive (10:2), 2011, pp. 61-71.
4 For a discussion on BI as an IT capability for supply-chain
collaboration, see Rai, A., Im, G. and Hornyak, R. “How CIOs
Can
Align IT capabilities for Supply Chain Relationships,” MIS
Quarterly Executive (8:1), 2009, pp. 9-18.
Data Monetization: Lessons from a
Retailer’s Journey
In today’s era of big data, business intelligence and analytics,
and cloud computing, the
previously elusive goal of data monetization has become more
achievable. Our analysis
of a four-stage journey of a leading U.S. retailer identifies the
potential benefits and
drawbacks of data monetization. Based on this company’s
experiences, we provide
lessons that can help other companies considering data
monetization initiatives.1,2
Mohammad S. Najjar
University of Memphis (U.S.)
William J. Kettinger
University of Memphis (U.S.)
214 MIS Quarterly Executive | December 2013 (12:4)
misqe.org | © 2013 University of Minnesota
Data Monetization
converting it into other tangible benefits (e.g.,
supplier funded advertising and discounts),
or by avoiding costs (e.g., IT costs). Potential
buyers of an organization’s data include a direct
supplier, an upstream supply-chain partner, a
data aggregator, an analytics service provider or
even a competitor. Three current IT trends are
enhancing the potential for data monetization: big
data, BI&A and the cloud.
Retail firms, with their exacting merchandising
strategies and tight supply-chain relationships,
have taken the lead in demonstrating that
monetizing data can provide a significant revenue
stream and be an IT cost-sharing mechanism.
Point-of-sale, consumer-loyalty and inventory
data can be sold to suppliers, and some of the cost
of analyzing a retailer’s data can be recovered
from its suppliers.
Research has shown that data sharing in the
supply chain improves supply-chain performance.
Suppliers typically are interested in using a
retailer’s point-of-sale data to enhance planning
and better manage inventory, thus reducing
the bullwhip effect5 (i.e., the phenomenon of
demand variability amplification). Manufacturers
can use downstream data about retail sales to
improve product design, optimize operations and
develop fact-based marketing and promotional
campaigns. The availability of sales data to the
supply chain means that demand can be more
accurately forecast and, hence, inventory levels
can be better predicted; in some cases, assemble-
to-order can be achieved. Some suppliers may
even use such data for strategic decisions by
looking for product affinities to make merger or
acquisition decisions.
Furthermore, data sharing can be a strategic
tool in managing supply chains and channel
relationships; sharing consumer or market data
with supply-chain partners can influence their
behavior.6 Nevertheless, a company must decide
5 See Lee, H. L., Padmanabhan, V. and Whang, S. “The
Bullwhip
Effect in Supply Chains,” Sloan Management Review (38:3),
1997,
pp. 93-102.
6 For more discussion on the benefits of data
sharing in the supply
chain, see Zhou, H. and Benton Jr., W. C. “Supply Chain
Practice and
Information Sharing,” Journal of Operations Management
(25:6),
2007, pp. 1348-1365; Eyuboglu, N. and Atac, O. A.
“Information
Power: A Means for Increased Control in Channels of
Distribution,”
Psychology & Marketing (8:3), 1991, pp. 197-213; Waller, M.,
Johnson, M. E. and Davis, T. “Vendor-Managed Inventory in
the
Retail Supply Chain,” Journal of Business Logistics (20:1),
1999, pp.
183-203; and Lee, H. L., Padmanabhan, V. and Whang, S., op.
cit.,
2004, pp. 1875-1886.
whether and when sharing its data with suppliers
and other partners will pay off. The benefits a
data-sharing strategy will have for the overall
supply chain and distribution channel must be
balanced against the benefits of holding data
close to the chest.7 While the improvement in
supply-chain performance might be a good reason
for companies to share data with supply-chain
partners, a more explicit direct dollar value of the
data can be another tempting motivation.
There are several challenges in involving
suppliers in monetizing data. Selling data
to suppliers may eliminate the competitive
advantage that can be gained from asymmetric8
information. Contracts have to be carefully
prepared to ensure the data sold or shared is
used for the mutual benefit of the firm and its
partners. Trust has to be nurtured. The privacy
and security of a company’s data may be at
risk if appropriate assurance practices are not
established. Data packaging has to be considered
to identify what data can be made available for
sale and in what format and at what price. Pricing
models need to be developed to take account
of the associated cost of making data available
and its value to the buyer. A company must
identify a suitable marketing model for its data.
Although data monetization best practices have
yet to be identified, this article describes how a
major U.S. retailer tackled these challenges. (The
research we conducted to create this case study is
described in the Appendix.)
Pathways to Data Monetization
Data monetization requires a strategic
choice on which of several pathways to
follow. It is important to assess the technical
(data infrastructure) and analytical (human)
capabilities of the company to determine which
strategic pathway a company should choose for
monetizing its data. The technical capability
includes the hardware, software and network
capabilities that enable the company to collect,
7 For more discussion on the benefits of data
sharing in the supply
chain, see: Zhou, H. and Benton Jr., W. C., op. cit., 2007;
Eyuboglu,
N. and Atac, O. A., op. cit., 1991; Waller, M., Johnson, M. E.,
and
Davis, T., op. cit., 1999; and Lee, H. L., Padmanabhan, V., and
Whang, S., op. cit., 2004.
8 Information asymmetries occur when two people have
different
information about the same thing. If one has additional inside
information, he or she can leverage or take advantage of that
information.
December 2013 (12:4) | MIS Quarterly Executive 215
Data Monetization: Lessons from a Retailer’s Journey
store and retrieve its data. The analytical
capability is the mathematical and business
analytical knowledge and skills of the employees
in the company or in supplier firms. A company
that has the data and the know-how (i.e., people
and BI&A) to use the data properly will have
an advantage in the era of big data. If both
capabilities are low, then the company has three
potential pathways to transition to the high
capabilities that will enable it to monetize its data
(see Figure 1).
Pathway 1: Move Direct to Higher Risk
and High Reward
This direct pathway can be a riskier path to
data monetization, as it requires simultaneously
building both technical and analytical capabilities.
As such, it requires the largest initial investment
of the three alternative pathways. To follow this
pathway, a company must invest in developing
its technical infrastructure while hiring and
training employees with the required business,
mathematical and analytical skills. While costly,
following this pathway will quickly position a
company to be ready for monetizing its data and
collaborating with supply-chain partners.
Pathway 2: Build Analytical Capability
First
Following this pathway, a company chooses
to develop its analytical capability first. This
requires training employees and/or hiring
business analysts with the required set of
business, mathematical and analytical skills. As
its analytical capability grow, the company may
leverage them by generating more data (from
internal sources) or buying data (from external
sources). But growing an in-house analytical
capability may not be sufficient to reach the
point where the company can demonstrate the
value of its big data and thus pave the way to data
monetization. It may also require the company’s
technical capability to be expanded. This pathway
requires a higher internal investment to develop
the in-house analytical capability.
Pathway 3: Build Technical Data
Infrastructure First
Instead of first developing its own analytical
capability, a company may choose to extend
or outsource its technical data infrastructure
to produce an attractive collection of data that
can be sold to suppliers. The creation of an
appropriate digital platform is a prerequisite for a
company and its suppliers to share data securely.
A company can build this platform internally or
use the expertise of a service provider; the use
Figure 1: Three Pathways to Data Monetization—Moving From
Low-Low to High-High
Capabilities
Build both capabilities
internally or hire a third
party
Acquire (buy) data to
leverage your analytical
capability
Exploit suppliers’
BI&A
Monetize and dig
deeper collectively as
partners
Technical Capability
Analytical
Capability
Low
Low
High
High
1
2
3
216 MIS Quarterly Executive | December 2013 (12:4)
misqe.org | © 2013 University of Minnesota
Data Monetization
of cloud-based infrastructure can increase the
flexibility, scalability and speed of developing
the platform. By building a platform that will
enable it to market its saleable data, a company
can more quickly monetize its data and possibly
avoid some analytical costs by leveraging the
analytical capabilities of its suppliers rather than
developing the analytical capability in-house.
This pathway maximizes the potential data
monetization pay-off because it enables sales of
data and reduces startup costs. However, it does
make the company more reliant on its partners as
major sources of analytics.
The Data Monetization
Journey of “DrugCo”
The case of “DrugCo,” a U.S.-based Fortune
500 drug retailer with several thousand stores in
more than half of U.S. states, illustrates a company
that has followed Pathway 3. This company, which
wishes to remain anonymous, is recognized as
being relatively mature in BI and data use, and it
has been monetizing its data for almost 10 years.
The case shows how cost and the willingness to
work with external parties and openly share data
were important issues that motivated DrugCo to
monetize its data.
Like other companies in the small-box retailing
sector, DrugCo has:
● Many retail locations with narrowly
defined geographical boundaries
● Limited shelf space
● Many stock-keeping units (SKUs) across
the company
● A diverse customer base
● Differing inventories within each location
to satisfy the local customer needs.
For DrugCo, data analysis is crucial for
accurately assessing marketing campaigns,
analyzing sales patterns, examining on-shelf
availability and inventory levels, and customizing
SKUs for each store based on its unique local
consumer demand.
We describe key events that took place in the
company, and we present a four-stage model
that illustrates the four key stages it went
through on its data monetization journey (the
stages are depicted in Figure 2). We also provide
lessons learned from DrugCo’s journey for
other managers as they grapple with their data
monetization decisions.
In Stage 1, Building BI&A capabilities, DrugCo
built its technical and analytical capabilities to
address internal business needs.
In Stage 2, Connecting to and sharing
information with suppliers, DrugCo connected
to its supply-chain partners and started to share
information with them through its cloud-based
Figure 2: DrugCo’s Four-Stage Data Monetization Journey
Stage
Benefits
(Value) of
Data
Stage 1:
Building
BI&A
capabilities
Stage 2:
Connecting
to and
sharing
information
with
suppliers
Stage 3:
Monetizing
data by
charging
for it
Stage 4:
Further
monetizing
data and
avoiding
analytical
costs by
leveraging
suppliers’
resources
December 2013 (12:4) | MIS Quarterly Executive 217
Data Monetization: Lessons from a Retailer’s Journey
supplier portal, hosted by 3PP (a third-party data
analytics firm that works with DrugCo and which
also wishes to remain anonymous).
In Stage 3, Monetizing data by charging for it,
DrugCo started selling its data to suppliers via its
supplier portal.
In Stage 4, Further monetizing data and
avoiding analytical costs by leveraging suppliers’
resources, DrugCo leveraged its suppliers’ data
analytical capabilities and avoided some of
the costs of its analytical function. This stage
continues to the present day.
The characteristics of the four stages are
described in Table 1. The stages differ in the
technical and analytical (especially in people)
capabilities the company required, the type of
trust9 built, the focus of DrugCo’s information
strategy, governance mechanisms, and the
costs incurred and benefits achieved by various
stakeholders. While there has been ample
discussion of the first two stages, we were
surprised by the third stage and even more
surprised by the fourth.
As DrugCo moved from one stage to the next,
the benefits realized from its data increased.
DrugCo’s data was monetized in the form of
revenue generated directly from selling the
data, as well as through a decrease in labor and
infrastructure costs for analysis. The company
also realized benefits from new business
opportunities associated with new analytical
insights and enhanced its collaboration with
suppliers.
Stage 1: Building BI&A Capabilities
The growth of DrugCo’s data sources
meant that its traditional databases, database
management systems and analytical tools became
slow and inefficient. DrugCo’s VP of Pharmacy
Services described this environment:
“The database … probably had about 1.2
to 1.3 million transactions a day and those
transactions were very long … there were
literally hundreds of fields on one of these
transactions that could be evaluated.”
In response, DrugCo improved its in-house
technical data capability by developing a data
warehouse and using basic data analytical tools
9 Trust is categorized into contractual, goodwill and
competence;
see Sako, M. Prices, Quality and Trust: Inter-firm Relations in
Britain and Japan, Cambridge University Press, Cambridge,
1992.
(e.g., Microsoft Access and Excel). Limited,
functionally based BI capability was used to
analyze and understand the implications of
DrugCo’s data. Business users would attempt to
perform basic ad hoc queries and, when faced
with more complex or time-consuming analyses,
would ask the IT department for help. The
main focus of this stage was to use data to meet
business needs and solve internal problems.
DrugCo’s CIO described how limited capabilities
meant limited analyses:
“If it takes you 45 minutes or an hour to get
an answer… you’re probably not going to
do a lot with it. But if you can do it within
30 seconds or a minute or two, you are
more likely to do more analytics and what-
if cases.”
Because all data use was internal to DrugCo
during Stage 1, inter-organizational trust was
not an issue. Information was used to inform
internal stakeholders and to run the business
more efficiently. Data exploitation was judged to
be going well since problems were being solved
and new insights were being generated. Various
policies were enforced to maintain the internal
security and privacy of DrugCo’s data.
The data exploitation costs in this stage were
the technical cost of building the data warehouse
and connecting it to the reporting tools, and the
analytical cost of analyzing the data.
Stage 2: Connecting to and Sharing
Information with Suppliers
In Stage 2, DrugCo created a secure, cloud-
based portal for communicating with its
suppliers. The portal provided access to point-
of-sale, customer-loyalty and transactional data
(e.g., purchases from DrugCo’s suppliers) and
various BI&A applications. As an analytical data
warehouse platform, it allowed suppliers to work
with and analyze DrugCo’s data so the company
and suppliers could collaborate on mutual
business goals. DrugCo’s Senior Director of
Category Management Support (CMS) explained
the importance of the supplier portal:
“The great thing about this portal and
this information is [that DrugCo and its
suppliers are] working on the same set of
reports a lot of times and we’re using the
same information.”
218 MIS Quarterly Executive | December 2013 (12:4)
misqe.org | © 2013 University of Minnesota
Data Monetization
Table 1: Characteristics of the Four Stages of Data
Monetization
Stage 1: Building
BI&A Capabilities
Stage 2: Connecting
to and Sharing
Information with
Suppliers
Stage 3: Monetizing Data
by Charging for It
Stage 4: Further
Monetizing Data and
Avoiding Analytical
Costs by Leveraging
Suppliers’ Resources
Technical
Capability
Implementing data
warehouse with
basic analytical
tools
Developing a supplier
portal
Extending the
supplier portal with
data integration and
customized reporting
capabilities for data
Offering a scalable
data platform to
accommodate expanded
use of the suppliers’
analytical capabilities
Analytical
Capability
Internally focused,
limited functional
analytical capability
More fully developed
internal and inter-
organizational analytical
capability
Matured internal and
inter-organizational
analytical capabilities;
Learning what data is
saleable
Exploiting analytical
capabilities of suppliers
Type of Trust Not an issue, as
BI&A is internally
focused
Contractual trust Contractual trust;
Goodwill trust
Contractual trust;
Goodwill trust;
Competence trust
Information
Strategy
Informing internally Supply-chain
optimization
Revenue generation Information
transparency
Governance
Mechanisms
Basic performance
metrics;
Information
assurance
Information sharing
contracts;
Data presentation
mechanisms and
standards;
Non-disclosure
agreements (NDAs)
Pricing structure;
Data purchase agreement;
NDAs
Evaluation of supplier-
provided analytics
Achieved Benefits/Associated Costs
Achieved
Benefits
(DrugCo)
Data is used to meet
specific business
needs and solve
problems
Data is shared across
boundaries for supply-
chain efficiency
Data is sold to generate
monetary value and/or
share technical costs
Data is traded for
analytics to gain new
insights;
Cost savings and revenue
growth
Associated
Costs
(DrugCo)
Technical cost;
Analytical cost
Technical cost;
Analytical cost;
Contracting cost;
3PP’s fee
Contracting cost;
3PP’s fee
3PP’s fee
Achieved
Benefits
(Suppliers)
Refined BI&A using the
accessed data
Increased sales through
better understanding of
markets and DrugCo’s
business
Enhanced collaboration
with DrugCo;
Increased sales by shelf
monitoring
Associated
Costs
(Suppliers)
Analytical cost;
Contracting cost
Data cost;
Analytical cost;
Contracting cost
Data cost;
Analytical cost
December 2013 (12:4) | MIS Quarterly Executive 219
Data Monetization: Lessons from a Retailer’s Journey
DrugCo owned the data it put on the supplier
portal, while 3PP offered data-analytics, data-
cleansing and consulting services, and owned
the portal infrastructure. DrugCo sent its data to
3PP, which cleansed it and then uploaded it to the
portal. Data security was enforced by preventing
suppliers from copying or downloading data
from the portal; they could only work with the
data while it was still on the portal. Once it was
connected with its suppliers, DrugCo had to
further develop its analytical capability so it could
respond to new inter-organizational analytical
needs, which imposed additional analytical costs
on DrugCo.
Trust is an important factor when external
parties are involved with data monetization. In
Stage 2, the data-sharing relationship between
DrugCo and its suppliers was still somewhat
immature. Non-disclosure agreements
(NDAs) were used to specify what suppliers
could and could not do with the data. These
agreements created contractual trust—a
mutual understanding between DrugCo and its
suppliers based on the agreements. DrugCo’s
Senior Director of CMS described the contracting
approach:
“We’ve limited the use of the data. It’s
specifically limited to the purpose of
growing the business of our company.”
3PP acted as a liaison between DrugCo and its
suppliers, providing value-adding activities by
hosting DrugCo’s data on the supplier portal, and
BI&A services, administrating the information-
sharing contracts, contracting directly with some
suppliers (e.g., alcohol suppliers, which legally are
not allowed to contract directly with DrugCo to
purchase its data) and managing different aspects
of the relationship, such as negotiating pricing of
DrugCo’s data.
During this stage, data was shared for supply-
chain optimization. The suppliers accessed part
of DrugCo’s data, analyzed it and were able to
enhance their marketing campaigns, production
planning, pricing and inventory management.
The governance of DrugCo’s supplier portal
was designed to be collaborative. Major suppliers
joined an advisory board that oversaw how
the supplier portal was implemented. Voting
was used to prioritize enhancements and to
determine data presentation mechanisms and
standards. The VP of Retail
Solution
s at 3PP
explained the structure and function of the
advisory board:
“[At any time] there’s around 18 to 20
suppliers on [DrugCo’s] advisory board
and there are eight that are on their senior
council … the larger group meets twice
a year and the senior group meets four
times a year ... they prioritize the changes
or enhancements they want to see in the
program and pass them to DrugCo ...
DrugCo is only a member … It’s a user-
driven advisory board.”
DrugCo’s costs during Stage 2 were the
technical cost of building the supplier portal,
the analytical cost for the additional inter-
organization analyses, and the contracting cost
for preparing contracts and NDAs with suppliers
and third parties. 3PP incurred the cost of
hosting the portal and providing additional
analytical services. Suppliers connected to the
portal also incurred contracting costs for the
NDAs and analytical costs for analyzing the data
they accessed. With direct access to the portal,
suppliers could dynamically manipulate vast
amounts of DrugCo data to answer questions on
the fly.
Stage 2 laid the technical foundation (i.e., in
the supplier portal) for data monetization and
showed that DrugCo’s data was valuable to its
suppliers.
Stage 3: Monetizing Data by Charging
for it
In Stage 3, with the supplier portal running
successfully and suppliers having a good feel for
DrugCo’s data and its value, DrugCo began to
extract more value from its data by monetizing it:
“They [retailers in general] accumulate
billions of records every year of point-of-
sales transaction data and they are taking
that huge amount of data and creating
their own commercial data clouds for
their suppliers to analyze … A consumer-
packaged-goods brand can just log in
and see not only how their own products
are doing in those stores but also how a
competitor’s products are doing in those
stores.” VP of Marketing, 3PP
The supplier portal was enhanced by adding
additional data sets (particularly loyalty data)
220 MIS Quarterly Executive | December 2013 (12:4)
misqe.org | © 2013 University of Minnesota
Data Monetization
and customized reporting capabilities to
provide a wider range of reports to the data-
buying suppliers. DrugCo’s internal and inter-
organizational analytical capabilities matured,
and it started to identify what data was saleable.
Data was offered in different packages,
each of which had a different level of data
granularity, reporting capability and price tag.
By now, DrugCo had a dedicated executive on
its merchandising team for selling its data, and
this executive worked with 3PP to market these
data packages directly to DrugCo’s suppliers.
Prices were often negotiated. If a supplier
chose a higher level of information access and
granularity, the price increased. There were four
levels of data packaging—Basic, Bronze, Silver
and Gold—for point-of-sale data (see Table
2). Only a limited number of DrugCo’s major
suppliers were allowed to purchase the highest
Gold level package. As discussed later, a supplier
had to invest resources in its relationship with
DrugCo to become a candidate for the Gold level.
A data-purchase agreement and NDA were
prepared for DrugCo and any supplier who
wanted to buy data. Trust in Stage 3 included
goodwill trust (based on beliefs) in addition to
contractual trust (based on written agreements).
When goodwill trust exists, partners are willing
to go beyond stipulated contractual agreements.
Thus, DrugCo trusted that the supplier would not
only adhere to the data-purchase agreement, but
would also use the data for the benefit of both
parties. In essence, DrugCo’s major suppliers
learned to tell DrugCo when they saw a problem
that needed to be addressed, regardless of
whether doing so was of immediate benefit to
the supplier.
Big suppliers (such Johnson & Johnson,
Procter & Gamble, Coca Cola, PepsiCo, 3M,
Novartis and Unilever) have been applying
analytical tools for a long time to better predict
demand and develop successful marketing
campaigns; they are equipped with significant
know-how in terms of BI&A:
“There are hundreds of CPG [consumer
packaged goods] companies … analyzing
detailed data from retailers … mixing
it together with econometric and
demographic data, weather data, various
kinds of geographic data, and trying
to better understand the markets and
figure out how to better sell the products.”
Cofounder and CEO, 3PP
Table 2: Four Levels of Data Packaging
Level Data Access and Analytics Provided Current No.
of Suppliers
Percentage of
Suppliers
Basic • Supplier items only at POS transaction level detail
filtered by SKU
• Information provided shows supplier inventory level status
• Access provided only through prebuilt reports
358 55.3%
Bronze
Basic Package plus:
• Summaries for all approved classes/categories provided by a
few
prebuilt reports
128 19.8%
Silver
Bronze Package plus:
• All items at POS transaction level detail for approved classes
filtered by class
• Ability to upload up to 10 GB of DrugCo’s data for enhanced
analysis by supplier
• Third-party analysis tool provided for ad-hoc analysis by
supplier
• (Limited) basket view of categories a supplier operates in
82 12.7%
Gold
Silver Package plus:
• (Full) …
Running Head: Organizational Goal Setting and SMART
Analysis1
Organizational Goal Setting and SMART Analysis2
Organizational Goal Setting and SMART Analysis
Michell Muldrow
Unit III
Columbia Southern University
Organizational goal setting of Wall-mart
There are different evaluations in the assessment of the various
distinctions carried in the course of evaluating the different
dimensions of historical data collection and evaluation of
research and development. There are numerous distinctions in
the management of the various implications which are carried
out in the dynamics of change and the implementation of the
market drive (Kumar & Kumar, 2019). Specific consequences
are to be undertaken in the dynamics of change and the
implications of the difference in the system of operations of
wall art.
Specific
The goal, which is implied in the distinctions of the measure of
the change which is assessed in the system of operations, is
evaluated to be a necessary implication in the dynamics of
change factor. The specific goal of being the retail giant of the
world is the target that has been attained through and through
by the organization. Particular considerations are to be
adequately evaluated regarding the course of implied change of
actions and the measure of the goals which have been carried
out by the specific impact of distinctions. There is a measure of
the implications which are assessed to have been executed in
the different consequences of attaining the goal of becoming a
giant (Vivien, 2018).
Measurable
The assessment of the performance has caused the impact of the
organization in being measurable and carrying out the different
dynamics of change in the implications of the various
operations. The factor of the association is assessed to be
carried out in the dynamics of processes (Ferdous, Biswas,
Chowdhury, Chowdhury, & Muthukkumarasamy, 2019). This
measurability is the factor that has been evaluated in the
measure of the different distinctions of change. The
management and the constant evaluation of the market is the
factor which has been thoroughly analyzed in the system of
operations.
Attainable
The assessment of the goal is to communicate the factor that
specific implications are attainable in the dimensions of an
organization. There are certain factors of understanding which
are assessed to be carried out in the course of actions which are
containing the reality factor of being attainable. These are the
integrated propensities of goals which are carried out in the
different distinctions of operations of the organization (Haroun,
2016). The established goals are attainable when they are
different dynamics of change that are carried out in the
depictions of change in the operations of the world.
Relevant
The relevance of the industry with the distinction of the
operations is carried out in the differences of the activities. The
course of significance in the manner of the different factors is
to be carried out in the course of actions which are carried out
in the domains of the operations of corporate set up. There are
different evaluations which are carried out in the various
distinctions which are to be established in the different
direction of relevancy with the industry of the organization.
Time-bound
The assessment of time-bound management is the factor that is
carried out in the dimensions of the course of activities that are
prevailing in a time-bound manner. The implications of the
approach being carried out in the different distinctions of
actions must be portrayed in the appropriate time frame and
method of assessment, which are implying the unusual manner
of the operations. There are precise evaluations which are taken
in the distinction of the efforts which are carried out in the
different time frame of services. There are particular
distinctions which are carried out in the various domains of
operations.
References
Ferdous, M. S., Biswas, K., Chowdhury, M. J., Chowdhury, N.,
& Muthukkumarasamy, V. (2019). Integrated platforms for
blockchain enablement. Advances in Computers , 41-72.
Haroun, I. M. (2016). Exploring Corporate Strategic
Management and Global Expansion on the Case study of
Samsung Electronics. Archives of Business Research.
Kumar, A., & Kumar, S. (2019). Need for Big Data
Technologies: A Review. International Conference on Signal
Processing and Communication, 343-347.
Vivien, S. (2018). Smart Contract Development in Supply Chain
Management–Requirements and Potentials for Utilizing
Blockchain Technology.

More Related Content

Similar to December 2013 (124) MIS Quarterly Executive 213MISQUa.docx

Colab 2019 Making Sense of the Data That Matters
Colab 2019 Making Sense of the Data That MattersColab 2019 Making Sense of the Data That Matters
Colab 2019 Making Sense of the Data That MattersIan Gibbs
 
How Data Science Is Transforming B2B Marketing.pdf
How Data Science Is Transforming B2B Marketing.pdfHow Data Science Is Transforming B2B Marketing.pdf
How Data Science Is Transforming B2B Marketing.pdfCiente
 
enterprise-data-everywhere
enterprise-data-everywhereenterprise-data-everywhere
enterprise-data-everywhereBill Peer
 
2017 Research in Review - report - 19 DEC
2017 Research in Review - report - 19 DEC 2017 Research in Review - report - 19 DEC
2017 Research in Review - report - 19 DEC Lora Cecere
 
Strategies to Monetize Energy Data - How Utilities Can Increase Their 'Earnin...
Strategies to Monetize Energy Data - How Utilities Can Increase Their 'Earnin...Strategies to Monetize Energy Data - How Utilities Can Increase Their 'Earnin...
Strategies to Monetize Energy Data - How Utilities Can Increase Their 'Earnin...Indigo Advisory Group
 
leewayhertz.com-Data analysis workflow using Scikit-learn.pdf
leewayhertz.com-Data analysis workflow using Scikit-learn.pdfleewayhertz.com-Data analysis workflow using Scikit-learn.pdf
leewayhertz.com-Data analysis workflow using Scikit-learn.pdfKristiLBurns
 
Data democratization the key to future proofing data culture
Data democratization the key to future proofing data cultureData democratization the key to future proofing data culture
Data democratization the key to future proofing data culturePolestarsolutions
 
Procurement analytics enabling journey to value zzw03395 usen
Procurement analytics enabling journey to value zzw03395 usenProcurement analytics enabling journey to value zzw03395 usen
Procurement analytics enabling journey to value zzw03395 usenNick Triantafel
 
1. What are the business costs or risks of poor data quality Sup.docx
1.  What are the business costs or risks of poor data quality Sup.docx1.  What are the business costs or risks of poor data quality Sup.docx
1. What are the business costs or risks of poor data quality Sup.docxSONU61709
 
Data Analytics And Business Decision.pdf
Data Analytics And Business Decision.pdfData Analytics And Business Decision.pdf
Data Analytics And Business Decision.pdfCiente
 
Data Analytics And Business Decision.pdf
Data Analytics And Business Decision.pdfData Analytics And Business Decision.pdf
Data Analytics And Business Decision.pdfCiente
 
Integrated Demand Management-When Will We Start Using Downstream Data-7 Nov 2012
Integrated Demand Management-When Will We Start Using Downstream Data-7 Nov 2012Integrated Demand Management-When Will We Start Using Downstream Data-7 Nov 2012
Integrated Demand Management-When Will We Start Using Downstream Data-7 Nov 2012Lora Cecere
 
Big Data Handbook - 8 Juy 2013
Big Data Handbook - 8 Juy 2013Big Data Handbook - 8 Juy 2013
Big Data Handbook - 8 Juy 2013Lora Cecere
 
Semantic 'Radar' Steers Users to Insights in the Data Lake
Semantic 'Radar' Steers Users to Insights in the Data LakeSemantic 'Radar' Steers Users to Insights in the Data Lake
Semantic 'Radar' Steers Users to Insights in the Data LakeCognizant
 
Running head DATABASE AND DATA WAREHOUSING DESIGNDATABASE AND.docx
Running head DATABASE AND DATA WAREHOUSING DESIGNDATABASE AND.docxRunning head DATABASE AND DATA WAREHOUSING DESIGNDATABASE AND.docx
Running head DATABASE AND DATA WAREHOUSING DESIGNDATABASE AND.docxtodd271
 
Data monetization shailesh d ubey
Data monetization   shailesh d ubeyData monetization   shailesh d ubey
Data monetization shailesh d ubeyShailesh Dubey
 

Similar to December 2013 (124) MIS Quarterly Executive 213MISQUa.docx (20)

Colab 2019 Making Sense of the Data That Matters
Colab 2019 Making Sense of the Data That MattersColab 2019 Making Sense of the Data That Matters
Colab 2019 Making Sense of the Data That Matters
 
How Data Science Is Transforming B2B Marketing.pdf
How Data Science Is Transforming B2B Marketing.pdfHow Data Science Is Transforming B2B Marketing.pdf
How Data Science Is Transforming B2B Marketing.pdf
 
Mm ii-t-1-database mkt-l-1-2
Mm ii-t-1-database mkt-l-1-2Mm ii-t-1-database mkt-l-1-2
Mm ii-t-1-database mkt-l-1-2
 
enterprise-data-everywhere
enterprise-data-everywhereenterprise-data-everywhere
enterprise-data-everywhere
 
2017 Research in Review - report - 19 DEC
2017 Research in Review - report - 19 DEC 2017 Research in Review - report - 19 DEC
2017 Research in Review - report - 19 DEC
 
Strategies to Monetize Energy Data - How Utilities Can Increase Their 'Earnin...
Strategies to Monetize Energy Data - How Utilities Can Increase Their 'Earnin...Strategies to Monetize Energy Data - How Utilities Can Increase Their 'Earnin...
Strategies to Monetize Energy Data - How Utilities Can Increase Their 'Earnin...
 
leewayhertz.com-Data analysis workflow using Scikit-learn.pdf
leewayhertz.com-Data analysis workflow using Scikit-learn.pdfleewayhertz.com-Data analysis workflow using Scikit-learn.pdf
leewayhertz.com-Data analysis workflow using Scikit-learn.pdf
 
Data democratization the key to future proofing data culture
Data democratization the key to future proofing data cultureData democratization the key to future proofing data culture
Data democratization the key to future proofing data culture
 
Procurement analytics enabling journey to value zzw03395 usen
Procurement analytics enabling journey to value zzw03395 usenProcurement analytics enabling journey to value zzw03395 usen
Procurement analytics enabling journey to value zzw03395 usen
 
1. What are the business costs or risks of poor data quality Sup.docx
1.  What are the business costs or risks of poor data quality Sup.docx1.  What are the business costs or risks of poor data quality Sup.docx
1. What are the business costs or risks of poor data quality Sup.docx
 
Data Analytics And Business Decision.pdf
Data Analytics And Business Decision.pdfData Analytics And Business Decision.pdf
Data Analytics And Business Decision.pdf
 
Data Analytics And Business Decision.pdf
Data Analytics And Business Decision.pdfData Analytics And Business Decision.pdf
Data Analytics And Business Decision.pdf
 
Integrated Demand Management-When Will We Start Using Downstream Data-7 Nov 2012
Integrated Demand Management-When Will We Start Using Downstream Data-7 Nov 2012Integrated Demand Management-When Will We Start Using Downstream Data-7 Nov 2012
Integrated Demand Management-When Will We Start Using Downstream Data-7 Nov 2012
 
Big Data Handbook - 8 Juy 2013
Big Data Handbook - 8 Juy 2013Big Data Handbook - 8 Juy 2013
Big Data Handbook - 8 Juy 2013
 
Data mining
Data miningData mining
Data mining
 
Big data is a popular term used to describe the exponential growth and availa...
Big data is a popular term used to describe the exponential growth and availa...Big data is a popular term used to describe the exponential growth and availa...
Big data is a popular term used to describe the exponential growth and availa...
 
Semantic 'Radar' Steers Users to Insights in the Data Lake
Semantic 'Radar' Steers Users to Insights in the Data LakeSemantic 'Radar' Steers Users to Insights in the Data Lake
Semantic 'Radar' Steers Users to Insights in the Data Lake
 
Running head DATABASE AND DATA WAREHOUSING DESIGNDATABASE AND.docx
Running head DATABASE AND DATA WAREHOUSING DESIGNDATABASE AND.docxRunning head DATABASE AND DATA WAREHOUSING DESIGNDATABASE AND.docx
Running head DATABASE AND DATA WAREHOUSING DESIGNDATABASE AND.docx
 
Cis 500 assignment 4
Cis 500 assignment 4Cis 500 assignment 4
Cis 500 assignment 4
 
Data monetization shailesh d ubey
Data monetization   shailesh d ubeyData monetization   shailesh d ubey
Data monetization shailesh d ubey
 

More from edwardmarivel

deadline 6 hours 7.3 y 7.47.4.docx
deadline  6 hours 7.3 y 7.47.4.docxdeadline  6 hours 7.3 y 7.47.4.docx
deadline 6 hours 7.3 y 7.47.4.docxedwardmarivel
 
Deadline 6 PM Friday September 27, 201310 Project Management Que.docx
Deadline 6 PM Friday September 27, 201310 Project Management Que.docxDeadline 6 PM Friday September 27, 201310 Project Management Que.docx
Deadline 6 PM Friday September 27, 201310 Project Management Que.docxedwardmarivel
 
DEADLINE 15 HOURS6 PAGES UNDERGRADUATECOURSEWORKHARV.docx
DEADLINE 15 HOURS6 PAGES UNDERGRADUATECOURSEWORKHARV.docxDEADLINE 15 HOURS6 PAGES UNDERGRADUATECOURSEWORKHARV.docx
DEADLINE 15 HOURS6 PAGES UNDERGRADUATECOURSEWORKHARV.docxedwardmarivel
 
De nada.El gusto es mío.Encantada.Me llamo Pepe.Muy bien, grac.docx
De nada.El gusto es mío.Encantada.Me llamo Pepe.Muy bien, grac.docxDe nada.El gusto es mío.Encantada.Me llamo Pepe.Muy bien, grac.docx
De nada.El gusto es mío.Encantada.Me llamo Pepe.Muy bien, grac.docxedwardmarivel
 
DDBA 8307 Week 4 Assignment TemplateJohn DoeDDBA 8.docx
DDBA 8307 Week 4 Assignment TemplateJohn DoeDDBA 8.docxDDBA 8307 Week 4 Assignment TemplateJohn DoeDDBA 8.docx
DDBA 8307 Week 4 Assignment TemplateJohn DoeDDBA 8.docxedwardmarivel
 
DDL 24 hours reading the article and writing a 1-page doubl.docx
DDL 24 hours reading the article and writing a 1-page doubl.docxDDL 24 hours reading the article and writing a 1-page doubl.docx
DDL 24 hours reading the article and writing a 1-page doubl.docxedwardmarivel
 
DCF valuation methodSuper-normal growth modelApplicatio.docx
DCF valuation methodSuper-normal growth modelApplicatio.docxDCF valuation methodSuper-normal growth modelApplicatio.docx
DCF valuation methodSuper-normal growth modelApplicatio.docxedwardmarivel
 
DDBA 8307 Week 2 Assignment ExemplarJohn Doe[footnoteRef1] .docx
DDBA 8307 Week 2 Assignment ExemplarJohn Doe[footnoteRef1] .docxDDBA 8307 Week 2 Assignment ExemplarJohn Doe[footnoteRef1] .docx
DDBA 8307 Week 2 Assignment ExemplarJohn Doe[footnoteRef1] .docxedwardmarivel
 
DBM380 v14Create a DatabaseDBM380 v14Page 2 of 2Create a D.docx
DBM380 v14Create a DatabaseDBM380 v14Page 2 of 2Create a D.docxDBM380 v14Create a DatabaseDBM380 v14Page 2 of 2Create a D.docx
DBM380 v14Create a DatabaseDBM380 v14Page 2 of 2Create a D.docxedwardmarivel
 
DBA CAPSTONE TEMPLATEThe pages in this template are correctl.docx
DBA CAPSTONE TEMPLATEThe pages in this template are correctl.docxDBA CAPSTONE TEMPLATEThe pages in this template are correctl.docx
DBA CAPSTONE TEMPLATEThe pages in this template are correctl.docxedwardmarivel
 
DB3.1 Mexico corruptionDiscuss the connection between pol.docx
DB3.1 Mexico corruptionDiscuss the connection between pol.docxDB3.1 Mexico corruptionDiscuss the connection between pol.docx
DB3.1 Mexico corruptionDiscuss the connection between pol.docxedwardmarivel
 
DB2Pepsi Co and Coke American beverage giants, must adhere to th.docx
DB2Pepsi Co and Coke American beverage giants, must adhere to th.docxDB2Pepsi Co and Coke American beverage giants, must adhere to th.docx
DB2Pepsi Co and Coke American beverage giants, must adhere to th.docxedwardmarivel
 
DB1 What Ive observedHave you ever experienced a self-managed .docx
DB1 What Ive observedHave you ever experienced a self-managed .docxDB1 What Ive observedHave you ever experienced a self-managed .docx
DB1 What Ive observedHave you ever experienced a self-managed .docxedwardmarivel
 
DB Response 1I agree with the decision to search the house. Ther.docx
DB Response 1I agree with the decision to search the house. Ther.docxDB Response 1I agree with the decision to search the house. Ther.docx
DB Response 1I agree with the decision to search the house. Ther.docxedwardmarivel
 
DB Response prompt ZAKChapter 7, Q1.Customers are expecting.docx
DB Response prompt  ZAKChapter 7, Q1.Customers are expecting.docxDB Response prompt  ZAKChapter 7, Q1.Customers are expecting.docx
DB Response prompt ZAKChapter 7, Q1.Customers are expecting.docxedwardmarivel
 
DB Topic of Discussion Information-related CapabilitiesAnalyze .docx
DB Topic of Discussion Information-related CapabilitiesAnalyze .docxDB Topic of Discussion Information-related CapabilitiesAnalyze .docx
DB Topic of Discussion Information-related CapabilitiesAnalyze .docxedwardmarivel
 
DB Instructions Each reply must be 250–300 words with a minim.docx
DB Instructions Each reply must be 250–300 words with a minim.docxDB Instructions Each reply must be 250–300 words with a minim.docx
DB Instructions Each reply must be 250–300 words with a minim.docxedwardmarivel
 
DB Defining White Collar CrimeHow would you define white co.docx
DB Defining White Collar CrimeHow would you define white co.docxDB Defining White Collar CrimeHow would you define white co.docx
DB Defining White Collar CrimeHow would you define white co.docxedwardmarivel
 
DAVID H. ROSENBLOOMSECOND EDITIONAdministrative Law .docx
DAVID H. ROSENBLOOMSECOND EDITIONAdministrative Law .docxDAVID H. ROSENBLOOMSECOND EDITIONAdministrative Law .docx
DAVID H. ROSENBLOOMSECOND EDITIONAdministrative Law .docxedwardmarivel
 

More from edwardmarivel (20)

deadline 6 hours 7.3 y 7.47.4.docx
deadline  6 hours 7.3 y 7.47.4.docxdeadline  6 hours 7.3 y 7.47.4.docx
deadline 6 hours 7.3 y 7.47.4.docx
 
Deadline 6 PM Friday September 27, 201310 Project Management Que.docx
Deadline 6 PM Friday September 27, 201310 Project Management Que.docxDeadline 6 PM Friday September 27, 201310 Project Management Que.docx
Deadline 6 PM Friday September 27, 201310 Project Management Que.docx
 
DEADLINE 15 HOURS6 PAGES UNDERGRADUATECOURSEWORKHARV.docx
DEADLINE 15 HOURS6 PAGES UNDERGRADUATECOURSEWORKHARV.docxDEADLINE 15 HOURS6 PAGES UNDERGRADUATECOURSEWORKHARV.docx
DEADLINE 15 HOURS6 PAGES UNDERGRADUATECOURSEWORKHARV.docx
 
De nada.El gusto es mío.Encantada.Me llamo Pepe.Muy bien, grac.docx
De nada.El gusto es mío.Encantada.Me llamo Pepe.Muy bien, grac.docxDe nada.El gusto es mío.Encantada.Me llamo Pepe.Muy bien, grac.docx
De nada.El gusto es mío.Encantada.Me llamo Pepe.Muy bien, grac.docx
 
DDBA 8307 Week 4 Assignment TemplateJohn DoeDDBA 8.docx
DDBA 8307 Week 4 Assignment TemplateJohn DoeDDBA 8.docxDDBA 8307 Week 4 Assignment TemplateJohn DoeDDBA 8.docx
DDBA 8307 Week 4 Assignment TemplateJohn DoeDDBA 8.docx
 
DDL 24 hours reading the article and writing a 1-page doubl.docx
DDL 24 hours reading the article and writing a 1-page doubl.docxDDL 24 hours reading the article and writing a 1-page doubl.docx
DDL 24 hours reading the article and writing a 1-page doubl.docx
 
DCF valuation methodSuper-normal growth modelApplicatio.docx
DCF valuation methodSuper-normal growth modelApplicatio.docxDCF valuation methodSuper-normal growth modelApplicatio.docx
DCF valuation methodSuper-normal growth modelApplicatio.docx
 
ddr-.docx
ddr-.docxddr-.docx
ddr-.docx
 
DDBA 8307 Week 2 Assignment ExemplarJohn Doe[footnoteRef1] .docx
DDBA 8307 Week 2 Assignment ExemplarJohn Doe[footnoteRef1] .docxDDBA 8307 Week 2 Assignment ExemplarJohn Doe[footnoteRef1] .docx
DDBA 8307 Week 2 Assignment ExemplarJohn Doe[footnoteRef1] .docx
 
DBM380 v14Create a DatabaseDBM380 v14Page 2 of 2Create a D.docx
DBM380 v14Create a DatabaseDBM380 v14Page 2 of 2Create a D.docxDBM380 v14Create a DatabaseDBM380 v14Page 2 of 2Create a D.docx
DBM380 v14Create a DatabaseDBM380 v14Page 2 of 2Create a D.docx
 
DBA CAPSTONE TEMPLATEThe pages in this template are correctl.docx
DBA CAPSTONE TEMPLATEThe pages in this template are correctl.docxDBA CAPSTONE TEMPLATEThe pages in this template are correctl.docx
DBA CAPSTONE TEMPLATEThe pages in this template are correctl.docx
 
DB3.1 Mexico corruptionDiscuss the connection between pol.docx
DB3.1 Mexico corruptionDiscuss the connection between pol.docxDB3.1 Mexico corruptionDiscuss the connection between pol.docx
DB3.1 Mexico corruptionDiscuss the connection between pol.docx
 
DB2Pepsi Co and Coke American beverage giants, must adhere to th.docx
DB2Pepsi Co and Coke American beverage giants, must adhere to th.docxDB2Pepsi Co and Coke American beverage giants, must adhere to th.docx
DB2Pepsi Co and Coke American beverage giants, must adhere to th.docx
 
DB1 What Ive observedHave you ever experienced a self-managed .docx
DB1 What Ive observedHave you ever experienced a self-managed .docxDB1 What Ive observedHave you ever experienced a self-managed .docx
DB1 What Ive observedHave you ever experienced a self-managed .docx
 
DB Response 1I agree with the decision to search the house. Ther.docx
DB Response 1I agree with the decision to search the house. Ther.docxDB Response 1I agree with the decision to search the house. Ther.docx
DB Response 1I agree with the decision to search the house. Ther.docx
 
DB Response prompt ZAKChapter 7, Q1.Customers are expecting.docx
DB Response prompt  ZAKChapter 7, Q1.Customers are expecting.docxDB Response prompt  ZAKChapter 7, Q1.Customers are expecting.docx
DB Response prompt ZAKChapter 7, Q1.Customers are expecting.docx
 
DB Topic of Discussion Information-related CapabilitiesAnalyze .docx
DB Topic of Discussion Information-related CapabilitiesAnalyze .docxDB Topic of Discussion Information-related CapabilitiesAnalyze .docx
DB Topic of Discussion Information-related CapabilitiesAnalyze .docx
 
DB Instructions Each reply must be 250–300 words with a minim.docx
DB Instructions Each reply must be 250–300 words with a minim.docxDB Instructions Each reply must be 250–300 words with a minim.docx
DB Instructions Each reply must be 250–300 words with a minim.docx
 
DB Defining White Collar CrimeHow would you define white co.docx
DB Defining White Collar CrimeHow would you define white co.docxDB Defining White Collar CrimeHow would you define white co.docx
DB Defining White Collar CrimeHow would you define white co.docx
 
DAVID H. ROSENBLOOMSECOND EDITIONAdministrative Law .docx
DAVID H. ROSENBLOOMSECOND EDITIONAdministrative Law .docxDAVID H. ROSENBLOOMSECOND EDITIONAdministrative Law .docx
DAVID H. ROSENBLOOMSECOND EDITIONAdministrative Law .docx
 

Recently uploaded

Stl Algorithms in C++ jjjjjjjjjjjjjjjjjj
Stl Algorithms in C++ jjjjjjjjjjjjjjjjjjStl Algorithms in C++ jjjjjjjjjjjjjjjjjj
Stl Algorithms in C++ jjjjjjjjjjjjjjjjjjMohammed Sikander
 
Đề tieng anh thpt 2024 danh cho cac ban hoc sinh
Đề tieng anh thpt 2024 danh cho cac ban hoc sinhĐề tieng anh thpt 2024 danh cho cac ban hoc sinh
Đề tieng anh thpt 2024 danh cho cac ban hoc sinhleson0603
 
Book Review of Run For Your Life Powerpoint
Book Review of Run For Your Life PowerpointBook Review of Run For Your Life Powerpoint
Book Review of Run For Your Life Powerpoint23600690
 
24 ĐỀ THAM KHẢO KÌ THI TUYỂN SINH VÀO LỚP 10 MÔN TIẾNG ANH SỞ GIÁO DỤC HẢI DƯ...
24 ĐỀ THAM KHẢO KÌ THI TUYỂN SINH VÀO LỚP 10 MÔN TIẾNG ANH SỞ GIÁO DỤC HẢI DƯ...24 ĐỀ THAM KHẢO KÌ THI TUYỂN SINH VÀO LỚP 10 MÔN TIẾNG ANH SỞ GIÁO DỤC HẢI DƯ...
24 ĐỀ THAM KHẢO KÌ THI TUYỂN SINH VÀO LỚP 10 MÔN TIẾNG ANH SỞ GIÁO DỤC HẢI DƯ...Nguyen Thanh Tu Collection
 
The Story of Village Palampur Class 9 Free Study Material PDF
The Story of Village Palampur Class 9 Free Study Material PDFThe Story of Village Palampur Class 9 Free Study Material PDF
The Story of Village Palampur Class 9 Free Study Material PDFVivekanand Anglo Vedic Academy
 
When Quality Assurance Meets Innovation in Higher Education - Report launch w...
When Quality Assurance Meets Innovation in Higher Education - Report launch w...When Quality Assurance Meets Innovation in Higher Education - Report launch w...
When Quality Assurance Meets Innovation in Higher Education - Report launch w...Gary Wood
 
Spellings Wk 4 and Wk 5 for Grade 4 at CAPS
Spellings Wk 4 and Wk 5 for Grade 4 at CAPSSpellings Wk 4 and Wk 5 for Grade 4 at CAPS
Spellings Wk 4 and Wk 5 for Grade 4 at CAPSAnaAcapella
 
SPLICE Working Group: Reusable Code Examples
SPLICE Working Group:Reusable Code ExamplesSPLICE Working Group:Reusable Code Examples
SPLICE Working Group: Reusable Code ExamplesPeter Brusilovsky
 
How to Manage Website in Odoo 17 Studio App.pptx
How to Manage Website in Odoo 17 Studio App.pptxHow to Manage Website in Odoo 17 Studio App.pptx
How to Manage Website in Odoo 17 Studio App.pptxCeline George
 
TỔNG HỢP HƠN 100 ĐỀ THI THỬ TỐT NGHIỆP THPT TOÁN 2024 - TỪ CÁC TRƯỜNG, TRƯỜNG...
TỔNG HỢP HƠN 100 ĐỀ THI THỬ TỐT NGHIỆP THPT TOÁN 2024 - TỪ CÁC TRƯỜNG, TRƯỜNG...TỔNG HỢP HƠN 100 ĐỀ THI THỬ TỐT NGHIỆP THPT TOÁN 2024 - TỪ CÁC TRƯỜNG, TRƯỜNG...
TỔNG HỢP HƠN 100 ĐỀ THI THỬ TỐT NGHIỆP THPT TOÁN 2024 - TỪ CÁC TRƯỜNG, TRƯỜNG...Nguyen Thanh Tu Collection
 
Trauma-Informed Leadership - Five Practical Principles
Trauma-Informed Leadership - Five Practical PrinciplesTrauma-Informed Leadership - Five Practical Principles
Trauma-Informed Leadership - Five Practical PrinciplesPooky Knightsmith
 
會考英文會考英文會考英文會考英文會考英文會考英文會考英文會考英文會考英文會考英文會考英文
會考英文會考英文會考英文會考英文會考英文會考英文會考英文會考英文會考英文會考英文會考英文會考英文會考英文會考英文會考英文會考英文會考英文會考英文會考英文會考英文會考英文會考英文
會考英文會考英文會考英文會考英文會考英文會考英文會考英文會考英文會考英文會考英文會考英文中 央社
 
How to Send Pro Forma Invoice to Your Customers in Odoo 17
How to Send Pro Forma Invoice to Your Customers in Odoo 17How to Send Pro Forma Invoice to Your Customers in Odoo 17
How to Send Pro Forma Invoice to Your Customers in Odoo 17Celine George
 
FICTIONAL SALESMAN/SALESMAN SNSW 2024.pdf
FICTIONAL SALESMAN/SALESMAN SNSW 2024.pdfFICTIONAL SALESMAN/SALESMAN SNSW 2024.pdf
FICTIONAL SALESMAN/SALESMAN SNSW 2024.pdfPondicherry University
 
Observing-Correct-Grammar-in-Making-Definitions.pptx
Observing-Correct-Grammar-in-Making-Definitions.pptxObserving-Correct-Grammar-in-Making-Definitions.pptx
Observing-Correct-Grammar-in-Making-Definitions.pptxAdelaideRefugio
 
Basic Civil Engineering notes on Transportation Engineering & Modes of Transport
Basic Civil Engineering notes on Transportation Engineering & Modes of TransportBasic Civil Engineering notes on Transportation Engineering & Modes of Transport
Basic Civil Engineering notes on Transportation Engineering & Modes of TransportDenish Jangid
 
Sternal Fractures & Dislocations - EMGuidewire Radiology Reading Room
Sternal Fractures & Dislocations - EMGuidewire Radiology Reading RoomSternal Fractures & Dislocations - EMGuidewire Radiology Reading Room
Sternal Fractures & Dislocations - EMGuidewire Radiology Reading RoomSean M. Fox
 
PSYPACT- Practicing Over State Lines May 2024.pptx
PSYPACT- Practicing Over State Lines May 2024.pptxPSYPACT- Practicing Over State Lines May 2024.pptx
PSYPACT- Practicing Over State Lines May 2024.pptxMarlene Maheu
 

Recently uploaded (20)

Stl Algorithms in C++ jjjjjjjjjjjjjjjjjj
Stl Algorithms in C++ jjjjjjjjjjjjjjjjjjStl Algorithms in C++ jjjjjjjjjjjjjjjjjj
Stl Algorithms in C++ jjjjjjjjjjjjjjjjjj
 
Đề tieng anh thpt 2024 danh cho cac ban hoc sinh
Đề tieng anh thpt 2024 danh cho cac ban hoc sinhĐề tieng anh thpt 2024 danh cho cac ban hoc sinh
Đề tieng anh thpt 2024 danh cho cac ban hoc sinh
 
Including Mental Health Support in Project Delivery, 14 May.pdf
Including Mental Health Support in Project Delivery, 14 May.pdfIncluding Mental Health Support in Project Delivery, 14 May.pdf
Including Mental Health Support in Project Delivery, 14 May.pdf
 
Book Review of Run For Your Life Powerpoint
Book Review of Run For Your Life PowerpointBook Review of Run For Your Life Powerpoint
Book Review of Run For Your Life Powerpoint
 
24 ĐỀ THAM KHẢO KÌ THI TUYỂN SINH VÀO LỚP 10 MÔN TIẾNG ANH SỞ GIÁO DỤC HẢI DƯ...
24 ĐỀ THAM KHẢO KÌ THI TUYỂN SINH VÀO LỚP 10 MÔN TIẾNG ANH SỞ GIÁO DỤC HẢI DƯ...24 ĐỀ THAM KHẢO KÌ THI TUYỂN SINH VÀO LỚP 10 MÔN TIẾNG ANH SỞ GIÁO DỤC HẢI DƯ...
24 ĐỀ THAM KHẢO KÌ THI TUYỂN SINH VÀO LỚP 10 MÔN TIẾNG ANH SỞ GIÁO DỤC HẢI DƯ...
 
The Story of Village Palampur Class 9 Free Study Material PDF
The Story of Village Palampur Class 9 Free Study Material PDFThe Story of Village Palampur Class 9 Free Study Material PDF
The Story of Village Palampur Class 9 Free Study Material PDF
 
When Quality Assurance Meets Innovation in Higher Education - Report launch w...
When Quality Assurance Meets Innovation in Higher Education - Report launch w...When Quality Assurance Meets Innovation in Higher Education - Report launch w...
When Quality Assurance Meets Innovation in Higher Education - Report launch w...
 
Spellings Wk 4 and Wk 5 for Grade 4 at CAPS
Spellings Wk 4 and Wk 5 for Grade 4 at CAPSSpellings Wk 4 and Wk 5 for Grade 4 at CAPS
Spellings Wk 4 and Wk 5 for Grade 4 at CAPS
 
SPLICE Working Group: Reusable Code Examples
SPLICE Working Group:Reusable Code ExamplesSPLICE Working Group:Reusable Code Examples
SPLICE Working Group: Reusable Code Examples
 
How to Manage Website in Odoo 17 Studio App.pptx
How to Manage Website in Odoo 17 Studio App.pptxHow to Manage Website in Odoo 17 Studio App.pptx
How to Manage Website in Odoo 17 Studio App.pptx
 
TỔNG HỢP HƠN 100 ĐỀ THI THỬ TỐT NGHIỆP THPT TOÁN 2024 - TỪ CÁC TRƯỜNG, TRƯỜNG...
TỔNG HỢP HƠN 100 ĐỀ THI THỬ TỐT NGHIỆP THPT TOÁN 2024 - TỪ CÁC TRƯỜNG, TRƯỜNG...TỔNG HỢP HƠN 100 ĐỀ THI THỬ TỐT NGHIỆP THPT TOÁN 2024 - TỪ CÁC TRƯỜNG, TRƯỜNG...
TỔNG HỢP HƠN 100 ĐỀ THI THỬ TỐT NGHIỆP THPT TOÁN 2024 - TỪ CÁC TRƯỜNG, TRƯỜNG...
 
Trauma-Informed Leadership - Five Practical Principles
Trauma-Informed Leadership - Five Practical PrinciplesTrauma-Informed Leadership - Five Practical Principles
Trauma-Informed Leadership - Five Practical Principles
 
會考英文會考英文會考英文會考英文會考英文會考英文會考英文會考英文會考英文會考英文會考英文
會考英文會考英文會考英文會考英文會考英文會考英文會考英文會考英文會考英文會考英文會考英文會考英文會考英文會考英文會考英文會考英文會考英文會考英文會考英文會考英文會考英文會考英文
會考英文會考英文會考英文會考英文會考英文會考英文會考英文會考英文會考英文會考英文會考英文
 
How to Send Pro Forma Invoice to Your Customers in Odoo 17
How to Send Pro Forma Invoice to Your Customers in Odoo 17How to Send Pro Forma Invoice to Your Customers in Odoo 17
How to Send Pro Forma Invoice to Your Customers in Odoo 17
 
FICTIONAL SALESMAN/SALESMAN SNSW 2024.pdf
FICTIONAL SALESMAN/SALESMAN SNSW 2024.pdfFICTIONAL SALESMAN/SALESMAN SNSW 2024.pdf
FICTIONAL SALESMAN/SALESMAN SNSW 2024.pdf
 
Observing-Correct-Grammar-in-Making-Definitions.pptx
Observing-Correct-Grammar-in-Making-Definitions.pptxObserving-Correct-Grammar-in-Making-Definitions.pptx
Observing-Correct-Grammar-in-Making-Definitions.pptx
 
Basic Civil Engineering notes on Transportation Engineering & Modes of Transport
Basic Civil Engineering notes on Transportation Engineering & Modes of TransportBasic Civil Engineering notes on Transportation Engineering & Modes of Transport
Basic Civil Engineering notes on Transportation Engineering & Modes of Transport
 
Sternal Fractures & Dislocations - EMGuidewire Radiology Reading Room
Sternal Fractures & Dislocations - EMGuidewire Radiology Reading RoomSternal Fractures & Dislocations - EMGuidewire Radiology Reading Room
Sternal Fractures & Dislocations - EMGuidewire Radiology Reading Room
 
OS-operating systems- ch05 (CPU Scheduling) ...
OS-operating systems- ch05 (CPU Scheduling) ...OS-operating systems- ch05 (CPU Scheduling) ...
OS-operating systems- ch05 (CPU Scheduling) ...
 
PSYPACT- Practicing Over State Lines May 2024.pptx
PSYPACT- Practicing Over State Lines May 2024.pptxPSYPACT- Practicing Over State Lines May 2024.pptx
PSYPACT- Practicing Over State Lines May 2024.pptx
 

December 2013 (124) MIS Quarterly Executive 213MISQUa.docx

  • 1. December 2013 (12:4) | MIS Quarterly Executive 213 MISQUarterly Executive Data Monetization in the Supply Chain1,2 Data is now being created and transferred at an unprecedented rate, fueling the growth in business intelligence and analytics (BI&A)3 to discover opportunities for improving and innovating in supply chains and to enhance supply-chain collaboration.4 In retailing, new supplier/customer ecosystems are emerging in which BI&A services are offered through a supplier portal, which can be cloud-based. Cloud-based BI&A platforms allow retailers and their suppliers to share data and analytics, often for a price. Or a company may monetize its data by exchanging it for other benefits (e.g., merchandising benefits). These data-sharing ecosystems often involve new players (e.g., public cloud platform providers and/or third-party data coordinators, negotiators or analysts). Many companies would like to monetize their data. Data monetization is when the intangible value of data is converted into real value, usually by selling it. Data may also be monetized by 1 Cynthia Beath, Jeanne Ross and Barbara Wixom are the accepting senior editors for this article.
  • 2. 2 An earlier version of this article was presented at the pre-ICIS SIM/MISQE workshop in Orlando, Florida, in December 2012. We are grateful to Omar El Sawy and other participants at the workshop for their insightful comments. We would also like to thank the anonymous retailer and big data analytics company that provided so much time and insight concerning their experiences with monetizing big data. 3 For background information on big data and BI&A, see Chen, H., Chiang, R. H. L. and Storey, V. C. “Business Intelligence and Analytics,” MIS Quarterly (36:4), 2012, pp. 1165-1188; Hopkins, M. S., LaValle, S., Lesser, E., Shockley, R. and Kruschwitz, N. “Big Data, Analytics and the Path from Insights to Value,” Sloan Management Review (52:2), 2011, pp. 21-32; and Wixom, B. H., Watson, H. J. and Werner, T. “Developing an Enterprise Business Intelligence Capability: The Norfolk Southern Journey,” MIS Quarterly Executive (10:2), 2011, pp. 61-71. 4 For a discussion on BI as an IT capability for supply-chain collaboration, see Rai, A., Im, G. and Hornyak, R. “How CIOs Can Align IT capabilities for Supply Chain Relationships,” MIS Quarterly Executive (8:1), 2009, pp. 9-18. Data Monetization: Lessons from a Retailer’s Journey In today’s era of big data, business intelligence and analytics, and cloud computing, the previously elusive goal of data monetization has become more achievable. Our analysis of a four-stage journey of a leading U.S. retailer identifies the potential benefits and
  • 3. drawbacks of data monetization. Based on this company’s experiences, we provide lessons that can help other companies considering data monetization initiatives.1,2 Mohammad S. Najjar University of Memphis (U.S.) William J. Kettinger University of Memphis (U.S.) 214 MIS Quarterly Executive | December 2013 (12:4) misqe.org | © 2013 University of Minnesota Data Monetization converting it into other tangible benefits (e.g., supplier funded advertising and discounts), or by avoiding costs (e.g., IT costs). Potential buyers of an organization’s data include a direct supplier, an upstream supply-chain partner, a data aggregator, an analytics service provider or even a competitor. Three current IT trends are enhancing the potential for data monetization: big data, BI&A and the cloud. Retail firms, with their exacting merchandising strategies and tight supply-chain relationships, have taken the lead in demonstrating that monetizing data can provide a significant revenue stream and be an IT cost-sharing mechanism. Point-of-sale, consumer-loyalty and inventory data can be sold to suppliers, and some of the cost of analyzing a retailer’s data can be recovered
  • 4. from its suppliers. Research has shown that data sharing in the supply chain improves supply-chain performance. Suppliers typically are interested in using a retailer’s point-of-sale data to enhance planning and better manage inventory, thus reducing the bullwhip effect5 (i.e., the phenomenon of demand variability amplification). Manufacturers can use downstream data about retail sales to improve product design, optimize operations and develop fact-based marketing and promotional campaigns. The availability of sales data to the supply chain means that demand can be more accurately forecast and, hence, inventory levels can be better predicted; in some cases, assemble- to-order can be achieved. Some suppliers may even use such data for strategic decisions by looking for product affinities to make merger or acquisition decisions. Furthermore, data sharing can be a strategic tool in managing supply chains and channel relationships; sharing consumer or market data with supply-chain partners can influence their behavior.6 Nevertheless, a company must decide 5 See Lee, H. L., Padmanabhan, V. and Whang, S. “The Bullwhip Effect in Supply Chains,” Sloan Management Review (38:3), 1997, pp. 93-102. 6 For more discussion on the benefits of data sharing in the supply chain, see Zhou, H. and Benton Jr., W. C. “Supply Chain Practice and Information Sharing,” Journal of Operations Management
  • 5. (25:6), 2007, pp. 1348-1365; Eyuboglu, N. and Atac, O. A. “Information Power: A Means for Increased Control in Channels of Distribution,” Psychology & Marketing (8:3), 1991, pp. 197-213; Waller, M., Johnson, M. E. and Davis, T. “Vendor-Managed Inventory in the Retail Supply Chain,” Journal of Business Logistics (20:1), 1999, pp. 183-203; and Lee, H. L., Padmanabhan, V. and Whang, S., op. cit., 2004, pp. 1875-1886. whether and when sharing its data with suppliers and other partners will pay off. The benefits a data-sharing strategy will have for the overall supply chain and distribution channel must be balanced against the benefits of holding data close to the chest.7 While the improvement in supply-chain performance might be a good reason for companies to share data with supply-chain partners, a more explicit direct dollar value of the data can be another tempting motivation. There are several challenges in involving suppliers in monetizing data. Selling data to suppliers may eliminate the competitive advantage that can be gained from asymmetric8 information. Contracts have to be carefully prepared to ensure the data sold or shared is used for the mutual benefit of the firm and its partners. Trust has to be nurtured. The privacy and security of a company’s data may be at risk if appropriate assurance practices are not established. Data packaging has to be considered
  • 6. to identify what data can be made available for sale and in what format and at what price. Pricing models need to be developed to take account of the associated cost of making data available and its value to the buyer. A company must identify a suitable marketing model for its data. Although data monetization best practices have yet to be identified, this article describes how a major U.S. retailer tackled these challenges. (The research we conducted to create this case study is described in the Appendix.) Pathways to Data Monetization Data monetization requires a strategic choice on which of several pathways to follow. It is important to assess the technical (data infrastructure) and analytical (human) capabilities of the company to determine which strategic pathway a company should choose for monetizing its data. The technical capability includes the hardware, software and network capabilities that enable the company to collect, 7 For more discussion on the benefits of data sharing in the supply chain, see: Zhou, H. and Benton Jr., W. C., op. cit., 2007; Eyuboglu, N. and Atac, O. A., op. cit., 1991; Waller, M., Johnson, M. E., and Davis, T., op. cit., 1999; and Lee, H. L., Padmanabhan, V., and Whang, S., op. cit., 2004. 8 Information asymmetries occur when two people have different information about the same thing. If one has additional inside information, he or she can leverage or take advantage of that
  • 7. information. December 2013 (12:4) | MIS Quarterly Executive 215 Data Monetization: Lessons from a Retailer’s Journey store and retrieve its data. The analytical capability is the mathematical and business analytical knowledge and skills of the employees in the company or in supplier firms. A company that has the data and the know-how (i.e., people and BI&A) to use the data properly will have an advantage in the era of big data. If both capabilities are low, then the company has three potential pathways to transition to the high capabilities that will enable it to monetize its data (see Figure 1). Pathway 1: Move Direct to Higher Risk and High Reward This direct pathway can be a riskier path to data monetization, as it requires simultaneously building both technical and analytical capabilities. As such, it requires the largest initial investment of the three alternative pathways. To follow this pathway, a company must invest in developing its technical infrastructure while hiring and training employees with the required business, mathematical and analytical skills. While costly, following this pathway will quickly position a company to be ready for monetizing its data and collaborating with supply-chain partners.
  • 8. Pathway 2: Build Analytical Capability First Following this pathway, a company chooses to develop its analytical capability first. This requires training employees and/or hiring business analysts with the required set of business, mathematical and analytical skills. As its analytical capability grow, the company may leverage them by generating more data (from internal sources) or buying data (from external sources). But growing an in-house analytical capability may not be sufficient to reach the point where the company can demonstrate the value of its big data and thus pave the way to data monetization. It may also require the company’s technical capability to be expanded. This pathway requires a higher internal investment to develop the in-house analytical capability. Pathway 3: Build Technical Data Infrastructure First Instead of first developing its own analytical capability, a company may choose to extend or outsource its technical data infrastructure to produce an attractive collection of data that can be sold to suppliers. The creation of an appropriate digital platform is a prerequisite for a company and its suppliers to share data securely. A company can build this platform internally or use the expertise of a service provider; the use Figure 1: Three Pathways to Data Monetization—Moving From Low-Low to High-High Capabilities
  • 9. Build both capabilities internally or hire a third party Acquire (buy) data to leverage your analytical capability Exploit suppliers’ BI&A Monetize and dig deeper collectively as partners Technical Capability Analytical Capability Low Low High High 1 2 3
  • 10. 216 MIS Quarterly Executive | December 2013 (12:4) misqe.org | © 2013 University of Minnesota Data Monetization of cloud-based infrastructure can increase the flexibility, scalability and speed of developing the platform. By building a platform that will enable it to market its saleable data, a company can more quickly monetize its data and possibly avoid some analytical costs by leveraging the analytical capabilities of its suppliers rather than developing the analytical capability in-house. This pathway maximizes the potential data monetization pay-off because it enables sales of data and reduces startup costs. However, it does make the company more reliant on its partners as major sources of analytics. The Data Monetization Journey of “DrugCo” The case of “DrugCo,” a U.S.-based Fortune 500 drug retailer with several thousand stores in more than half of U.S. states, illustrates a company that has followed Pathway 3. This company, which wishes to remain anonymous, is recognized as being relatively mature in BI and data use, and it has been monetizing its data for almost 10 years. The case shows how cost and the willingness to work with external parties and openly share data were important issues that motivated DrugCo to monetize its data. Like other companies in the small-box retailing sector, DrugCo has:
  • 11. ● Many retail locations with narrowly defined geographical boundaries ● Limited shelf space ● Many stock-keeping units (SKUs) across the company ● A diverse customer base ● Differing inventories within each location to satisfy the local customer needs. For DrugCo, data analysis is crucial for accurately assessing marketing campaigns, analyzing sales patterns, examining on-shelf availability and inventory levels, and customizing SKUs for each store based on its unique local consumer demand. We describe key events that took place in the company, and we present a four-stage model that illustrates the four key stages it went through on its data monetization journey (the stages are depicted in Figure 2). We also provide lessons learned from DrugCo’s journey for other managers as they grapple with their data monetization decisions. In Stage 1, Building BI&A capabilities, DrugCo built its technical and analytical capabilities to address internal business needs. In Stage 2, Connecting to and sharing information with suppliers, DrugCo connected to its supply-chain partners and started to share
  • 12. information with them through its cloud-based Figure 2: DrugCo’s Four-Stage Data Monetization Journey Stage Benefits (Value) of Data Stage 1: Building BI&A capabilities Stage 2: Connecting to and sharing information with suppliers Stage 3: Monetizing data by charging for it Stage 4: Further monetizing data and avoiding analytical costs by
  • 13. leveraging suppliers’ resources December 2013 (12:4) | MIS Quarterly Executive 217 Data Monetization: Lessons from a Retailer’s Journey supplier portal, hosted by 3PP (a third-party data analytics firm that works with DrugCo and which also wishes to remain anonymous). In Stage 3, Monetizing data by charging for it, DrugCo started selling its data to suppliers via its supplier portal. In Stage 4, Further monetizing data and avoiding analytical costs by leveraging suppliers’ resources, DrugCo leveraged its suppliers’ data analytical capabilities and avoided some of the costs of its analytical function. This stage continues to the present day. The characteristics of the four stages are described in Table 1. The stages differ in the technical and analytical (especially in people) capabilities the company required, the type of trust9 built, the focus of DrugCo’s information strategy, governance mechanisms, and the costs incurred and benefits achieved by various stakeholders. While there has been ample discussion of the first two stages, we were surprised by the third stage and even more surprised by the fourth.
  • 14. As DrugCo moved from one stage to the next, the benefits realized from its data increased. DrugCo’s data was monetized in the form of revenue generated directly from selling the data, as well as through a decrease in labor and infrastructure costs for analysis. The company also realized benefits from new business opportunities associated with new analytical insights and enhanced its collaboration with suppliers. Stage 1: Building BI&A Capabilities The growth of DrugCo’s data sources meant that its traditional databases, database management systems and analytical tools became slow and inefficient. DrugCo’s VP of Pharmacy Services described this environment: “The database … probably had about 1.2 to 1.3 million transactions a day and those transactions were very long … there were literally hundreds of fields on one of these transactions that could be evaluated.” In response, DrugCo improved its in-house technical data capability by developing a data warehouse and using basic data analytical tools 9 Trust is categorized into contractual, goodwill and competence; see Sako, M. Prices, Quality and Trust: Inter-firm Relations in Britain and Japan, Cambridge University Press, Cambridge, 1992.
  • 15. (e.g., Microsoft Access and Excel). Limited, functionally based BI capability was used to analyze and understand the implications of DrugCo’s data. Business users would attempt to perform basic ad hoc queries and, when faced with more complex or time-consuming analyses, would ask the IT department for help. The main focus of this stage was to use data to meet business needs and solve internal problems. DrugCo’s CIO described how limited capabilities meant limited analyses: “If it takes you 45 minutes or an hour to get an answer… you’re probably not going to do a lot with it. But if you can do it within 30 seconds or a minute or two, you are more likely to do more analytics and what- if cases.” Because all data use was internal to DrugCo during Stage 1, inter-organizational trust was not an issue. Information was used to inform internal stakeholders and to run the business more efficiently. Data exploitation was judged to be going well since problems were being solved and new insights were being generated. Various policies were enforced to maintain the internal security and privacy of DrugCo’s data. The data exploitation costs in this stage were the technical cost of building the data warehouse and connecting it to the reporting tools, and the analytical cost of analyzing the data. Stage 2: Connecting to and Sharing Information with Suppliers
  • 16. In Stage 2, DrugCo created a secure, cloud- based portal for communicating with its suppliers. The portal provided access to point- of-sale, customer-loyalty and transactional data (e.g., purchases from DrugCo’s suppliers) and various BI&A applications. As an analytical data warehouse platform, it allowed suppliers to work with and analyze DrugCo’s data so the company and suppliers could collaborate on mutual business goals. DrugCo’s Senior Director of Category Management Support (CMS) explained the importance of the supplier portal: “The great thing about this portal and this information is [that DrugCo and its suppliers are] working on the same set of reports a lot of times and we’re using the same information.” 218 MIS Quarterly Executive | December 2013 (12:4) misqe.org | © 2013 University of Minnesota Data Monetization Table 1: Characteristics of the Four Stages of Data Monetization Stage 1: Building BI&A Capabilities Stage 2: Connecting to and Sharing Information with
  • 17. Suppliers Stage 3: Monetizing Data by Charging for It Stage 4: Further Monetizing Data and Avoiding Analytical Costs by Leveraging Suppliers’ Resources Technical Capability Implementing data warehouse with basic analytical tools Developing a supplier portal Extending the supplier portal with data integration and customized reporting capabilities for data Offering a scalable data platform to accommodate expanded use of the suppliers’ analytical capabilities Analytical Capability
  • 18. Internally focused, limited functional analytical capability More fully developed internal and inter- organizational analytical capability Matured internal and inter-organizational analytical capabilities; Learning what data is saleable Exploiting analytical capabilities of suppliers Type of Trust Not an issue, as BI&A is internally focused Contractual trust Contractual trust; Goodwill trust Contractual trust; Goodwill trust; Competence trust Information Strategy Informing internally Supply-chain optimization
  • 19. Revenue generation Information transparency Governance Mechanisms Basic performance metrics; Information assurance Information sharing contracts; Data presentation mechanisms and standards; Non-disclosure agreements (NDAs) Pricing structure; Data purchase agreement; NDAs Evaluation of supplier- provided analytics Achieved Benefits/Associated Costs Achieved Benefits (DrugCo) Data is used to meet specific business needs and solve problems
  • 20. Data is shared across boundaries for supply- chain efficiency Data is sold to generate monetary value and/or share technical costs Data is traded for analytics to gain new insights; Cost savings and revenue growth Associated Costs (DrugCo) Technical cost; Analytical cost Technical cost; Analytical cost; Contracting cost; 3PP’s fee Contracting cost; 3PP’s fee 3PP’s fee Achieved Benefits (Suppliers)
  • 21. Refined BI&A using the accessed data Increased sales through better understanding of markets and DrugCo’s business Enhanced collaboration with DrugCo; Increased sales by shelf monitoring Associated Costs (Suppliers) Analytical cost; Contracting cost Data cost; Analytical cost; Contracting cost Data cost; Analytical cost December 2013 (12:4) | MIS Quarterly Executive 219 Data Monetization: Lessons from a Retailer’s Journey DrugCo owned the data it put on the supplier portal, while 3PP offered data-analytics, data- cleansing and consulting services, and owned
  • 22. the portal infrastructure. DrugCo sent its data to 3PP, which cleansed it and then uploaded it to the portal. Data security was enforced by preventing suppliers from copying or downloading data from the portal; they could only work with the data while it was still on the portal. Once it was connected with its suppliers, DrugCo had to further develop its analytical capability so it could respond to new inter-organizational analytical needs, which imposed additional analytical costs on DrugCo. Trust is an important factor when external parties are involved with data monetization. In Stage 2, the data-sharing relationship between DrugCo and its suppliers was still somewhat immature. Non-disclosure agreements (NDAs) were used to specify what suppliers could and could not do with the data. These agreements created contractual trust—a mutual understanding between DrugCo and its suppliers based on the agreements. DrugCo’s Senior Director of CMS described the contracting approach: “We’ve limited the use of the data. It’s specifically limited to the purpose of growing the business of our company.” 3PP acted as a liaison between DrugCo and its suppliers, providing value-adding activities by hosting DrugCo’s data on the supplier portal, and BI&A services, administrating the information- sharing contracts, contracting directly with some suppliers (e.g., alcohol suppliers, which legally are not allowed to contract directly with DrugCo to
  • 23. purchase its data) and managing different aspects of the relationship, such as negotiating pricing of DrugCo’s data. During this stage, data was shared for supply- chain optimization. The suppliers accessed part of DrugCo’s data, analyzed it and were able to enhance their marketing campaigns, production planning, pricing and inventory management. The governance of DrugCo’s supplier portal was designed to be collaborative. Major suppliers joined an advisory board that oversaw how the supplier portal was implemented. Voting was used to prioritize enhancements and to determine data presentation mechanisms and standards. The VP of Retail Solution s at 3PP explained the structure and function of the advisory board: “[At any time] there’s around 18 to 20 suppliers on [DrugCo’s] advisory board and there are eight that are on their senior council … the larger group meets twice a year and the senior group meets four
  • 24. times a year ... they prioritize the changes or enhancements they want to see in the program and pass them to DrugCo ... DrugCo is only a member … It’s a user- driven advisory board.” DrugCo’s costs during Stage 2 were the technical cost of building the supplier portal, the analytical cost for the additional inter- organization analyses, and the contracting cost for preparing contracts and NDAs with suppliers and third parties. 3PP incurred the cost of hosting the portal and providing additional analytical services. Suppliers connected to the portal also incurred contracting costs for the NDAs and analytical costs for analyzing the data they accessed. With direct access to the portal, suppliers could dynamically manipulate vast amounts of DrugCo data to answer questions on the fly. Stage 2 laid the technical foundation (i.e., in the supplier portal) for data monetization and showed that DrugCo’s data was valuable to its suppliers.
  • 25. Stage 3: Monetizing Data by Charging for it In Stage 3, with the supplier portal running successfully and suppliers having a good feel for DrugCo’s data and its value, DrugCo began to extract more value from its data by monetizing it: “They [retailers in general] accumulate billions of records every year of point-of- sales transaction data and they are taking that huge amount of data and creating their own commercial data clouds for their suppliers to analyze … A consumer- packaged-goods brand can just log in and see not only how their own products are doing in those stores but also how a competitor’s products are doing in those stores.” VP of Marketing, 3PP The supplier portal was enhanced by adding additional data sets (particularly loyalty data)
  • 26. 220 MIS Quarterly Executive | December 2013 (12:4) misqe.org | © 2013 University of Minnesota Data Monetization and customized reporting capabilities to provide a wider range of reports to the data- buying suppliers. DrugCo’s internal and inter- organizational analytical capabilities matured, and it started to identify what data was saleable. Data was offered in different packages, each of which had a different level of data granularity, reporting capability and price tag. By now, DrugCo had a dedicated executive on its merchandising team for selling its data, and this executive worked with 3PP to market these data packages directly to DrugCo’s suppliers. Prices were often negotiated. If a supplier chose a higher level of information access and granularity, the price increased. There were four levels of data packaging—Basic, Bronze, Silver and Gold—for point-of-sale data (see Table 2). Only a limited number of DrugCo’s major
  • 27. suppliers were allowed to purchase the highest Gold level package. As discussed later, a supplier had to invest resources in its relationship with DrugCo to become a candidate for the Gold level. A data-purchase agreement and NDA were prepared for DrugCo and any supplier who wanted to buy data. Trust in Stage 3 included goodwill trust (based on beliefs) in addition to contractual trust (based on written agreements). When goodwill trust exists, partners are willing to go beyond stipulated contractual agreements. Thus, DrugCo trusted that the supplier would not only adhere to the data-purchase agreement, but would also use the data for the benefit of both parties. In essence, DrugCo’s major suppliers learned to tell DrugCo when they saw a problem that needed to be addressed, regardless of whether doing so was of immediate benefit to the supplier. Big suppliers (such Johnson & Johnson, Procter & Gamble, Coca Cola, PepsiCo, 3M, Novartis and Unilever) have been applying
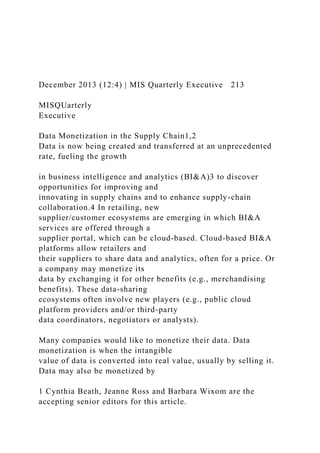
  • 28. analytical tools for a long time to better predict demand and develop successful marketing campaigns; they are equipped with significant know-how in terms of BI&A: “There are hundreds of CPG [consumer packaged goods] companies … analyzing detailed data from retailers … mixing it together with econometric and demographic data, weather data, various kinds of geographic data, and trying to better understand the markets and figure out how to better sell the products.” Cofounder and CEO, 3PP Table 2: Four Levels of Data Packaging Level Data Access and Analytics Provided Current No. of Suppliers Percentage of Suppliers Basic • Supplier items only at POS transaction level detail filtered by SKU
  • 29. • Information provided shows supplier inventory level status • Access provided only through prebuilt reports 358 55.3% Bronze Basic Package plus: • Summaries for all approved classes/categories provided by a few prebuilt reports 128 19.8% Silver Bronze Package plus: • All items at POS transaction level detail for approved classes filtered by class • Ability to upload up to 10 GB of DrugCo’s data for enhanced analysis by supplier • Third-party analysis tool provided for ad-hoc analysis by supplier • (Limited) basket view of categories a supplier operates in
  • 30. 82 12.7% Gold Silver Package plus: • (Full) … Running Head: Organizational Goal Setting and SMART Analysis1 Organizational Goal Setting and SMART Analysis2 Organizational Goal Setting and SMART Analysis Michell Muldrow Unit III Columbia Southern University
  • 31. Organizational goal setting of Wall-mart There are different evaluations in the assessment of the various distinctions carried in the course of evaluating the different dimensions of historical data collection and evaluation of research and development. There are numerous distinctions in the management of the various implications which are carried out in the dynamics of change and the implementation of the market drive (Kumar & Kumar, 2019). Specific consequences are to be undertaken in the dynamics of change and the implications of the difference in the system of operations of wall art. Specific The goal, which is implied in the distinctions of the measure of the change which is assessed in the system of operations, is evaluated to be a necessary implication in the dynamics of change factor. The specific goal of being the retail giant of the world is the target that has been attained through and through by the organization. Particular considerations are to be adequately evaluated regarding the course of implied change of actions and the measure of the goals which have been carried
  • 32. out by the specific impact of distinctions. There is a measure of the implications which are assessed to have been executed in the different consequences of attaining the goal of becoming a giant (Vivien, 2018). Measurable The assessment of the performance has caused the impact of the organization in being measurable and carrying out the different dynamics of change in the implications of the various operations. The factor of the association is assessed to be carried out in the dynamics of processes (Ferdous, Biswas, Chowdhury, Chowdhury, & Muthukkumarasamy, 2019). This measurability is the factor that has been evaluated in the measure of the different distinctions of change. The management and the constant evaluation of the market is the factor which has been thoroughly analyzed in the system of operations. Attainable The assessment of the goal is to communicate the factor that specific implications are attainable in the dimensions of an organization. There are certain factors of understanding which are assessed to be carried out in the course of actions which are containing the reality factor of being attainable. These are the integrated propensities of goals which are carried out in the different distinctions of operations of the organization (Haroun, 2016). The established goals are attainable when they are
  • 33. different dynamics of change that are carried out in the depictions of change in the operations of the world. Relevant The relevance of the industry with the distinction of the operations is carried out in the differences of the activities. The course of significance in the manner of the different factors is to be carried out in the course of actions which are carried out in the domains of the operations of corporate set up. There are different evaluations which are carried out in the various distinctions which are to be established in the different direction of relevancy with the industry of the organization. Time-bound The assessment of time-bound management is the factor that is carried out in the dimensions of the course of activities that are prevailing in a time-bound manner. The implications of the approach being carried out in the different distinctions of actions must be portrayed in the appropriate time frame and method of assessment, which are implying the unusual manner of the operations. There are precise evaluations which are taken in the distinction of the efforts which are carried out in the different time frame of services. There are particular distinctions which are carried out in the various domains of operations.
  • 34. References Ferdous, M. S., Biswas, K., Chowdhury, M. J., Chowdhury, N., & Muthukkumarasamy, V. (2019). Integrated platforms for blockchain enablement. Advances in Computers , 41-72. Haroun, I. M. (2016). Exploring Corporate Strategic Management and Global Expansion on the Case study of Samsung Electronics. Archives of Business Research. Kumar, A., & Kumar, S. (2019). Need for Big Data Technologies: A Review. International Conference on Signal Processing and Communication, 343-347. Vivien, S. (2018). Smart Contract Development in Supply Chain
  • 35. Management–Requirements and Potentials for Utilizing Blockchain Technology.