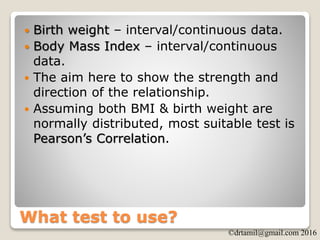
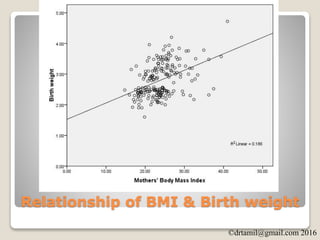
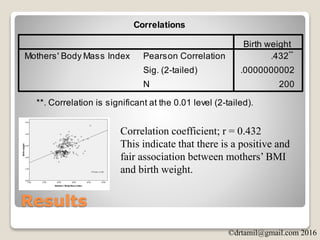
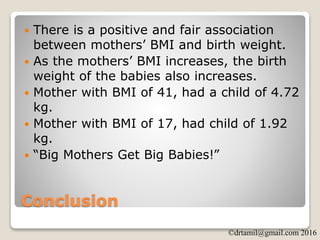
Running Pearson’s
Correlation on SPSS
http://www.palmx.org/drtamil/spss/
sga-ttest-youtube.sav
Šdrtamil@gmail.com 2016
Factors Affecting SGA
SGA
(Y/N)
(Birth
weight)
Mother’s
Nutrition
(BMI/Obesity)
•Weight
•Height
Smoking
Hypertension
Šdrtamil@gmail.com 2016
Dependent Outcome
 Birth weight of the babies
 Small for gestational age i.e. less than
2.7kg for term babies – Y/N
By Yehudamalul - Own work, CC BY-SA 3.0,
Šdrtamil@gmail.com 2016
What test to use?
 Conduct the appropriate statistical test to
test the strength of relationship between
MOTHERS’ BODY MASS INDEX (in kg) and
BIRTH WEIGHT (in kg).
Šdrtamil@gmail.com 2016
Factors Affecting SGA
Birth
weight
(in kg)
Proxy for
Mother’s
Nutrition; Body
Mass Index in
kg/m2
Smoking
(Y/N)
Hypertension
(Y/N)
Šdrtamil@gmail.com 2016
What test to use?
 Birth weight – interval/continuous data.
 Body Mass Index – interval/continuous
data.
 The aim here to show the strength and
direction of the relationship.
 Assuming both BMI & birth weight are
normally distributed, most suitable test is
Pearson’s Correlation.
Šdrtamil@gmail.com 2016
Relationship of BMI & Birth weight
Running Pearson’s
Correlation on SPSS
http://www.palmx.org/drtamil/spss/
sga-ttest-youtube.sav
Šdrtamil@gmail.com 2016
Results
Correlation coefficient; r = 0.432
This indicate that there is a positive and
fair association between mothers’ BMI
and birth weight.
Šdrtamil@gmail.com 2016
Conclusion
 There is a positive and fair association
between mothers’ BMI and birth weight.
 As the mothers’ BMI increases, the birth
weight of the babies also increases.
 Mother with BMI of 41, had a child of 4.72
kg.
 Mother with BMI of 17, had child of 1.92
kg.
 “Big Mothers Get Big Babies!”
Šdrtamil@gmail.com 2016
Exercise
 Repeat the same statistical test between;
◦ Mothers’ Age and Birth Weight
◦ Mothers’ Weight and Birth Weight
◦ Mothers’ Height and Birth Weight

Running Pearson's Correlation on SPSS