
Recommended
Recommended
More Related Content
Similar to ARTICLEAnalysing the power of deep learning techniques ove
Similar to ARTICLEAnalysing the power of deep learning techniques ove (20)
More from dessiechisomjj4
More from dessiechisomjj4 (20)
Recently uploaded
Recently uploaded (20)
ARTICLEAnalysing the power of deep learning techniques ove
- 1. ARTICLE Analysing the power of deep learning techniques over the traditional methods using medicare utilisation and provider data Varadraj P. Gurupura, Shrirang A. Kulkarnib, Xinliang Liua, Usha Desai c and Ayan Nasird aDepartment of Health Management and Informatics, University of Central Florida, Orlando, FL, USA; bSchool of Computer Science and Engineering, Vellore Institute of Technology, Vellore, India; cDepartment of Electronics and Communication Engineering, Nitte Mahalinga Adyanthaya Memorial Institute of Technology, Nitte, Udupi, India; dUCF School of Medicine, University of Central Florida, Orlando, FL, USA ABSTRACT Deep Learning Technique (DLT) is the sub-branch of Machine Learning (ML) which assists to learn the data in multiple l evels of representation and abstraction and shows impressive performance on many Artificial Intelligence (AI) tasks. This paper presents a new method to analyse the healthcare data using DLT algorithms and associated mathematical formulations. In this study, we have first developed a DLT to programme two types of deep learning neural networks, namely: (a) a two-hidden layer network, and (b) a three- hidden layer network. The data was analysed for predictability
- 2. in both of these networks. Additionally, a comparison was also made with simple and multiple Linear Regression (LR). The demonstration of successful application of this method is carried out using the dataset that was constructed based on 2014 Medicare Provider Utilization and Payment Data. The results indicate a stronger case to use DLTs compared to traditional techniques like LR. Furthermore, it was identified that adding more hidden layers to neural network constructed for performing deep learning analysis did not have much impact on predictability for the dataset considered in this study. Therefore, the experimentation described in this article sets up a case for using DLTs over the traditional predictive analytics. The investigators assume that the algorithms described for deep learning is repeatable and can be applied for other types of predictive ana- lysis on healthcare data. The observed results indicate, the accuracy obtained by DLT was 40% more accurate than the traditional multi- variate LR analysis. ARTICLE HISTORY Received 16 April 2018 Accepted 30 August 2018 KEYWORDS Deep Learning Technique (DLT); medicare data;
- 3. Machine Learning (ML); Linear Regression (LR); Confusion Matrix (CM) Introduction Methods involving Artificial Intelligence (AI) associated with Deep Learning Technique (DLT) and Machine Learning (ML) are slowly but surely being used in medical and health infor- matics. Traditionally, techniques such as Linear Regression (LR) (Nimon & Oeswald, 2013), Analysis of Variance (ANOVA) (Kim, 2014), and Multivariate Analysis of Variance (MANOVA) (Xu, 2014) (Malehi et al., 2015) have been used for predicting outcomes in healthcare. However, in the recent years the methods of analysis applied are changing towards the aforementioned computationally stronger techniques. The purpose of current research work delineated in this paper, effectively proves the usefulness of DLTs and Confusion Matrix (CM) CONTACT Usha Desai [email protected] Electronics and Communication Engineering, Nitte Mahalinga Adyanthaya Memorial Institute of Technology, Nitte, India JOURNAL OF EXPERIMENTAL & THEORETICAL ARTIFICIAL INTELLIGENCE 2019, VOL. 31, NO. 1, 99–115 https://doi.org/10.1080/0952813X.2018.1518999 © 2018 Informa UK Limited, trading as Taylor & Francis Group http://orcid.org/0000-0002-2267-2567 http://www.tandfonline.com
- 4. http://crossmark.crossref.org/dialog/?doi=10.1080/0952813X.20 18.1518999&domain=pdf analysis to predict the outcome for a healthcare informatics case study. The core objectives of this research are as follows: a) Illustrate the power of DLT (LeCun, et al., 2015) by conducting an analysis comparing it with Linear Regression (LR). b) Introduce advancement in science of DLT by mathematical formulations. c) To analyse that, if changes applied in DLT algorithm can affect the predictability involved. To achieve the aforementioned objectives, investigators conducted experimentation on a dataset that was constructed based on the 2014 Medicare Provider Utilization and Payment Data. This data encompasses information on services provided to Medicare beneficiaries by physical therapists. The 2014 Medicare Provider Utilization and Payment Data provide informa- tion on procedures and services provided to those insured under Medicare by various healthcare professionals. This dataset has information on utilisation, amount differentiated into allowed amount and the Medicare payment (Medicare Provider and Utilization Data, Online 2018), and charges submitted which are organised and identified by a Medicare assigned National Provider Identifier. It is important to mention that this data covers only those claims covered for the Medicare fee-for-service
- 5. population (specifically 100% final- action physician/supplier Part B non-institutional line items). In the past, research experiments on Medicare data have been successfully carried out by using methods such as LR; however, while proposed study applies DLT to satisfy the aforementioned core research objectives. Additionally, we have compared the obtained results of DLT and LR. Thereby, ascertaining the strength and usefulness of this stronger computational technique in analysing the Medicare data. Related work In recent years, Machine Learning (ML)/Artificial Intelligence (AI) approaches are widely adopted by the researchers to solve a variety of complex problems. Traditional ML/AI approaches have been widely adopted in applications like image processing, signal evaluation, pattern recognition, etc. For large datasets, the traditional ML/AI approaches sometimes may provide the erroneous results. Hence, in recent years, the large volumes of data have been efficiently processed and interpreted using a modernised ML using DLT. The DLT can be implemented by means of the Neural Network (NN) approach or Belief Network (BN) approach. In the literature, the NN-based DLT, such as Deep NN (DNN) and Recurrent NN (RNN) are widely implemented to process the medical dataset, in order to get better accuracy. The results of previous study also confirm that, DLT approaches will offer better result in disease recognition, classification and evaluation
- 6. approaches. Due to its superiority, it is widely adopted by the researchers to evaluate the dataset related to patient’s health information. In the proposed work, evaluation of the aforementioned dataset is carried using the DLT to develop a health information system, which is applicable to analyse the public health data. Suinesiaputra (Suinesiaputra, Gracia, Cowan, & Young, 2015) proposed a detailed review regarding the heart disease by using the benchmark cardiovascular image dataset. This work also insists the necessity of sharing the medical data in order to predict the cardiovascular disease (CVD) in its early stages (Zhang et al., 2016). In addition to this, the work of Puppala (Puppala et al., 2015) proposes a novel online evaluation framework for the CVD dataset using an approach termed as Methodist Environment for Translational Enhancement and Outcomes Research (METEOR). This framework is considered to construct a data warehouse (METEOR) to link the patient’s dataset with the end users, such as the doctors and research- ers. In order to test the efficiency of the proposed approach, breast cancer dataset was 100 V. P. GURUPUR ET AL. chosen for evaluation purposes. The result of this approach confirms the efficiency of METEOR in data collection, sharing, disease detection and treatment planning procedures.
- 7. It is important to note that Santana (Santana et al., 2012) proposed an evaluation tool to evaluate the heart risk based on the patient’s health information. The developed tool (Santana et al., 2012) collects invasive/non-invasive health information from the patient, and provides the disease related information to support the treatment planning process. The research contribution by Snee and McCormick (2004) proposes an approach to consider the indispensable elements of the available public health information network to collect and forecast the data for Disease Control and Prevention centres. This work clearly presents the software and hardware requirements, to accomplish the proposed setup to link the patient with the monitoring system. Web based online examination procedure was proposed by (Weitzel, Smith, Deugd, & Yates, 2010). In this framework, the concept of cloud computing is implemented to enhance the communal collaborative pattern to support a physician to employ protocols while accessing, assembling and visualising patient data through embeddable web applications coined as OpenSocial gadgets. This DLT framework supports real time interaction between the patient and the doctor for purposes of diagnosis and treatment. The investigators would like to mention that Zhang (Zhang, Zheng, Lin, Zhang, & Zhou, 2013) proposed a prediction model for the CVD based on various signals collected using the dedicated sensors. This work considers the use of wearable sensors to collect the signals from the chosen parts of the human body and non-invasive imaging techniques to identify the disease initiations required to develop models to support the
- 8. early detection of CVD. The recent research work by Zheng (Zheng et al., 2014) also confirms the need for the use of these wearable sensors to support the premature detection of the disease. This work exem- plifies the use of wireless/wire based biomedical sensors in association with DLT to collect critical data from internal/external organs of the human body in order to make an accurate prediction on the disease. DLT is also applied to support the early detection of life threatening diseases that aids the reduction of mortality rates. The availability of modern clinical equipment and the data sharing network reduced the gap between the patients and the doctor in identifying the disease, getting the opinion from the experts, comparing the existing patient’s critical data pertaining to the disease with the related data existing in the literature, identifying the severity/stage of the disease, and possible treatment procedures. Hence, in recent years, more researchers are working in the field of health informatics using DLT to propose efficient data sharing frameworks, modifying the existing health informatics setups, and synthesising wearable health devices to track the normal/ abnormal body signals to predict the disease. Usually in health informatics, the size of the dataset could be large and the accuracy of disease identification and the evaluation procedure relies mainly on the processing approach considered to evaluate the healthcare data. Here the accuracy of the disease prediction depends only on the processing approach. The recent work of
- 9. (Ravi et al., 2017) summarises the implementation of the applications of various deep learning approaches to evaluate a healthcare database. Methodology Figure 1 represents the flow diagram of Medicare dataset pre- processing system using Python simulation tool. Further, pre-processed data is subjected for classification using DLT and LR algorithms. Our research method relies on the use of LR to test two particular outcome variables. We then proceed with the application of DLT and perform a required comparison to satisfy the aforementioned research objectives. This encourages us to test a simple prediction model using linear regression to indicate towards the property of homoscedasticity. Further in the required analysis the investigators consider a simple l inear regression model as given in Equation (1). JOURNAL OF EXPERIMENTAL & THEORETICAL ARTIFICIAL INTELLIGENCE 101 Y ¼ pþ q Z (1) where Y is the outcome, and variable Z is the predictor variable,q identifies the slope and p is the intercept. The simulation of the proposed block diagram (Figure 2) was implemented in Python 3.6 using packages such as pandas, scipy and sklearn modules. The metric considered
- 10. was R2 . R2 ¼ 1� SSre SSto (2) R2 indicates the correlation coefficient squared where SSre known as error sum of squares and SSto known as total corrected sum of squares as given using Equations (3) and (4), respectively. SSre ¼ Xn i¼1 yi � ŷið Þ2 (3) SSto ¼ Xn i¼1 yi � �yið Þ2 (4) In the Equations (3) and (4) �yi estimates the mean value, whereas ŷi gives the mean value of yi in the regression structure, respectively. Whereas, the multiple LR was modelled using Equation (5), y ¼ X1n1 þ X2n2 þ X3n3 þ����þ Xpnpyþ 2 (5) where y is the dependent variable and X1; 2; X3 and so on, are the p independent variables with parameters n1; n2 ,n3 and so on. In applying DLT, we first base our premise on mathematical formulation, formulated by implementation and discussion of
- 11. results. Figure 2 represents stages involved in development of proposed DLT Medicare utilisation informatics system. Mathematical formulation for DLT algorithm In this study, the investigators would first like to illustrate the DLT algorithms used for the proposed Medicare health data informatics system. To specify this in algorithmic form, the Stochastic Gradient Descent (SGD) algorithm is considered as described in Figure 3. The key part Importing Libraries Importing the Dataset Categorical Data is Encoded Splitting the Dataset into Train and Test Set Perform Feature Scaling on Train and Test Set PRE-PROCESSING DATA
- 12. Figure 1. Flow diagram for pre-processing of the medicare utilisation dataset. 102 V. P. GURUPUR ET AL. in this algorithm is the calculation of the partial derivatives @[email protected] . If ∂Lk= @wið Þ is positive, further increasing wi by some small amount will increase the loss Lk for the current example; decreasing wi will decrease the loss function (Taylor, 1993), (Fernandes, Gurupur, et al., 2017). In this study, a small step is considered in the direction to minimise the loss function, as an efficient deep learning function. Input: Network parameters , loss function , training data , learning rate > while termination conditions are not met, perform as follow: ( , ) ← . ( ) ← ( , ) ← ( , , , ) end Figure 3. Implementation flow for the Stochastic Gradient Descent (SGD) algorithm. Randomly initialize the weights to
- 13. numbers Input the first patient record details from the database to the input layer Each feature of the database is associated to one input node Forward propagation is performed from left to right Error obtained is calculated Predicted result is compared with
- 14. actual result Activation is propagated until the predicted result ‘y’ is obtained Neurons are activated such that the impact of each neuron’s activation is limited by weights The previous steps updated the weight for each observation in the dataset Weights are updated according to the calculated weight Error id back
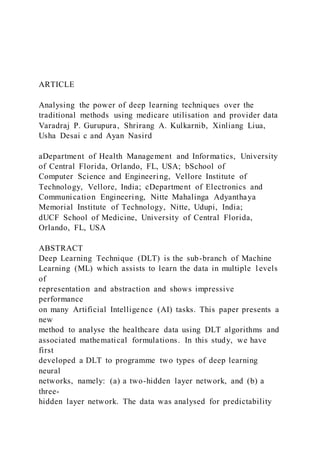
- 15. propagated Perform back propagation from right to left The entire process is repeated for the entire training (epoch). Redo the process for more epochs Figure 2. Methodology in implementation of proposed medicare data analyser system. JOURNAL OF EXPERIMENTAL & THEORETICAL ARTIFICIAL INTELLIGENCE 103 Backpropagation in a multilayer perceptron In this work, a simple multilayer perceptron with a standard fully connected feed-forward neural network layer along with the sum of squared error loss function (Zheng et al., 2014) (Figure 4) is considered as follows (Zhang et al., 2016):
- 16. L y; ŷð Þ ¼ XN i¼1 ðyi � ŷiÞ2 (6) where N is the number of outputs, yi is the ith label, and ŷi = output (w, f) is the network’s prediction of yi , given the feature vector f and current parameter w. Here the input vector to the current layer is the vector zi (of length 4), the element-wise nonlinearity (activation function, such as tanh and sigmoid), then the forward-pass equations for this network are (Zhang et al., 2016) expressed as follows: zi¼bi þ X4 j¼1 wi;jai (7) ŷi ¼ σ zið Þ (8) where bi is the bias and wi;j is the weight connecting input i to neuron j as shown in Figure 5. Given the loss function, the first partial derivative is calculated with respect to the network output,byi (Taylor, 1993): ð@LkÞ=ð@ŷjÞ ¼ @=ð@ŷjÞð XN ði¼1Þ ðyi � ŷiÞ2Þ (9)
- 17. a1 a2 a13 b1 b2 b13 y INPUT LAYER HIDDEN LAYER 1 HIDDEN LAYER 2 OUTPUT LAYER X1 X2 X3 X30 Figure 4. Application of Stochastic Gradient Descent deep learning computation. 104 V. P. GURUPUR ET AL. ¼ @
- 18. @ŷj ðyj � ŷjÞ2 (10) ¼ �2ðyj � ŷjÞ (11) Following the network structure backward, the @Lk @zi is a function of @Lk @ŷi is computed (Ravi et al., 2017). This will depend on the mathematical form of the activation function σk zð Þ (Taylor, 1993) in which sigmoid activation function is considered. @Lk @zi ¼ @Lk @ŷi @ŷi @zi (12) ¼ σ0k zið Þ @Lk @ŷi (13) where σk zð Þ ¼ 1 1þe�z and the function σ
- 19. 0 k zð Þ ¼ σk zð Þ 1� σk zð Þð Þ. Next, applying the chain rule to calculate the partial derivatives of the weights wj;i given the previously calculated derivatives, @Lk @zi (Fernandes, Gurupur, et al., 2017), @Lk @wj;i ¼ X3 k¼1 @Lk @zi @zi @wj;i (14) ¼ @Lk @zi @zi @wj;i (15) X1
- 20. X2 X3 X30 Z Y W3 Actual Value Output Value ½ (z-y) 2 Figure 5. Assigning the weights to the artificial neural network. JOURNAL OF EXPERIMENTAL & THEORETICAL ARTIFICIAL INTELLIGENCE 105 ¼ @Lk @zi @zi @wj;i bi þ X4 k¼1
- 21. wk;iai ! (16) ¼ ai @Lk @zi (17) Finally, derivatives of the loss function is computed with respect to the input activation ai , where @Lk @zi given as, @Lk @ai ¼ X3 j¼1 @Lk @zj @zj @ai (18) ¼ X3 j¼1
- 22. @Lk @zj @ @ai ðbj þ X4 k¼1 wk;jajÞ (19) ¼ X3 j¼1 @Lk @zj wi;j (20) Outcome variables To apply Machine Learning (Martis, Lin, Gurupur, & Fernandes, 2017) (Fernandes, Chakraborty, Gurupur, & Prabhu, 2016) (Fernandes, Gurupur, Sunder, & Kadry, 2017) (Rajnikanth, Satapathy, et al, 2017) and Deep Learning (Shabbira, Sharifa, Nisara, Yasmina, & Fernandes, 2017) (Khan, Sharif, Yasmin, & Fernandes, 2016) (Hempelmann, Sakoglu, Gurupur, & Jampana, 2015) (Walpole, Myers, Myers, & Ye, 2012) (Kulkarni & Rao, 2009), we obtained the aforementioned dataset with information on 40,000 physical therapists from the
- 23. aforementioned 2014 Medicare Provider Utilization and Payment Data. In the dataset we added a new column termed as Result which contains the value resulted by comparison of the Total Medicare standardized Payment Value with its median value. Result column consists of two values (0, 1) for the following outcome variables: Outcome-1 (O1): Result = 1 {when Medicare Standardized Payment Received by a Physical Therapist is greater than the median} Result = 0 {when Medicare Standardized Payment Received by a Physical Therapist is equal to or less than the median} Outcome-2 (O2): Result = 1 {when Total Medicare Standardized Payment Value is greater than Median Household Value} Result = 0 {when Total Medicare Standardized Payment Value is lesser than Median Household Value} Here we would like to note that for Outcome-2 the investigators have used multiple dependent variables and a single independent variable. For the purposes of experimentation with DLT we have applied Spyder V3 on Ubuntu operating system. The respective algorithm implemented in the proposed experimentation is illustrated in Figure 6. 106 V. P. GURUPUR ET AL.
- 24. Results and discussion Results The investigators first analysed both the aforementioned outcome variables using linear regression. Thus to visualise the data we further plotted a scatter plot of resulting data values. In this study, the simulation plot of distribution of results is depicted in Figure 7. In which, the scatter plot distribution Figure 7(a) shows signs of non-linearity and thus the principle of homoscedasticity was disapproved. This is because homoscedasticity would have required evenly distributed values; thereby leading the investigators to further this investiga- tion using a range of independent variables to predict the Total Medicare Standardized Payment Value (dependent variable) (Diehr et al., 1999). For this purpose the investigators applied multiple LR model with the dependent variable as Total Medicare Standardized Payment Value. The range of independent variables was derived by stepwise regression. The default p value considered for eliminating independent variables entering the set was 15% (0.15). The comparative plot of predicted values and the actual values is illustrated in Figure 7 (b). Our results achieved R2 as 0.9451 which in a way indicated that the explained variance was around 94%. To further visualise it, we plotted a scatterplot as illustrated in Figure 7(b) for multiple LR analysis. The scatter plot depicted in Figure 7(b) using multiple LR indicates heteroscedasticity of data
- 25. values. Heteroscedasticity has a major impact on regression analysis. The presence of heterosce- dasticity can invalidate the significance of the results. Thus we further plan to investigate the more accurate modelling of our independent variable Total Medicare Standardized Payment Value using dataset = pd.read_csv (‘dataset.csv’) // import dataset // Independent values and dependent values are separated, //x denotes independent variable and y will be the dependent variable x=dataset.iloc[:,0:27].values y=dataset.iloc[:,27].values // Convert all dependent data into integer values ConvertInteger(Dependent Data) TestSet [] = dataset (20% randomly selected) TrainingSet [] = dataset (80% randomly selected) Standardize (dataset) CreateHiddenLayers() // 2-3 hidden layers are created with an output dimension of 13 //and input dimension of 30 set(X_train,Y_train, Batch and Epoch values),
- 26. // X-train is the training set of the independent variable (x) and //Y_train is training set corresponding to dependent variable y //The values used are Batch= 32 and Epoch = 100 do { Y_predict = classifier.predict (X_Test) // The unlabeled observations (X_Test) used are 20% of the entire dataset // the threshold value of 50% is set for predicted labels (y_predict). } while (Epoch <=100); GenerateConfusionMatrix () Figure 6. Algorithm for implementing the healthcare system using DLT. JOURNAL OF EXPERIMENTAL & THEORETICAL ARTIFICIAL INTELLIGENCE 107 DLT algorithm. The simulation value gave a result of R2 as 0.5159, which in a way indicates the variance was reduced by 51%. For the purpose of applying DLT the system is trained by randomly selecting 32,530 records
- 27. (80%) and tested using 8133 records (20%). The above mentioned analysis methodology was out to test on the dataset mentioned in the introduction section. In addition, the LR model depicted in Figure 7 had a much lesser level of accuracy. The conceptual meaning of the Confusion Matrix (CM) for two-hidden layers, considering Outcome-1 (O1) is tabulated in Table 1. The details of the CM illustrated in Table 1 are as follows: ● True Negative (TN) value = 4013 which indicates the values of the predicted output that is correctly considered as 0 as per the O1 (Result = 0 when Medicare Standardized Payment Received by a Physical Therapist is less than its median). ● True Positive (TP) value = 4066 which indicates the values of the predicted output that is correctly considered as 1 as per the O1 (Result = 1 when Medicare Standardized Payment Received by a Physical Therapist is greater than its median). ● False Negative (FN) value = 28 which indicates the values of the predicted output that is wrongly considered as 0 as per the O1 (Result = 0 when Medicare Standardized Payment Received by a Physical Therapist is less than its median). ● False Positive (FP) value = 26 which indicates the values of the predicted output that is wrongly considered as 0 as per the O1 (Result = 1 when Medicare Standardized Payment Received by a Physical Therapist is greater than its median). Accordingly, (TN) 4013 + (TF) 4066 = 8079 matched correctly;
- 28. (FN) 28 + (FP) 26 = 54 not matched (Table 1). Accuracy can be calculated as ¼ Data matched correctly Total data = 8079/8133 = 99.33%. The concep- tual meaning of CM for three-hidden layers, considering O1 is tabulated in Table 2. However, (TN) 4015 + (TP) 4080 = 8095 matched correctly; (FN) 14 + (FP) 24 = 38 not matched (Table 2). Accuracy can be calculated as ¼ Data matched correctly Total data = 8095/8133 = 99.53%. The system is trained by randomly selecting 32,530 records (80%) and tested using 8,133 records (20%). The conceptual meaning of the CM for two- hidden layers, considering Outcome-2 (O2) is tabulated in Table 3. Additionally, the data generated for three-hidden layers considering O2 is presented in Table 4. Figure 7. (a) Simple Linear Regression (LR) analysis, (b) Multiple LR analysis. 108 V. P. GURUPUR ET AL. The CM given in Table 3 represents (TN) 6760 + (TF) 1339 = 8099 matched correctly; (FN) 9 + (FP) 27 = 36 not matched. Hence, the accuracy can be calculated as ¼ Data matched correctly Total data = 8099/
- 29. 8133 = 99.58%. Further, the conceptual meaning of the CM for three-hidden layers, considering O2 is tabulated using Table 4. In which, (TN) 6741 + (TP) 1341 = 8082 matched correctly; whereas (FN) 5 + (FP) 27 = 32 not matched. In this case, accuracy can be calculated as ¼ Data matched correctly Total data = 8082/8133 = 99.37%. Table 5 presents comprehensive summary of performance achieved for the set O1 and O2 for the proposed Medicare analysis system. Therefore, it can be clearly identify that Deep Learning Technique (DLT) can perform automatic feature extraction which is not possible in Linear Regression (LR). The DLT network can automatically decide which characteristics of data can be used as indicators to label that data reliably. DLT has recently surpassed all the conventional Machine Learning (ML) techniques with minimal tuning and human effort. This effectively repre- sents the DLT network can automatically decide which characteristics of data can be used as indicators to label that data reliably. The key observations of this experiment are as follows: (i) DLT has a better accuracy when compared to LR method for a single set of the variables, (ii) the accuracy of DLT increases exponentially (99.58%) when multiple dependent variables are considered, (iii) adding additional Table 1. Confusion Matrix (CM) for two-hidden layers considering Outcome-1 (O1) .
- 30. O1 CM Two-hidden layers PREDICTED NO YES ACTUAL NO TN = 4013 FP = 26 YES FN = 28 TP = 4066 Table 2. CM for three-hidden layers considering O1. O1 CM Three-hidden layers PREDICTED NO YES ACTUAL NO TN = 4015 FP = 24 YES FN = 14 TP = 4080 Table 3. CM for two-hidden layers considering O2. O2 CM Two-hidden layers PREDICTED NO YES ACTUAL NO TN = 6760 FP = 27 YES FN = 7 TP = 1339 Table 4. CM for three-hidden layers considering O2.
- 31. O2 CM Three-hidden layers PREDICTED NO YES ACTUAL NO TN = 6741 FP = 46 YES FN = 5 TP = 1341 Table 5. Summary of accuracy obtained for O1 and O2 using two-layer and three-layer models. Outcome Accuracy TPþTN TPþTNþFPþFN O1 Two-hidden layers 99.34% Three-hidden layers 99.53% O2 Two-hidden layers 99.58% Three-hidden layers 99.37% JOURNAL OF EXPERIMENTAL & THEORETICAL ARTIFICIAL INTELLIGENCE 109 hidden neural network layer for Outcome-2 (O2) did not increase the accuracy (99.37%) of prediction. Comparison with techniques used in medical imaging Zhang (Zhang et al., 2016) applied five-layer Deep DNN Support Vector Machine (SVM) to
- 32. detect colorectal cancer and achieved with precision 87.3%, recall rate 85.9% and accuracy 85.9%. However, the method lacks in simultaneous detection as well as the classification of polyps. Furthermore, random background considered which may lead to increase in the False Positive (FP) rate (Zhang et al., 2016) (Yu, Chen, Dou, Qin, & Heng, 2017) for offline and online colorectal cancer prevention and diagnosis subjected the three- dimensional fully connected Convolutional Neural Network (CNN) and obtained precision of 88%, recall rate of 71%, F1 79% and F2 of 74%. In (Yu et al., 2017) study, it was observed that there is a high interclass relationship and intra class distinction regarding colon polyps. Here translation is difficult for machine learning algorithms to correctly classify the polyps. Christodoulidis (Christodoulidis, Anthimopoulos, Ebner, Christe, & Mougiakakou, 2017) conducted study to classify the inter- stitial lung disease using ensemble of multi-source transfer learning method. Here the investigators attained F-score of 88.17%. However in the developed technique the computa- tional complexity is more due to multilevel feature extraction measures. (Tan, Fujita, et al., 2017b) (Tan, Acharya, Bhandary, Chua, & Sivaprasad, 2017) identified diabetic retinopathy by constructing ten-layer CNN. Here the investigators observed a sensitivity of 87.58% for detection of exudates and sensitivity of 71.58% for dark lesions identification. Akkus (Akkus, Galimzianova, Hoogi, Rubin, & Erickson, 2017) investigated tumour genomic prediction using two-dimensional CNN and observed 93% of sensitivity, 82% of specificity, and 88% of
- 33. accuracy. Furthermore, Kumar (Kumar, Kim, Lyndon, Fulham, & Feng, 2017) developed system for classification of modality of medical images and achieved accuracy of 96.59% using ensemble of fine-tuned CNN. It was observed that ensemble of CNNs will enable higher quality features to be extracted. Later, Lekadir (Lekadir et al., 2017) conducted study to characterise the plaque composition by applying nine-layers of CNN. In this technique 78.5% accuracy was evaluated, where the ground truth is verified by a single physician. Therefore, we can conclude that DLT used by the investigators in the study delineated in this article had a much higher degree of accuracy when it came to predictability. Comparison with techniques used in pervasive sensing Hannink (Hannink et al., 2017) developed system for mobile gait analysis considering DCNN. Here the authors reported precision of 0.13 ± 3.78°. However in (Hannink et al., 2017) parameter space such as number and dimensionality of kernels are not considered. Ravi (Ravi et al., 2017) designed methodology to recognise human activity applying DNN and achieved 95.8% of accuracy. This method demonstrates the feasibility of real-time investigation, however the computation cost obtained is significantly less. The results obtained in the technique employed by the investigators far exceeds this value as well. Comparison with techniques used to analyse biomedical signals The investigators have achieved a higher level of accuracy with
- 34. respect to perceived analysis of biomedical signals. Acharya, Oh, et al., 2017 classified arrhythmic heartbeats subjecting nine- layer augmented data DCNN. Using this technique authors achieved augmented data accuracy of 94.03% and imbalanced data accuracy of 89.3%. In fact this method requires long training hours and the specialised hardware to train. Further, normal and Myocardial Infarction (MI) ECG beats were detected using CNN and the investigators for this study reported an accuracy of 110 V. P. GURUPUR ET AL. 93.53% with noise and 95.22% without noise (Acharya, Fujita, et al., 2017b). Later using same CNN architecture CAD beats were classified with accuracy of 95.11%, sensitivity of 91.13% and specificity of 95.88% (Acharya, Fujita, Lih, et al., 2017). Also studies were conducted using CNN model to detect tachycardia beats of five seconds duration and reported accuracy, sensitivity and specificity of 94.90%, 99.13% and 81.44%, respectively. However, in their technique few of the remarks were observed. Such as computationally difficult in learning the features, limited database is applied, training process requires huge database and tested using restricted dataset. Comparison with techniques used in personalised healthcare Pham (Pham, Tran, Phung, & Venkatesh, 2017) developed algorithm for Electronic Medical Records (EMRs) using deep dynamic memory NN. In this study
- 35. the investigators achieved F-score of 79.0% and confidence interval of (77.2–80.9) %. This system is more suitable for long progresses of many incidences. However, the young patients normally have only one or two admissions. Also, Nguyen (Nguyen, Tran, Wickramasinghe, & Venkatesh, 2017) designed automated tool to predict the future risk constructing the CNN model. In which the AUC measured for 3 months was 0.8 and for 6 months it was 81.9%. It was noticed that accurate and exact risk estimation is an important step towards the personalised care. However, in the analysis illustrated in this article, we have used the secondary dataset to evaluate the effective- ness of DLT methods (Desai, Martis, Nayak, Sarika, & Seshikala, 2015). As mentioned before, this dataset was constructed based on the 2014 Medicare Provider Utilization and Payment Data: Physician and Other Supplier Public Use File (Medicare Provider and Utilization Data, Online 2018), which contains information on services provided to beneficiaries by 40,662 physical therapists (Liu, et al, 2018). Limitations The research delineated in this article suffers from the following limitations: (a) the computational techniques used requires a high performance for this purpose a sample derived using a rando- mised approach was used, and (b) the Deep Learning Technique has only been tested on the aforementioned 2014 Medicare Provider and Utilization Data, it has not yet been experimented on other data samples.
- 36. Conclusion In this article we have successfully proved the power and accuracy of using DLT over traditional methods (Desai et al., 2016) (Liu, Oetjen, et al, unpublished) (Jain, Kumar, & Fernandes, 2017) (Desai et al., 2016) (Bokhari, Sharif, Yasmin, & Fernandes, 2018) (Desai et al., 2015) (Desai, et al., 2016) on analysing the healthcare data. Table 6 provides the detailed comparison on this statement. The core contribution of the research delineated in this article is the introduction of new mathematical techniques harnessing DLT. While dis- cussing the results we also proved that our technique had a much higher accuracy level than the techniques used in available literature in medical imaging, pervasive sensing, analysing biomedical signals, and personalised healthcare. Addi tionally, here we have fully illustrated the power of higher computational techniques over traditional methods. The future direction of research on this particular topic would be: (a) application of the deep learning methods addressed in this study, on other types of healthcare data (Desai et al., 2015) (Naqi, Sharif, Yasmin, & Fernandes, 2018) (Desai, Nayak, et al., 2017b) (Desai, Nayak, Seshikala, & Martis, 2017) (Shah, Chen, Sharif, Yasmin, & Fernandes, 2017) (LeCun, et al, 2015) (Swasthik & Desai, 2017), (b) further modification of the DLTs (Mehrtash et al., 2017) considered with the purpose of improvising it from a computational perspective (Gurupur & Gutierrez, 2016)
- 37. JOURNAL OF EXPERIMENTAL & THEORETICAL ARTIFICIAL INTELLIGENCE 111 Ta bl e 6. O ut lin e of pr op os ed ap pr oa ch an d ot he r m et ho
- 71. 2) 112 V. P. GURUPUR ET AL. (Nasir, Liu, Gurupur, & Qureshi, 2017) (Gurupur & Tanik, 2012) (Gurupur, Sakoglu, Jain, & Tanik, 2014) (Desai, et al., 2018). This improvisation is because of the fact that a high performance computational facility is required to carry out the computer programme in the implementa- tion system. Disclosure statement No potential conflict of interest was reported by the authors. ORCID Usha Desai http://orcid.org/0000-0002-2267-2567 References Acharya, U. R., Fujita, H., Lih, O. S., Adam, M., Tan, J. H., & Chua, C. K. (2017). Automated detection of coronary artery disease using different durations of ECG segments with convolutional neural network. Knowledge-Based Systems. doi:10.1016/j.knosys.2017.06.003 Acharya, U. R., Fujita, H., Lih, O. S., Hagiwara, Y., Tan, J. H., & Adam, M. (2017). Automated detection of arrhythmias using different intervals of tachycardia ECG segments with convolutional neural network. Information Sciences. doi:10.1016/j.ins.2017.04.012
- 72. Acharya, U. R., Fujita, H., Oh, S. L., Hagiwara, Y., Tan, J. H., & Adam, M. (2017). Application of deep convolutional neural network for automated detection of myocardial infarction using ECG signals. Information Sciences. doi:10.1016/j. ins.2017.06.027 Acharya, U. R., Oh, S. L., Hagiwara, Y., Tan, J. H., Adam, M., Gertych, A., & San, T. R. (2017). A deep convolutional neural network model to classify heartbeats. Computers in Biology and Medicine. doi:10.1016/j.compbiomed.2017.08.022 Akkus, Z, Galimzianova, A, Hoogi, A, Rubin, D. L, & Erickson, B. J. (2017). Deep learning for brain mri segmentation: state of the art and future directions. Journal Of Digital Imaging, 30(4), 449-459. doi:10.1007/s10278-017-9983-4 Akkus, Z., Galimzianova, A., Hoogi, A., Rubin, D. L., & Erickson, B. J. (2017). Deep learning for brain MRI segmentation: State of the art and future directions. Journal of Digital Imaging. doi:10.1007/s10278-017-9983-4 Bokhari, S. T. F., Sharif, M., Yasmin, M., & Fernandes, S. L. (2018). Fundus image segmentation and feature extraction for the detection of glaucoma: A new approach. Current Medical Imaging Reviews. doi:10.2174/ 1573405613666170405145913 Christodoulidis, S., Anthimopoulos, M., Ebner, L., Christe, A., & Mougiakakou, S. (2017). Multisource transfer learning with convolutional neural networks for lung pattern analysis. IEEE Journal of Biomedical and Health Informatics, 21 (1), 76–84. Desai U. et al. (2015) Discrete Cosine Transform Features in Automated Classification of Cardiac Arrhythmia Beats. In:
- 73. Shetty N., Prasad N., Nalini N. (eds) Emerging Research in Computing, Information, Communication and Applications. Springer, New Delhi. Desai, U., Martis, R. J., Acharya, U. R., Nayak, C. G., Seshikala, G., & Shetty, R. K. (2016). Diagnosis of multiclass tachycardia beats using recurrence quantification analysis and ensemble classifiers. Journal of Mechanics in Medicine and Biology, 16, 1640005. Desai, U., Martis, R. J., Nayak, C. G., Sarika, K., & Seshikala, G. (2015). Machine intelligent diagnosis of ECG for arrhythmia classification using DWT, ICA and SVM techniques, India Conference (INDICON), Proceedings of the annual IEEE India conference, doi: 10.1109/INDICON.2015.7443220 Desai, U., Martis, R. J., Nayak, C. G., Sheshikala, G., Sarika, K., & Shetty, R. K. (2016). Decision support system for arrhythmia beats using ECG signals with DCT, DWT and EMD methods: A comparative study. Journal of Mechanics in Medicine and Biology, 16, 1640012. Desai, U., Nayak, C. G., & Seshikala, G. An application of EMD technique in detection of tachycardia beats. In Communication and Signal Processing (ICCSP), 2016 International Conference on 2016 Apr 6 (pp. 1420–1424). IEEE. Desai, U., Nayak, C. G., & Seshikala, G. An efficient technique for automated diagnosis of cardiac rhythms using electrocardiogram. In Recent Trends in Electronics, Information & Communication Technology (RTEICT), IEEE International Conference on 2016 May 20 (pp. 5–8), Bengaluru, India. IEEE. DOI:10.1109/RTEICT.2016.7807770. Desai, U., Nayak, C. G., & Seshikala, G. (2017). Application of ensemble classifiers in accurate diagnosis of myocardial
- 74. ischemia conditions. Progress in Artificial Intelligence, 6(3), 245–253. Desai, U., Nayak, C. G., Seshikala, G., & Martis, R. J. (2017). Automated diagnosis of coronary artery disease using pattern recognition approach. Proceedings of the 39th Annual International Conference of the IEEE Engineering in Medicine and Biology Society (EMBC), pp. 434–437. JOURNAL OF EXPERIMENTAL & THEORETICAL ARTIFICIAL INTELLIGENCE 113 https://doi.org/10.1016/j.knosys.2017.06.003 https://doi.org/10.1016/j.ins.2017.04.012 https://doi.org/10.1016/j.ins.2017.06.027 https://doi.org/10.1016/j.ins.2017.06.027 https://doi.org/10.1016/j.compbiomed.2017.08.022 https://doi.org/10.1007/s10278-017-9983-4 https://doi.org/10.1007/s10278-017-9983-4 https://doi.org/10.2174/1573405613666170405145913 https://doi.org/10.2174/1573405613666170405145913 https://doi.org/10.1109/INDICON.2015.7443220 https://doi.org/10.1109/RTEICT.2016.7807770 Desai, U., Nayak, C.G., Seshikala, G., Martis, R.J., & Fernandes, S.L. (2018). Automated Diagnosis Of Tachycardia Beats. In: Satapathy S., Bhateja V., Das S. (eds) Smart Computing and Informatics. Smart Innovation, Systems and Technologies, vol 77. Springer, Singapore. doi:https://doi.org/10.1007/978-981-10-5544-7_41 Diehr, P., Yanez, D., Ash, A., Hornbrook, M., & Lin, D. Y. (1999). Methods for analyzing healthcare utilization and costs. Annual Review of Public Health, 20, 125–144.
- 75. Fernandes, S. L., Chakraborty, B., Gurupur, V. P., & Prabhu, A. (2016). Early skin cancer detection using computer aided diagnosis techniques. Journal of Integrated Design and Process Science, 20(1), 33–43. Fernandes, S. L., Gurupur, V. P., Lin, H., & Martis, R. J. (2017). A novel fusion approach for early lung cancer detection using computer aided diagnosis techniques. Journal of Medical Imaging and Health Informatics, 7(8), 1841–1850. Fernandes, S. L., Gurupur, V. P., Sunder, N. R., & Kadry, S. (2017). A novel nonintrusive decision support approach for heart rate measurement. Pattern Recognition Letters, 94(15), 87–95. Gurupur, V., & Gutierrez, R. (2016). Designing the right framework for healthcare decision support. Journal of Integrated Design and Process Science, 20, 7–32. Gurupur, V., Sakoglu, U., Jain, G. P., & Tanik, U. J. (2014). Semantic requirements sharing approach to develop software systems using concept maps and information entropy: A personal health information system example. Advances in Engineering Software, 70, 25–35. Gurupur, V., & Tanik, M. M. (2012). A system for building clinical research applications using semantic web-based approach. Journal of Medical Systems, 36(1), 53–59. Hannink, J., Kautz, T., Pasluosta, C. F., Gaßmann, K. G., Klucken, J., & Eskofier, B. M. (2017). Sensor-based gait parameter extraction with deep convolutional neural networks. IEEE Journal of Biomedical and Health Informatics, 21(1), 85–93.
- 76. Hempelmann, C. F., Sakoglu, U., Gurupur, V., & Jampana, S. (2015). An entropy-based evaluation method for knowl- edge bases of medical information systems. Expert Systems with Applications, 46, 262–273. Jain, V. K., Kumar, S., & Fernandes, S. L. (2017). Extraction of emotions from multilingual text using intelligent text processing and computational linguistics. Journal of Computational Science, 21, 316–326. Khan, M. W., Sharif, M., Yasmin, M., & Fernandes, S. L. (2016). A new approach of cup to disk ratio based glaucoma detection using fundus images. Journal of Integrated Design and Process Science, 20(1), 77–94. Kim, H.-Y. (2014). Analysis of Variance (ANOVA) comparing means of more than two groups. Restorative Dentistry and Endodontics, 39(1), 74–77. Kulkarni, S. A., & Rao, G. R. (2009). Modeling reinforcement learning algorithms for performance analysis. In Proceedings of ICAC3ʹ09 of the International Conference on Advances in Computing, Communication and Control (pp. 35–39), Mumbai, India. doi:10.1145/1523103.1523111. Kumar, A., Kim, J., Lyndon, D., Fulham, M., & Feng, D. (2017). An ensemble of fine-tuned convolutional neural networks for medical image classification. IEEE Journal of Biomedical and Health Informatics, 21(1), 31–40. LeCun, Y., Bengio, Y., & Hinton, G. (2015). Deep learning. Nature, 521, 436–444. Lekadir, K., Galimzianova, A., Betriu, À., del Mar Vila, M., Igual, L., Rubin, D. L., . . . Napel, S. (2017). A convolutional neural
- 77. network for automatic characterization of plaque composition in carotid ultrasound. IEEE Journal of Biomedical and Health Informatics, 21(1), 48–55. Liu, X., Oetjen, R. M., Hanney, W. J., Rovito, M., Masaracchio, M., Peterson, R. L., & Dottore, K. (2018). Characteristics of physical therapists serving medicare fee-for-service beneficiaries (Unpublished manuscript). Malehi, A. S., Pourmotahari, F., & Angali, K. A. (2015). Statistical models for the analysis of skewed healthcare cost data: A simulation study. Health Economics Review, 5. doi:10.1186/s13561-015-0045-7 Martis, R. J., Lin, H., Gurupur, V. P., & Fernandes, S. L. (2017). Editorial: Frontiers in development of intell igent applications for medical imaging processing and computer vision. Computers in Biology and Medicine, 89, 549–550. Medicare Provider Utilization and Payment Data: Physician and Other Supplier. (2018, February 26). [Online]. Retrieved from https://www.cms.gov/Research-Statistics-Data-and- Systems/Statistics-Trends-and-Reports/Medicare-Provider- Charge-Data/Physician-and-Other-Supplier.html Mehrtash, A., Sedghi, A., Ghafoorian, M., Taghipour, M., Tempany, C. M., Wells, W. M., . . . Fedorov, A. (2017). Classification of clinical significance of MRI prostate findings using 3D convolutional neural networks. Proceedings of SPIE–the international society for optical engineering, Orlando, Florida, United States. doi: 10.1117/ 12.2277123. Naqi, S. M., Sharif, M., Yasmin, M., & Fernandes, S. L. (2018).
- 78. Lung nodule detection using polygon approximation and hybrid features from lung CT images. Current Medical Imaging Reviews. doi:10.2174/1573405613666170306114320 Nasir, A., Liu, X., Gurupur, V., & Qureshi, Z. (2017). Disparities in patient record completeness with respect to the health care utilization project. Health Informatics Journal. doi:10.1177/1460458217716005 Nguyen, P., Tran, T., Wickramasinghe, N., & Venkatesh, S. (2017). Deepr: A convolutional net for medical records. IEEE Journal of Biomedical and Health Informatics, 21(1), 22–30. Nimon, K. F., & Oswald, F. L. (2013). Understanding the results of multiple linear regression. Organizational Research Methods, 16(4), 650–674. Pham, T., Tran, T., Phung, D., & Venkatesh, S. (2017). Predicting healthcare trajectories from medical records: A deep learning approach. Journal of Biomedical Informatics, 69, 218– 229. 114 V. P. GURUPUR ET AL. https://doi.org/10.1145/1523103.1523111 https://doi.org/10.1186/s13561-015-0045-7 https://www.cms.gov/Research-Statistics-Data-and- Systems/Statistics-Trends-and-Reports/Medicare-Provider- Charge-Data/Physician-and-Other-Supplier.html https://www.cms.gov/Research-Statistics-Data-and- Systems/Statistics-Trends-and-Reports/Medicare-Provider- Charge-Data/Physician-and-Other-Supplier.html https://doi.org/10.1117/12.2277123 https://doi.org/10.1117/12.2277123 https://doi.org/10.2174/1573405613666170306114320
- 79. https://doi.org/10.1177/1460458217716005 Puppala, M., He, T., Chen, S., Ogunti, R., Yu, X., Li, F., . . . Wong, S. T. C. (2015). METEOR: An enterprise health informatics environment to support evidence-based medicine. IEEE Transactions on Biomedical Engineering, 62(12), 2776–2786. Rajinikanth, V., Satapathy, S. C., Fernandes, S. L., & Nachiappan, S. (2017). Entropy based segmentation of tumor from brain MR images - A study with teaching learning based optimization. Pattern Recognition Letters, 94, 87–95. Ravì, D., Wong, C., Lo, B., & Yang, G. Z. (2017). A deep learning approach to on-node sensor data analytics for mobile or wearable devices. IEEE Journal of Biomedical and Health Informatics, 21(1), 56–64. Ravi, D., Wong, C., Deligianni, F., Berthelot, M., Andreu- Perez, J., Lo, B., & Yang, G.-Z. (2017). Deep learning for health informatics. IEEE Journal of Biomedical and Health Informatics, 21(1), 4–21. Santana, D. B., Z´Ocalo, Y. A., Ventura, I. F., Arrosa, J. F. T., Florio, L., Lluberas, R., & Armentano, R. L. (2012). Health informatics design for assisted diagnosis of subclinical atherosclerosis, structural, and functional arterial age calculus and patient-specific cardiovascular risk evaluation. IEEE Transactions on Information Technology in Biomedicine, 16(5), 943–951. Shabbira, B., Sharifa, M., Nisara, W., Yasmina, M., & Fernandes, S. L. (2017). Automatic cotton wool spots extraction
- 80. in retinal images using texture segmentation and Gabor wavelet. Journal of Integrated Design and Process Science, 20 (1), 65–76. Shah, J. H., Chen, Z., Sharif, M., Yasmin, M., & Fernandes, S. L. (2017). A novel biomechanics based approach for person re-identification by generating dense color sift salience features. Journal of Mechanics in Medicine and Biology, 17, 1740011. Snee, N. L., & McCormick, K. A. (2004). The case for integrating public health informatics networks. IEEE Engineering in Medicine and Biology Magazine, 23(1), 81-88. Suinesiaputra, A., Gracia, P. P. M., Cowan, B. R., & Young, A. A. (2015). Big heart data: Advancing health informatics through data sharing in cardiovascular imaging. IEEE Journal of Biomedical and Health Informatics, 19(4), 1283–1290. Swasthi, D. U. (2017). Automated detection of cardiac health condition using linear techniques. In Recent Trends in Electronics, Information & Communication Technology (RTEICT), 2017 2nd IEEE International Conference on 2017 May 19 (pp. 890–894). IEEE. Tan, J. H., Acharya, U. R., Bhandary, S. V., Chua, K. C., & Sivaprasad, S. (2017a). Segmentation of optic disc, fovea and retinal vasculature using a single convolutional neural networ k. Journal of Computational Science. doi:10.1016/j. jocs.2017.02.006 Tan, J. H, Fujita, H, Sivaprasad, S, Bhandary, S. V, Rao, A. K, Chua, K. C, & Acharya, U. R. (2017b). Automated
- 81. segmentation of exudates, hemorrhages, microaneurysms using single convolutional neural network. In Information sciences, 420(c) (pp. 66–76). Taylor, J. G. (Eds). (1993). Mathematical approaches to neural networks (Vol. 51, 1st ed.). North Holland: Elsevier. The Centers for Medicare and Medicaid Services, Office of Enterprise Data and Analytics. (2016). Medicare fee-for- service provider utilization & payment data physician and other supplier public use file: A methodological over- view. Available from: https://www.cms.gov/Research-Statistics- Data-and-Systems/Statistics-Trends-and-Reports/ Medicare-Provider-Charge-Data/Physician-and-Other- Supplier.html Walpole, R. E., Myers, R. H., Myers, S. L., & Ye, K. (2012). Probability and statistics for engineers and scientists (9th ed., pp. 361–363). Boston, USA: Prentice Hall. Weitzel, M., Smith, A., Deugd, S., & Yates, R. (2010). A web 2.0 model for patient-centered health informatics applications. Computer, 43(7), 43–50. Xu, L.-W. (2014). MANOVA for nested designs with unequal cell sizes and unequal cell covariance matrices. Journal of Applied Mathematics. doi:10.1155/201/649202.2014 Yu, L., Chen, H., Dou, Q., Qin, J., & Heng, P. A. (2017). Integrating online and offline three-dimensional deep learning for automated polyp detection in colonoscopy videos. IEEE Journal of Biomedical and Health Informatics, 21(1), 65–75. Zhang, R., Zheng, Y., Mak, T. W., Yu, R., Wong, S. H., Lau, J.
- 82. Y., & Poon, C. C. (2016). Automatic detection and classification of colorectal polyps by transferring low -level CNN features from nonmedical domain. IEEE Journal of Biomedical and Health Informatics, 21(1), 41–47. Zhang, R, Zheng, Y, Mak, Tony Wing Chung, Yu, R, Wong, SH, Lau, James Y. W, & Poon, Carmen C. Y. (2017). Automatic detection and classification of colorectal polyps by transferring low-level cnn features from nonmedical domain. Ieee Journal Of Biomedical and Health Informatics, 21(1), 41- 47. doi:10.1109/JBHI.2016.2635662 Zhang, Y.-T., Zheng, Y.-L., Lin, W.-H., Zhang, H.-Y., & Zhou, X.-L. (2013). Challenges and opportunities in cardiovascular health informatics. IEEE Transactions on Biomedical Engineering, 60(3), 633–642. Zheng, Y.-L., Ding, X.-R., Poon, C. C. Y., Lo, B. P. L. H., Zhang, X.-L., Zhou, G.-Z., . . . Zhang, Y.-T. (2014). Unobtrusive sensing and wearable devices for health informatics. IEEE Transactions on Biomedical Engineering, 61(5), 1538–1554. JOURNAL OF EXPERIMENTAL & THEORETICAL ARTIFICIAL INTELLIGENCE 115 https://doi.org/10.1016/j.jocs.2017.02.006 https://doi.org/10.1016/j.jocs.2017.02.006 https://doi.org/10.1155/201/649202.2014 https://doi.org/10.1109/JBHI.2016.2635662 Copyright of Journal of Experimental & Theoretical Artificial Intelligence is the property of Taylor & Francis Ltd and its content may not be copied or emailed to multiple sites or posted
- 83. to a listserv without the copyright holder's express written permission. However, users may print, download, or email articles for individual use. AbstractIntroductionRelated workMethodologyMathematical formulation for DLT algorithmBackpropagation in a multilayer perceptronOutcome variablesResults and discussionResultsComparison with techniques used in medical imagingComparison with techniques used in pervasive sensingComparison with techniques used to analyse biomedical signalsComparison with techniques used in personalised healthcareLimitationsConclusionDisclosure statementORCIDReferences Criminal Justice Policy Review Journal indexing and metrics Top of Form Bottom of Form Restricted access Research article First published September 2006 Contextualizing the Criminal Justice Policy-Making Process Karim IsmailiView all authors and affiliations Volume 17, Issue 3 https://doi.org/10.1177/0887403405281559 · · · Get access · · Cite article ·
- 84. Share options · Information, rights and permissions · Metrics and citations · Related content Similar articles: · Restricted access Crime, Justice and Systems Analysis: Two Decades Later Book Reviews : Kriminologie by Hans Joachim Schneider. Berlin: Walter de Gruyter, 1986. 1, 117 pages, cloth Criminal Justice System Reform and Wrongful Conviction: A Research Agenda · SAGE recommends: · SAGE Knowledge Book chapter Criminology and Public Policy SAGE Knowledge Book chapter Introduction SAGE Knowledge Book chapter Critical Criminology · Abstract This article is an attempt at improving the knowledge base on the criminal justice policy-making process. As the criminological subfield of crime policy leads more
- 85. criminologists to engage in policy analysis, understanding the policy-making environment in all of its complexity becomes more central to criminology. This becomes an important step toward theorizing the policy process. To advance this enterprise, policy-oriented criminologists might look to theoretical and conceptual frameworks that have established histories in the political and policy sciences. This article presents a contextual approach to examine the criminal j ustice policy-making environment and its accompanying process. The principal benefit of this approach is its emphasis on addressing the complexity inherent to policy contexts. For research on the policy process to advance, contextually sensitive methods of policy inquiry must be formulated and should illuminate the social reality of criminal justice policy making through the accumulation of knowledge both of and in the policy process. Get full access to this article View all access and purchase options for this article. References Atkinson, M., & Coleman, W. D. (1992). Policy networks, policy communities and problems of governance. Governance: An International Journal of Policy and Administration, 5, 155-180. Google Scholar Beckett, K. (1997). Making crime pay: Law and order in contemporary American politics. New York: Oxford University Press. Google Scholar Bobrow, D., & Dryzek, J. (1987). Policy analysis by design. Pittsburgh, PA: University of Pittsburgh Press. Google Scholar Brunner, R. D. (1991). The policy movement as a policy problem.
- 86. Policy Sciences, 24, 65-98. Google Scholar Christie, N. (1993). Crime control as industry: Towards gulags, Western style? London: Rou image1.wmf Policy Analysis in the Criminal Justice Context Welcome to Liberty University to maintain at all times their relationship with the public. That gives reality to the historic tradition that the police are the public and the public, or the police. The police being the only members of the public who are paid to give full time attention to duties which are incumbent on every citizen in the interest of the community, welfare an existence. Sir Robert Peel, I want to talk to you today about policy analysis and the criminal justice context. And it's just such an important field that we need to talk about. But what I want to do is build a model for you, potentially that you may be able to use. And let me just go over a couple of different aspects of it. I'll explain what it is in generic terms. It will boil it down into very specific terms for policy analysis for criminal justice. If I can just give you three words, may, can, and should for development policy analysis, what would you think of that? Let me explain a little bit further. May does the government have the moral, constitutional, ethical obligation to address the problem? And that has to be answered. If not, who should be addressing it? State or local government, if we were talking about federal government to begin with, should have the local communities such as non-profits, churches, businesses, et cetera. Can whichever sphere is responsibility. Obligation falls within federal government, state government, local government ,
- 87. non-profits, churches. How do they tackle that problem? Indeed, they had the resources to actually tackle it. And really this is where the problem-solving model comes into play. And so problem solving model, fairly similar to all types of public policy analysis. With the defined the problem, list, the alternatives. Really establish how we're going to evaluate those alternatives. Assess the alternatives and the criteria that we used for the evaluation, and then implement the chosen alternatives which brings us to should. Should. If an entity has the moral, constitution and constitutional authority to tackle that problem. That's the MAY part. And it also has a resource ID to solve the problem. That's the cam part. What's the best way to do it in terms of political and strategic constraints that that agency may have. How's the agenda best advanced? How does it move forward? How should the message be crafted for that particular policy items? Let's look at it in terms of criminal justice, those are just, that's the general constraints we could use that in any public policy and in any government organization. Let's look at the specific public safety constraints, if you will. We operate in a federal, state, and local level. Typically when we talk about criminal justice, we look at criminal justice also as courts, corrections and law enforcement. But you also have to remember, is it really a systems thinking? We're federal, state, and local governments all on the same sheet of music. Is it even systems thinking dealing with state organizations? Organizations, the organizations? Is IT systems thinking dealing with courts, corrections, and law enforcement always on the same sheet of music with respect to public policy? Or is it some sort of disjointed approach? There may be different agendas and the federal, state, and local level, there may be different agendas, agency to agency, division to division that we have to look at. So that's something in particular with criminal justice. We also have to look at the practitioner versus the academic gap. Lot of times we look at public policy. We see a lot of academic writings on public policy in a lot of thoughts about academic writing on public policy, can the practitioners
- 88. really use that? And is it useful for them to use that? Enter the academics running about the correct things that they should be writing about. For the practitioners to use. Something else we have to really look at. And in the criminal justice world, as you maybe aware, We are built for the reactive mode. Just our entire system on the local level of responding to calls for service is reactive police work versus our researched approach. And so there may be a little bit of difficulty when we start thinking about public policy and developing public policy on the criminal justice realm. And how do we do that with a well- reasoned, researched approach? Let's just talk about some issues that come up in public policy and policing. And I'm only gonna get the 1 third. I'm a look at criminal justice, not courts and corrections. And there will be just as many issues dealing with those as well. Biospace policing, police corruption, use of force, less lethal, war on drugs, community-oriented policing, problem-solving policing, active shooter, suicide bomber, drones for state and local use. Amd for local and state US gun control, interoperability, Homeland Defense, use of grants from local and state organizations. Pursuit policies, driving pursuit policies, foot pursuits, staffing, modelling, school resource officers. After shooters with school resource officers. Again, each and every one of those could go through the model of May, can and should to develop policy. So let's just modify that model just a little bit. Me. Does law enforcement had the moral, constitutional, and ethical obligation to address the particular situation? And then at what level, level, federal, state, or local. Can communities actually pitch in, or should they be actually doing the job versus criminal justice? Can whatever sphere, federal, state, or local, has that responsibility of addressing that issue? It may be one of the issues that I named. Do they have the obligation to tackle it? In that we start to look for policies. And should we look for other best practice models, those such as the ICP and an association chiefs of police, perf, Police Executive Research Forum who have a plethora of public policies already in place or model policies in place. So once we
- 89. start to look at those different issues, when we go through the ME and can. Then we had to again, define that problem for criminal justice. List the different alternatives that we may take. Establish some sort of evaluation, assess those alternatives, and then implement those chosen alternatives, which brings us back to the shirt again. And the should. If we do have that obligation, that moral, constitutional authority to tackle that problem, which is the MAE on the criminal justice side. And we do have the resources at our level to deal with that problem. They can then watch the best way in terms of the political and strategic constraints. How's that agenda with respect to criminal justice policy? Best advanced, I want to introduce one term and are several different terms. The Wallace SAR model of public administration. And we can have the most well-reasoned approach that you could think of. The most statistical data that you can think of. All types of survey research. If we, if we fail to look at the Wallace SAR model of public administration, that says public administration may not necessarily be the most logical approach. It may not necessarily be the most researched approach that we have to recognize, at least the different players dealing with bargaining compromise an alliance. When we start to look at the should model in the implementation of the ship model. If we make sure that we also recognize that environment of bargaining compromise an alliance, then we can push that agenda forward. And how do we push it forward? And then how do we bring that message out? As a criminal justice administrator or a potential criminal justice administrator. How are you going to draft, influence and implement public policy? Are you going to get a reactive mode or you'll be in a proactive mode. Are you going to use a well-reasoned approach? May, can and should, and then the building blocks for that. Or are you going to be forced into or just take the convenient approach of using a politically expedient model that may be used today in several different organizations. And let me add one other question. How does your Christian worldview affect your policy analysis and your policy implementation? Thank you and have a
- 90. great day. The Tyranny of Data? The Bright and Dark Sides of Data- Driven Decision-Making for Social Good · May 2017 DOI: 10.1007/978-3-319-54024-5_1 · In book: Transparent Data Mining for Big and Small Data (pp.3- 24) Authors: Bruno Lepri · Fondazione Bruno Kessler Jacopo Staiano · Università degli Studi di Trento David Sangokoya Emmanuel Francis Letouzé · Massachusetts Institute of Technology Show all 5 authors Download full-text PDFRead full-text Download full-text PDF Read full-text Download citation Citations (64) References (116) Figures (2) Abstract and Figures The unprecedented availability of large-scale human behavioral
- 91. data is profoundly changing the world we live in. Researchers, companies, governments, financial institutions, non- governmental organizations and also citizen groups are actively experimenting, innovating and adapting algorithmic decision- making tools to understand global patterns of human behavior and provide decision support to tackle problems of societal importance. In this chapter, we focus our attention on social good decision-making algorithms, that is algorithms strongly influencing decision-making and resource optimization of public goods, such as public health, safety, access to finance and fair employment. Through an analysis of specific use cases and approaches, we highlight both the positive opportunities that are created through data-driven algorithmic decision- making, and the potential negative consequences that practitioners should be aware of and address in order to truly realize the potential of this emergent field. We elaborate on the need for these algorithms to provide transparency and accountability, preserve privacy and be tested and evaluated in context, by means of living lab approaches involving citizens. Finally, we turn to the requirements which would make it possible to leverage the predictive power of data-driven human behavior analysis while ensuring transparency, accountability, and civic participation. Requirements summary for positive data-driven disruption. … Summary table for the literature discussed in Section 2. …
- 92. Figures - uploaded by Nuria Oliver Author content Content may be subject to copyright. Discover the world's research · 20+ million members · 135+ million publications · 700k+ research projects Join for free Content uploaded by Nuria Oliver Author content Content may be subject to copyright. The Tyranny of Data? The Bright and Dark Sides of Data-Driven Decision-Making for Social Good Bruno Lepri, Jacopo Staiano, David Sangokoya, Emmanuel Letouz´e and Nuria Oliver Abstract The unprecedented availability of large-scale human behavioral data is profoundly changing the world we live in. Researchers, companies, governments, financial institutions, non-governmental organizations and also citizen groups are actively experimenting, innovating and adapting algorith- mic decision-making tools to understand global patterns of human behavior and provide decision support to tackle problems of societal importance. In this chapter, we focus our attention on social good decision-making algorithms,
- 93. that is algorithms strongly influencing decision-making and resource opti- mization of public goods, such as public health, safety, access to finance and fair employment. Through an analysis of specific use cases and approaches, we highlight both the positive opportunities that are created through data- driven algorithmic decision-making, and the potential negative consequences that practitioners should be aware of and address in order to truly realize the potential of this emergent field. We elaborate on the need for these algo- rithms to provide transparency and accountability, preserve privacy and be tested and evaluated in context, by means of living lab approaches involving citizens. Finally, we turn to the requirements which would make it possible to leverage the predictive power of data-driven human behavior analysis while ensuring transparency, accountability, and civic participation. Bruno Lepri Fondazione Bruno Kessler e-mail: [email protected] Jacopo Staiano Fortia Financial Solution s e-mail: [email protected] David Sangokoya Data-Pop Alliance e-mail: [email protected]
- 94. Emmanuel Letouz´e Data-Pop Alliance and MIT Media Lab e-mail: [email protected] Nuria Oliver Data-Pop Alliance e-mail: [email protected] 1 arXiv:1612.00323v2 [cs.CY] 2 Dec 2016 2 Authors Suppressed Due to Excessive Length 1 Introduction The world is experiencing an unprecedented transition where human behav- ioral data has evolved from being a scarce resource to being a massive and real-time stream. This availability of large-scale data is profoundly chang- ing the world we live in and has led to the emergence of a new discipline called computational social science [45]; finance, economics, marketing, pub- lic health, medicine, biology, politics, urban science and
- 95. journalism, to name a few, have all been disrupted to some degree by this trend [41]. Moreover, the automated analysis of anonymized and aggregated large- scale human behavioral data off ers new possibilities to understand global patterns of human behavior and to help decision makers tackl e problems of societal importance [45], such as monitoring socio-economic depriva- tion [8, 75, 76, 88] and crime [11, 10, 84, 85, 90], mapping the propaga- tion of diseases [37, 94], or understanding the impact of natural disasters [55, 62, 97]. Thus, researchers, companies, governments, financial institutions, non-governmental organizations and also citizen groups are actively exper- imenting, innovating and adapting algorithmic decision-making tools, often relying on the analysis of personal information. However, researchers from diff erent disciplinary backgrounds have iden- tified a range of social, ethical and legal issues surrounding data-driven
- 96. decision-making, including privacy and security [19, 22, 23, 56], transparency and accountability [18, 61, 99, 100], and bias and discrimination [3, 79]. For example, Barocas and Selbst [3] point out that the use of data- driven decision making processes can result in disproportionate adverse outcomes for disad- vantaged groups, in ways that look like discrimination. Algorithmic decisions can reproduce patterns of discrimination, due to decision makers’ prejudices [60], or reflect the biases present in the society [60]. In 2014, the White House released a report, titled “Big Data: Seizing opportunities, preserving values” [65] that highlights the discriminatory potential of big data, including how it could undermine longstanding civil rights protections governing the use of personal information for credit, health, safety, employment, etc. For exam- ple, data-driven decisions about applicants for jobs, schools or credit may be aff ected by hidden biases that tend to flag individuals from
- 97. particular de- mographic groups as unfavorable for such opportunities. Such outcomes can be self-reinforcing, since systematically reducing individuals’ access to credit, employment and educational opportunities may worsen their situation, which can play against them in future applications. In this chapter, we focus our attention on social good algorithms, that is algorithms strongly influencing decision-making and resource optimization of public goods, such as public health, safety, access to finance and fair em- ployment. These algorithms are of particular interest given the magnitude of their impact on quality of life and the risks associated with the information asymmetry surrounding their governance.
- 99. Title Suppressed Due to Excessive Length 3 In a recent book, William Easterly evaluates how global economic devel- opment and poverty alleviation projects have been governed by a “tyranny of experts” – in this case, aid agencies, economists, think tanks and other ana- lysts – who consistently favor top-down, technocratic governance approaches at the expense of the individual rights of citizens [28]. Easterly details how these experts reduce multidimensional social phenomena such as poverty or justice into a set of technical solutions that do not take into account either the political systems in which they operate or the rights of intended benefi- ciaries. Take for example the displacement of farmers in the Mubende district of Uganda: as a direct result of a World Bank project intended to raise the re- gion’s income by converting land to higher value uses, farmers in this district
- 100. were forcibly removed from their homes by government soldiers in order to prepare for a British company to plant trees in the area [28]. Easterly under- lines the cyclic nature of this tyranny: technocratic justifications for specific interventions are considered objective; intended beneficiarie s are unaware of the opaque, black box decision-making involved in these resource optimiza- tion interventions; and experts (and the coercive powers which employ them) act with impunity and without redress. If we turn to the use, governance and deployment of big data approaches in the public sector, we can draw several parallels towards what we refer to as the “tyranny of data”, that is the adoption of data-driven decision- making under the technocratic and top-down approaches higlighted by Easterly [28]. We elaborate on the need for social good decision-making algorithms to provide transparency and accountability, to only use personal information – owned
- 101. and controlled by individuals – with explicit consent, to ensure that privacy is preserved when data is analyzed in aggregated and anonymized form, and to be tested and evaluated in context, that is by means of living lab approaches involving citizens. In our view, these characteristics are crucial for fair data- driven decision-making as well as for citizen engagement and participation. In the rest of this chapter, we provide the readers with a compendium of the issues arising from current big data approaches, with a particular fo- cus on specific use cases that have been carried out to date, including urban crime prediction [10], inferring socioeconomic status of countries and individ- uals [8, 49, 76], mapping the propagation of diseases [37, 94] and modeling individuals’ mental health [9, 20, 47]. Furthermore, we highlight factors of risk (e.g. privacy violations, lack of transparency and discrimination) that might arise when decisions potentially impacting the daily lives
- 102. of people are heavily rooted in the outcomes of black-box data-driven predictive models. Finally, we turn to the requirements which would make it possible to leverage the predictive power of data-driven human behavior analysis while ensuring transparency, accountability, and civic participation. 4 Authors Suppressed Due to Excessive Length 2 The rise of data-driven decision-making for social good The unprecedented stream of large-scale, human behavioral data
- 103. has been described as a “tidal wave” of opportunities to both predict and act upon the analysis of the petabytes of digital signals and traces of human actions and interactions. With such massive streams of relevant data to mine and train algorithms with, as well as increased analytical and technical capacities, it is of no surprise that companies and public sector actors are turning to machine learning-based algorithms to tackle complex problems at the limits of human decision-making [36, 96]. The history of human decision- making – particularly when it comes to questions of power in resource allocation, fairness, justice, and other public goods – is wrought with innumerable examples of extreme bias, leading towards corrupt, inefficient or unjust processes and outcomes [2, 34, 70, 87]. In short, human decision-making has shown significant limitations and the turn towards data-driven algorithms reflects a search for objectivity,
- 104. evidence-based decision-making, and a better understanding of our resources and behaviors. Diakopoulos [27] characterizes the function and power of algorithms in four broad categories: 1) classification, the categorization of information into separate “classes”, based on its features; 2) prioritization, the denotation of emphasis and rank on particular information or results at the expense of others based on a pre-defined set of criteria; 3) association, the determination of correlated relationships between entities; and 4) filtering, the inclusion or exclusion of information based on pre-determined criteria. Table 1 provides examples of types of algorithms across these categories. Table 1 Algorithmic function and examples, adapted from Diakopoulos [27] and Latzer et al. [44] Function Type Examples Prioritization General and search engines, meta search engines, semantic
- 105. search engines, questions & answers services Google, Bing, Baidu; image search; social media; Quora; Ask.com Classification Reputation systems, news scoring, credit scoring, social scoring Ebay, Uber, Airbnb; Reddit, Digg; CreditKarma; Klout Association Predicting developments and trends ScoreAhit, Music Xray, Google Flu Trends Filtering Spam filters, child protection filters, recommender systems, news aggregators Norton; Net Nanny; Spotify, Netflix; Facebook Newsfeed This chapter places emphasis on what we call social good algorithms – al- gorithms strongly influencing decision-making and resource optimization for
- 106. Title Suppressed Due to Excessive Length 5 public goods. These algorithms are designed to analyze massive amounts of human behavioral data from various sources and then, based on pre- determined criteria, select the information most relevant to their intended purpose. While resource allocation and decision optimization over limited re- sources remain common features of the public sector, the use of social good algorithms brings to a new level the amount of human behavioral data that public sector actors can access, the capacities with which they
- 107. can analyze this information and deliver results, and the communities of experts and common people who hold these results to be objective. The ability of these algorithms to identify, select and determine information of relevance beyond the scope of human decision-making creates a new kind of decision optimization faciliated by both the design of the algorithms and the data from which they are based. However, as discussed later in the chapter, this new process is often opaque and assumes a level of impartiality that is not always accurate. It also creates information asymmetry and lack of transparency between actors using these algorithms and the intended beneficiaries whose data is being used. In the following sub-sections, we assess the nature, function and impact of the use of social good algorithms in three key areas: criminal behavior dynamics and predictive policing; socio-economic deprivation and financial
- 108. inclusion; and public health. 2.1 Criminal behavior dynamics and predictive policing Researchers have turned their attention to the automatic analysis of criminal behavior dynamics both from a people- and a place-centric perspectives. The people-centric perspective has mostly been used for individual or collective criminal profiling [67, 72, 91]. For example, Wang et al. [91] proposed a ma- chine learning approach, called Series Finder, to the problem of detecting specific patterns in crimes that are committed by the same off ender or group of off enders. In 2008, the criminologist David Weisburd proposed a shift from a people- centric paradigm of police practices to a place-centric one [93], thus focusing on geographical topology and micro-structures rather than on criminal profil- ing. An example of a place-centric perspective is the detection, analysis, and interpretation of crime hotspots [16, 29, 53]. Along these lines, a novel appli-
- 109. cation of quantitative tools from mathematics, physics and signal processing has been proposed by Toole et al. [84] to analyse spatial and temporal pat- terns in criminal off ense records. Their analyses of crime data from 1991 to 1999 for the American city of Philadelphia indicated the existence of multi- scale complex relationships in space and time. Further, over the last few years, aggregated and anonymized mobile phone data has opened new possibilities to study city dynamics with unprecedented temporal and spatial granular- 6 Authors Suppressed Due to Excessive Length
- 110. ities [7]. Recent work has used this type of data to predict crime hotspots through machine-learning algorithms [10, 11, 85]. More recently, these predictive policing approaches [64] are moving from the academic realm (universities and research centers) to police departments. In Chicago, police officers are paying particular attention to those individ- uals flagged, through risk analysis techniques, as most likely to be involved in future violence. In Santa Cruz, California, the police have reported a dra- matic reduction in burglaries after adopting algorithms that predict where new burglaries are likely to occur. In Charlotte, North Carolina, the police department has generated a map of high-risk areas that are likely to be hit by crime. The Police Departments of Los Angeles, Atlanta and more than 50 other cities in the US are using PredPol, an algorithm that generates 500 by 500 square foot predictive boxes on maps, indicating areas where crime
- 111. is most likely to occur. Similar approaches have also been implemented in Brasil, the UK and the Netherlands. Overall, four main predictive policing approaches are currently being used: (i) methods to forecast places and times with an increased risk of crime [32], (ii) methods to detect off enders and flag individuals at risk of off ending in the future [64], (iii) methods to identify perpetrators [64], and (iv) methods to identify groups or, in some cases, in- dividuals who are likely to become the victims of crime [64]. 2.2 Socio-economic deprivation and financial inclusion Being able to accurately measure and monitor key sociodemographic and eco- nomic indicators is critical to design and implement public policies [68]. For example, the geographic distribution of poverty and wealth is used by govern- ments to make decisions about how to allocate scarce resources and provides a foundation for the study of the determinants of economic growth [33, 43]. The quantity and quality of economic data available have
- 112. significantly improved in recent years. However, the scarcity of reliable key measures in develop- ing countries represents a major challenge to researchers and policy-makers1, thus hampering eff orts to target interventions eff ectively to areas of great- est need (e.g. African countries) [26, 40]. Recently, several researchers have started to use mobile phone data [8, 49, 76], social media [88] and satellite imagery [39] to infer the poverty and wealth of individual subscribers, as well as to create high-resolution maps of the geographic distribution of wealth and deprivation. The use of novel sources of behavioral data and algorithmic decision- making processes is also playing a growing role in the area of financial services, for example credit scoring. Credit scoring is a widely used tool in the financial sector to compute the risks of lending to potential credit customers. Providing 1http://www.undatarevolution.org/report/
- 113. Title Suppressed Due to Excessive Length 7 information about the ability of customers to pay back their
- 114. debts or con- versely to default, credit scores have become a key variable to build financial models of customers. Thus, as lenders have moved from traditional interview- based decisions to data-driven models to assess credit risk, consumer lending and credit scoring have become increasingly sophisticated. Automated credit scoring has become a standard input into the pricing of mortgages, auto loans, and unsecured credit. However, this approach is mainly based on the past financial history of customers (people or businesses) [81], and thus not adequate to provide credit access to people or businesses when no financial history is available. Therefore, researchers and companies are investigating novel sources of data to replace or to improve traditional credit scores, po- tentially opening credit access to individuals or businesses that traditionally have had poor or no access to mainstream financial services – e.g. people who
- 115. are unbanked or underbanked, new immigrants, graduating students, etc. Researchers have leveraged mobility patterns from credit card transactions [73] and mobility and communication patterns from mobile phones to au- tomatically build user models of spending behavior [74] and propensity to credit defaults [71, 73]. The use of mobile phone, social media, and browsing data for financial risk assessment has also attracted the attention of several entrepreneurial eff orts, such as Cignifi2, Lenddo3, InVenture4, and ZestFi- nance5. 2.3 Public health The characterization of individuals and entire populations’ mobility is of paramount importance for public health [57]: for example, it is key to predict the spatial and temporal risk of diseases [35, 82, 94], to quantify exposure to air pollution [48], to understand human migrations after natural disasters or emergency situations [4, 50], etc. The traditional approach has
- 116. been based on household surveys and information provided from census data. These meth- ods suff er from recall bias and limitations in the size of the population sample, mainly due to excessive costs in the acquisition of the data. Moreover, survey or census data provide a snapshot of the population dynamics at a given moment in time. However, it is fundamental to monitor mobility patterns in a continuous manner, in particular during emergencies in order to support decision making or assess the impact of government measures. Tizzoni et al. [82] and Wesolowski et al. [95] have compared traditional mobility surveys with the information provided by mobile phone data (Call 2http://cignifi.com/ 3https://www.lenddo.com/ 4http://tala.co/ 5https://www.zestfinance.com/
- 117. 8 Authors Suppressed Due to Excessive Length Detail Records or CDRs), specifically to model the spread of diseases. The findings of these works recommend the use of mobile phone
- 118. data, by them- selves or in combination with traditional sources, in particular in low-income economies where the availability of surveys is highly limited. Another important area of opportunity within public health is mental health. Mental health problems are recognized to be a major public health issue6. However, the traditional model of episodic care is suboptimal to pre- vent mental health outcomes and improve chronic disease outcomes. In order to assess human behavior in the context of mental wellbeing, the standard clinical practice relies on periodic self-reports that suff er from subjectivity and memory biases, and are likely influenced by the current mood state. Moreover, individuals with mental conditions typically visit doctors when the crisis has already happened and thus report limited information about precursors useful to prevent the crisis onset. These novel sources of behav- ioral data yield the possibility of monitoring mental health-
- 119. related behaviors and symptoms outside of clinical settings and without having to depend on self-reported information [52]. For example, several studies have shown that behavioral data collected through mobile phones and social media can be exploited to recognize bipolar disorders [20, 30, 59], mood [47], personality [25, 46] and stress [9]. Table 2 summarizes the main points emerging from the literture reviewed in this section. Table 2 Summary table for the literature discussed in Section 2. Key Area Problems Tackled References Predictive Policing Criminal behavior profiling Crime hotspot prediction Perpetrator(s)/victim(s) identification [67, 72, 91] [10, 11, 32, 85] [64] Finance & Economy Wealth & deprivation mapping Spending behavior profiling
- 120. Credit scoring [8, 49, 39, 76, 88] [74] [71, 73] Public Health Epidemiologic studies Environment and emergency mapping Mental Health [35, 82, 94] [4, 48, 50] [9, 20, 25, 30, 46, 47, 52, 59] 3 The dark side of data-driven decision-making for social good The potential positive impact of big data and machine learning- based ap- proaches to decision-making is huge. However, several researchers and ex- 6http://www.who.int/topics/mental_health/en/
- 122. Title Suppressed Due to Excessive Length 9 perts [3, 19, 61, 79, 86] have underlined what we refer to as the dark side of data-driven decision-making, including violations of privacy, information asymmetry, lack of transparency, discrimination and social exclusion. In this section we turn our attention to these elements before outlining three key requirements that would be necessary in order to realize the positive im- pact, while minimizing the potential negative consequences of data-driven decision-making in the context of social good.
- 123. 3.1 Computational violations of privacy Reports and studies [66] have focused on the misuse of personal data dis- closed by users and on the aggregation of data from di ff erent sources by entities playing as data brokers with direct implications in privacy. An often overlooked element is that the computational developments coupled with the availability of novel sources of behavioral data (e.g. social media data, mobile phone data, etc.) now allow inferences about private information that may never have been disclosed. This element is essential to understand the issues raised by these algorithmic approaches. A recent study by Kosinski et al. [42] combined data on Facebook “Likes” and limited survey information to accurately predict a male user’s sexual ori- entation, ethnic origin, religious and political preferences, as well as alcohol, drugs, and cigarettes use. Moreover, Twitter data has recently been used to identify people with a high likelihood of falling into depression
- 124. before the onset of the clinical symptoms [20]. It has also been shown that, despite the algorithmic advancements in anonymizing data, it is feasible to infer identities from anonymized human behavioral data, particularly when combined with information derived from additional sources. For example, Zang et al. [98] have reported that if home and work addresses were available for some users, up to 35% of users of the mobile network could be de-identified just using the two most visited tow- ers, likely to be related to their home and work location. More recently, de Montjoye et al. [22, 23] have demonstrated how unique mobility and shop- ping behaviors are for each individual. Specifically, they have shown that four spatio-temporal points are enough to uniquely identify 95% of people in a mobile phone database of 1.5M people and to identify 90% of people in a credit card database of 1M people.
- 125. 3.2 Information asymmetry and lack of transparency Both governments and companies use data-driven algorithms for decision making and optimization. Thus, accountability in government and corporate 10 Authors Suppressed Due to Excessive Length use of such decision making tools is fundamental in both validating their utility toward the public interest as well as redressing harms generated by these algorithms. However, the ability to accumulate and manipulate behavioral data about
- 126. customers and citizens on an unprecedented scale may give big companies and intrusive/authoritarian governments powerful means to manipulate seg- ments of the population through targeted marketing eff orts and social control strategies. In particular, we might witness an information asymmetry situa- tion where a powerful few have access and use knowledge that the majority do not have access to, thus leading to an –or exacerbating the existing– asym- metry of power between the state or the big companies on one side and the people on the other side [1]. In addition, the nature and the use of various data-driven algorithms for social good, as well as the lack of computational or data literacy among citizens, makes algorithmic transparency difficult to generalize and accountability difficult to assess [61]. Burrell [12] has provided a useful framework to characterize three diff er- ent types of opacity in algorithmic decision-making: (1) intentional opacity,
- 127. whose objective is the protection of the intellectual property of the inventors of the algorithms. This type of opacity could be mitigated with legislation that would force decision-makers towards the use of open source systems. The new General Data Protection Regulations (GDPR) in the EU with a “right to an explanation” starting in 2018 is an example of such legislation7. However, there are clear corporate and governmental interests in favor of in- tentional opacity which make it difficult to eliminate this type of opacity; (2) illiterate opacity, due to the fact that the vast majority of people lack the technical skills to understand the underpinnings of algorithms and machine learning models built from data. This kind of opacity might be attenuated with stronger education programs in computational thinking and by enabling that independent experts advice those aff ected by algorithm decision-making; and (3) intrinsic opacity, which arises by the nature of certain
- 128. machine learn- ing methods that are difficult to interpret (e.g. deep learning models). This opacity is well known in the machine learning community (usually referred to as the interpretability problem). The main approach to combat this type of opacity requires using alternative machine learning models that are easy to interpret by humans, despite the fact that they might yield lower accuracy than black-box non-interpretable models. Fortunately, there is increasing awareness of the importance of reducing or eliminating the opacity of data-driven algorithmic decision- making sys- tems. There are a number of research eff orts and initiatives in this direction, including the Data Transparency Lab8which is a “community of technolo- 7Regulation (EU) 2016/679 of the European Parliament and of the Council of 27 April 2016 on the protection of natural persons with regard to the processing of personal data and on the free movement of such data, and repealing Directive